. 2025 May:82:103625.
doi: 10.1016/j.redox.2025.103625. Epub 2025 Apr 1.

Unraveling the effects of uric acid on endothelial cells: A global proteomic study

Affiliations

Unraveling the effects of uric acid on endothelial cells: A global proteomic study

Bianca Dempsey et al. Redox Biol. 2025 May.

Abstract

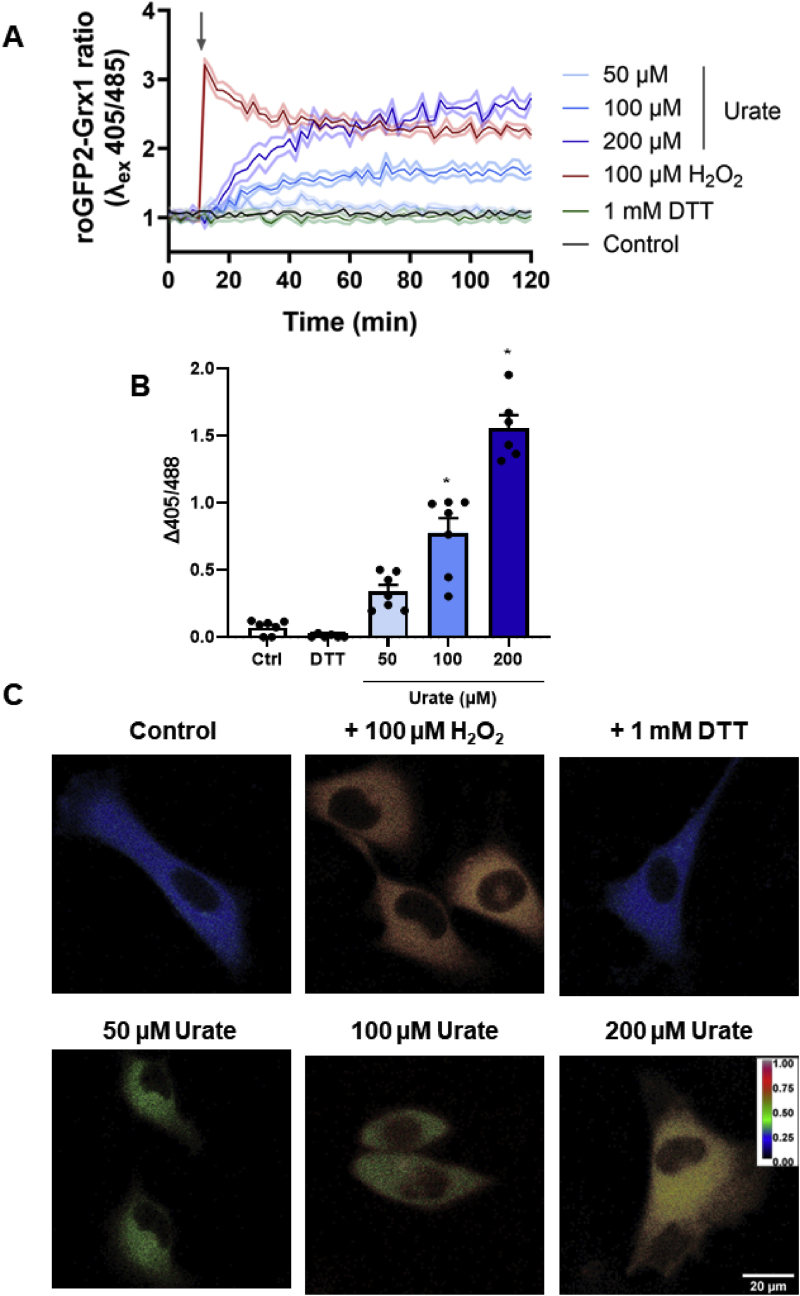
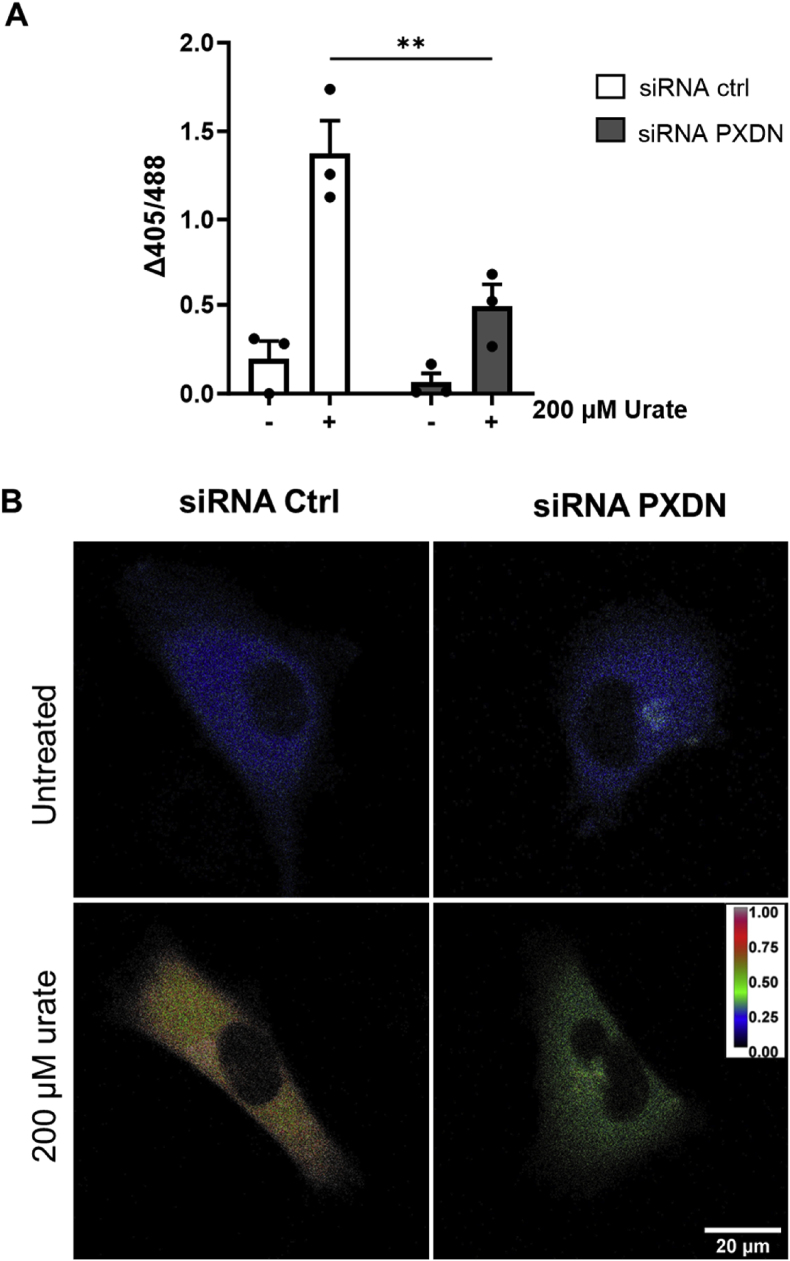
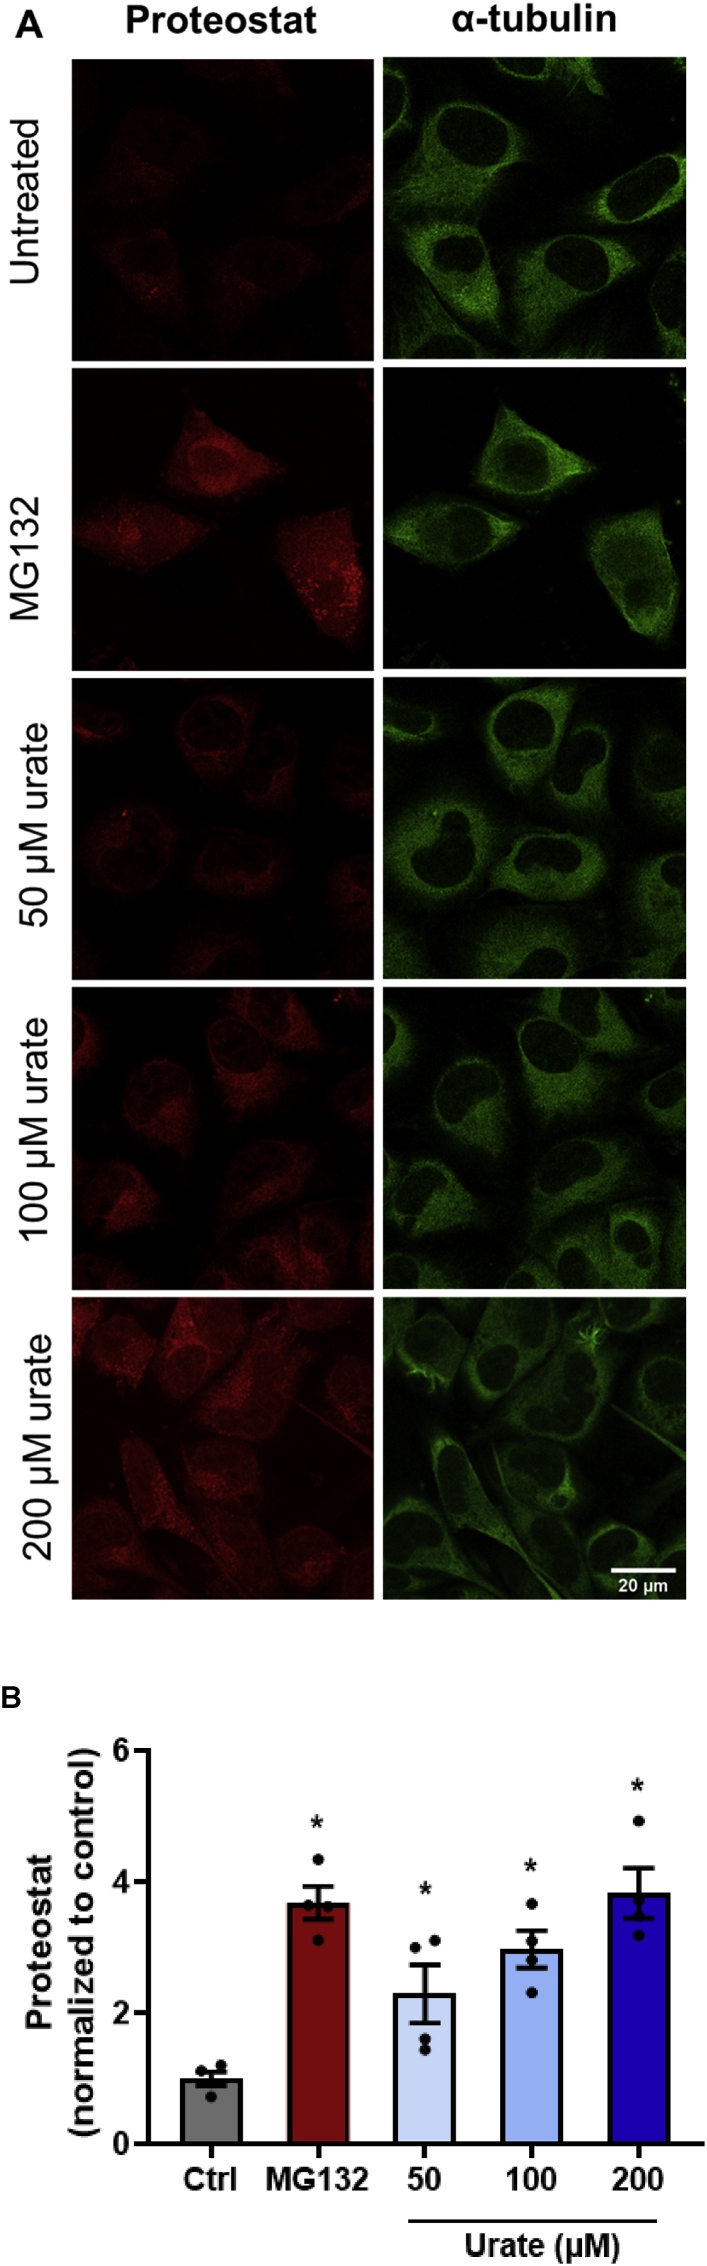
This work aims to understand how normouricemic levels of uric acid can induce endothelial dysfunction seeking global proteomic alterations in Human Umbilical Vein cells (HUVEC). It reveals significant alterations in redox-sensitive and antioxidant proteins, chaperones, and proteins associated with cell migration and adhesion in response to uric acid exposure. Monitoring cellular oxidation with the roGFP2-Grx1 probe proved increased oxidation levels induced by uric acid, which can be attenuated by peroxidasin (PXDN) inhibition, suggesting a regulatory role for PXDN in mitigating oxidative stress induced by uric acid. As a consequence of uric acid oxidation and the formation of reactive intermediate, we identified adducts in proteins (+140 kDa) in a novel post-translation modification named uratylation. Increased misfolded protein levels and p62 aggregation were also found, indicating disturbances in cellular proteostasis. Furthermore, uric acid promoted monocyte adhesion and upregulated ICAM and VCAM protein levels, implicating a pro-inflammatory response in endothelial cells. These findings provide critical insights into the molecular mechanisms underlying vascular damage associated with uric acid.

Keywords: Endothelial cell damage; HUVEC; Inflammation; PXDN; Proteomics; Uric acid.


Conflict of interest statement

Declaration of competing interest The authors declare no conflict of interest.

Figures

Image 1
Graphical abstract
Fig. 1
Fig. 1
– Oxidation of urate by peroxidases can produce urate-radical, 5-hydroxyisourate, urate hydroperoxide, adducts in lysine residues (R) and allantoin [28,29,31,34].
Fig. 2
Fig. 2
– Label-free proteomics data from HUVEC untreated (green) or treated with three different concentrations of urate 50 μM (orange), 100 μM (purple), and 200 μM (pink) in secretome 1:30 (A) or 24 h (B) after urate incubation or whole-cell lysate 1:30 (C) or 24 h (D) after urate incubation. Hierarchical clustering (left panel) of significantly altered proteins was obtained by ANOVA correcting for multiple comparisons using FDR<0.05, and proteins were grouped into 2 clusters (1 – green and 2 – light purple). Relative expression values are displayed as a gradient from red (higher amount) to blue (lower amount). Rows (proteins) are centered; unit variance scaling is applied to rows (treatment). Both rows and columns are clustered using Euclidean distance and average linkage. Principal component analysis (PCA) (right panel) from the studied groups. Unit variance scaling is applied to rows; SVD with imputation is used to calculate principal components. X and Y axis show principal component 1 and principal component 2 that explain the shown percentages of the total variance, respectively. Prediction ellipses are such that with probability 0.95. Representative data from two independent experiments in technical replicates. Images were obtained by ClustVis (https://biit.cs.ut.ee/clustvis/).
Fig. 2
Fig. 2
– Label-free proteomics data from HUVEC untreated (green) or treated with three different concentrations of urate 50 μM (orange), 100 μM (purple), and 200 μM (pink) in secretome 1:30 (A) or 24 h (B) after urate incubation or whole-cell lysate 1:30 (C) or 24 h (D) after urate incubation. Hierarchical clustering (left panel) of significantly altered proteins was obtained by ANOVA correcting for multiple comparisons using FDR<0.05, and proteins were grouped into 2 clusters (1 – green and 2 – light purple). Relative expression values are displayed as a gradient from red (higher amount) to blue (lower amount). Rows (proteins) are centered; unit variance scaling is applied to rows (treatment). Both rows and columns are clustered using Euclidean distance and average linkage. Principal component analysis (PCA) (right panel) from the studied groups. Unit variance scaling is applied to rows; SVD with imputation is used to calculate principal components. X and Y axis show principal component 1 and principal component 2 that explain the shown percentages of the total variance, respectively. Prediction ellipses are such that with probability 0.95. Representative data from two independent experiments in technical replicates. Images were obtained by ClustVis (https://biit.cs.ut.ee/clustvis/).
Fig. 3
Fig. 3
– Uric acid increases roGFP2-Grx1 oxidation in HUVEC. A) Fluorescence kinetics of HUVEC transfected with roGFP2-Grx1 in the absence (control) or presence of 100 μM H2O2, urate (50–200 μM), or 1 mM DTT. Fluorescence was monitored using the excitation wavelengths of 405 and 485 nm for a 510 nm emission for 2h in a plate reader. Representative image from a single experiment with 5 replicates per group. Data was plotted as roGFP-Grx1 ratio (405/485) ± SEM (light shadow). B) Difference between the initial and final fluorescence 405/485 ratio from 2 h incubation time. Bar graphs show the mean ± SEM from seven independent experiments. Statistical analysis was performed by ordinary one-way ANOVA and Tukey's multiple comparisons test, with p < 0.05 (∗) when compared to control. C) Confocal microscopy imaging of HUVEC roGFP2-Grx1 cells. A confocal microscope was used to acquire images using an excitation wavelength of 405 (oxidized) and 485 (reduced) nm for a 510–540 nm emission wavelength. Fluorescence ratio images from the two channels were constructed from ImageJ. Images have been treated to show a color scheme that reflects the oxidation level of the probe from blue (reduced) to red (oxidized).
Fig. 4
Fig. 4
– roGFP2-Grx1 oxidation in HUVEC after urate treatment. Cells were pre-treated with Apocynin (10 μM), PHG (50 μM), or DPI (1 μM) for 20 min before 200 μM urate treatment. (A) Confocal microscopy imaging of HUVEC-Grx1-roGFP2 cells after 2 h incubation. A confocal microscope was used to acquire images using an excitation wavelength of 405 (oxidized) and 485 (reduced) nm for a 510–540 nm emission wavelength. Fluorescence ratio images from the two channels were constructed from ImageJ, generating a color scale from blue to red, that corresponds to the relative oxidation level of the probe. B) Difference between the initial and final fluorescence 405/485 ratio with 2 h incubation time. Bar graphs show mean ± SEM from seven independent experiments. Statistical analysis was performed by two-way ANOVA and Tukey's multiple comparisons test. Statistical significance is shown as p < 0.001 (∗∗). Cells without uric acid did not have significant differences between oxidation levels.
Fig. 5
Fig. 5
– PXDN silencing prevents roGFP2-Grx1 oxidation in HUVEC. HUVEC cells were harvested and resuspended in HBSS buffer (750 cells/μL) in a final volume of 200 μL. Cells were incubated in a black 96-well plate in the plate reader. The experiment was performed 48 h-post siRNA transfection. A) Difference between the initial and final fluorescence 405/485 ratio with 2 h incubation time. Bar graphs are the mean ± SEM of three independent experiments. Statistical analysis was performed by ordinary two-way ANOVA and Tukey's multiple comparisons test. Statistical significance is shown as p < 0.001 (∗∗) B) Confocal microscopy imaging of HUVEC-Grx1-roGFP2 cells after 2 h incubation. 24 h post-transfection cells were plated in 8 well-coverslips in a density of 10 A confocal microscope was used to acquire images using an excitation wavelength of 405 (oxidized) and 485 (reduced) nm for a 510–540 nm emission wavelength. Fluorescence ratio images from the two channels were constructed from ImageJ, generating a color scale from blue to red, that corresponds to the relative oxidation level of the probe.
Fig. 6
Fig. 6
– Urate treatment increased misfolding proteins and aggregates in HUVEC. A) Confocal microscopy analysis of Proteostat dye (red) and α-tubulin (green) of HUVEC cells upon incubation with 1 μM MG132 for 6 h (positive control) and urate (50–200 μM) for 24 h. Images were obtained by confocal microscopy using the default Rhodamine set filter and a FITC filter for α-tubulin (Leica Microsystems – LAX Office software). B) Quantification of Proteostat staining normalized by α-tubulin intensity was obtained with ImageJ for 4 independent experiments, using 10 pictures per experiment that contained 4–7 cells per image field. Statistical analysis was performed by the Kruskal-Walli's test followed by Dunn's multiple comparisons test. Statistical significance is shown as p < 0.05 (∗) when compared to control.
Fig. 7
Fig. 7
– Urate treatment increased p62 foci expression. A) Confocal microscopy of the co-colocalization of protein aggregates stained with Proteostat probe (red) and p62 (green) MG132 1 μM was used as a positive control for protein aggregation. B) Confocal microscopy imaging of p62 expression and accumulation forming foci upon uric acid treatment for 24h. Nuclei were stained with DAPI (blue) and p62 with Alexa-Fluor-488 conjugated antibody (green). C) Foci signal total area (upper panel) and foci signal count/nucleus (lower panel) of control, MG132, and urate treatment. Quantification was performed by Particle Analysis by ImageJ plugin. Bar graphs show mean ± SEM from images containing 10–20 cells per field from four independent experiments. Statistical analysis was performed by one-way ANOVA followed by Dunnett's multiple comparisons test. Statistical significance is shown as p < 0.05 (∗) when compared to control.
Fig. 8
Fig. 8
– Urate increases the expression of ICAM and VCAM and increases monocyte adhesion. A) HUVEC were seeded on 24-well plates at an initial confluence of 5 × 104 cells/well. After 3 days, cells were washed with PBS and incubated with urate (50–200 μM) in RPMI medium without phenol red and fetal bovine serum for 24 h. LPS (1 μg/mL) and TNF-α (5 ng/mL) were used as a positive control. Western blot analysis of ICAM1 and VCAM expression in HUVECs lysate after 24 h urate treatment. B) Bands densitometry was quantified by Image J. Bars are mean ± S.E.M of relative protein level quantification of 4 independent experiments (protein signal/loading control). D) Assessment of THP-1 cell adhesion to HUVEC cells after urate treatment. HUVECs were seeded on 24-well plates at an initial confluence of 5 × 104 cells/well. After 3 days, cells were washed with PBS and incubated with urate (50–200 μM), LPS (1 μg/mL) or TNF-α (5 ng/mL) for 24 h. THP-1 cells previously stained with calcein-AM were added (4 × 105 cells per well) over the monolayer of HUVEC. After 1 h incubation, non-adhered cells were removed, followed by washing with PBS. The images were captured using a fluorescence microscope and the quantification of the number of attached cells (E) was performed using the Image-J software. Bar graphs represent the mean ± S.E.M. of four independent experiments, using five pictures for each experiment. Statistical analysis was performed by ordinary one-way ANOVA and Tukey's multiple comparisons test for control and urate treatments. Statistical significance is shown as p < 0.05 (∗) when compared to control. Statistical analysis was performed by ordinary one-way ANOVA for control and urate treatments. Statistical significance is shown as p < 0.05 (∗) when compared to control.

Similar articles

Cited by

References

    1. Hediger M.A., Johnson R.J., Miyazaki H., Endou H. Molecular physiology of urate transport. Physiology. 2005;20:125–133. doi: 10.1152/physiol.00039.2004. - DOI - PubMed
    1. Mandal A.K., Mount D.B. The molecular physiology of uric acid homeostasis. Annu. Rev. Physiol. 2015;77:323–345. doi: 10.1146/annurev-physiol-021113-170343. - DOI - PubMed
    1. Barsoum R., El-Khatib M. Uric acid and life on earth. J. Adv. Res. 2017;8:471–474. doi: 10.1016/j.jare.2017.06.001. - DOI - PMC - PubMed
    1. Becker B.F. Towards the physiological function of uric acid. Free Radic. Biol. Med. 1993;14:615–631. - PubMed
    1. Kaur H., Halliwell B. Action of biologically-relevant oxidizing species upon uric acid. Identification of uric acid oxidation products. Chem. Biol. Interact. 1990;73:235–247. doi: 10.1016/0009-2797(90)90006-9. - DOI - PubMed

MeSH terms

LinkOut - more resources