. 2025 Apr 9;16(1):3369.
doi: 10.1038/s41467-025-58289-1.

Immunotherapy with conventional type-1 dendritic cells induces immune memory and limits tumor relapse

Affiliations

Immunotherapy with conventional type-1 dendritic cells induces immune memory and limits tumor relapse

Ignacio Heras-Murillo et al. Nat Commun. .

Abstract

The potential of dendritic cell (DC) vaccination against cancer is not fully achieved. Little is known about the precise nature of the anti-cancer immune response triggered by different natural DC subsets and their relevance in preventing postsurgical tumor recurrence. Here, we use mouse splenic conventional DC1s (cDC1s) or cDC2s pulsed with tumor cell lysates to generate DC vaccines. cDC1-based vaccination induces a stronger effector and memory CD4+ and CD8+ anti-tumor T cell response, leading to a better control of tumors treated either therapeutically or prophylactically. Using an experimental model of tumor relapse, we show that adjuvant or neoadjuvant cDC1 vaccination improves anti-tumor immune memory, particularly by increasing the infiltrates of CD4+ tissue resident memory (Trm) and CD8+ memory T cells. This translates into complete prevention of tumor relapses. Moreover, elevated abundance of cDC1s positively correlates with CD4+ Trm presence, and both associate with enhanced survival in human breast cancer and melanoma. Our findings suggest that cDC1-based vaccination excels at immune memory induction and prevention of cancer recurrence.


Conflict of interest statement

Competing interests: S.K.W. serves as a consultant for ONA therapeutics (Barcelona, Spain). D.S. has a research collaboration agreement with Inmunotek SL (Alcala de Henares). I.M. reports grant funding from Roche, BMS, Astrazeneca, Genmab, and Pharmamar and advisory roles with Roche-Genentech, Bristol-Myers Squibb, Astrazeneca, F-Star, Genmab, Third Rock Ventures, Amunix Pharmaceuticals, Alligator, Bioncotech, Boston Therapeutics, Bright Peak, Numab, Catalym, Pieris, and Pharmamar. The rest of the authors declare no competing interests.

Figures
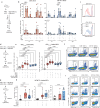
Fig. 1
Fig. 1. Transfer of activated and tumor antigen-loaded splenic cDC1s outperforms cDC2s in inducing a cancer-specific CD4+ Th1 and CD8+ T cell effector response.
a Experimental overview for b-c: splenic cDC1s and cDC2s were incubated with B16-OVA TCL and TLR agonists for 1, 4, and 16 h (overnight, ON) and co-cultured with cell trace violet (CTV)-labeled naive OT-I or OT-II cells. b Flow cytometric analysis of frequency of divided OT-I and OT-II cells (n = 3 biological replicates/group from 3 independent experiments). c Representative histograms depicting CTV dilution for OT-I and OT-II co-cultured with 1 h (cDC1s) or 4 h (cDC2s) TCL+CpG-pulsed cDCs. d Experimental overview for (e, f): B16-OVA TCL + TLR agonist-treated cDC1s (1 h) and cDC2s (4 h) were injected intradermally in the flank of mice. Controls received PBS injection. IFNγ production by T cells in the iLN upon restimulation was assessed 7 days later. e Log-transformed number of activated CD44+ IFNγ+ CD8+ or CD4+ T cells in iLN (left to right: n = 10, 10, 10, 11, 7, 8, 7 [OVA257-264]; 16, 15, 19, 17, 12, 14, 13 [OVA323-339] biological replicates/group from 4 independent experiments). f Representative dot plots of CD8+ and CD4+ T cells from the iLN of mice untreated or treated with TCL+CpG-incubated cDC1s or cDC2s. g Experimental overview for (h, i): MC38 TCL+CpG-pulsed cDC1s (1 h) and cDC2s (4 h) were injected intradermally in the flank of mice. Controls received PBS injection. 7 days later, the IFNγ, TNFα, and IL17A production by CD4+ T cells in the iLN upon restimulation with MC38 TCL-loaded APCs was evaluated. h, Frequency of CD44+ IFNγ+, TNFα+, and IL17A+ in CD4+ T cells in iLN (n = 15 [PBS], 20 [cDC1], 16 [cDC2] biological replicates/group from 4 independent experiments). i Representative dot plots of CD4+ T cells of mice untreated or treated with CpG+TCL-incubated cDC1s or cDC2s. Data are presented as mean ± SEM (b) or box plots where whiskers represent minimum and maximum values, boxes indicate median, 25th, and 75th percentiles (e, h). Dots represent individual data points. Statistical analysis by paired (b) or unpaired (e, h) one-way ANOVA Tukey post-hoc test. Source data are provided as Source Data file.
Fig. 2
Fig. 2. The therapeutic efficacy of cDC1-based anti-cancer vaccination is superior to cDC2s.
a Experimental overview for (b, c): 4 × 105 B16-OVA cells were intravenously (i.v.) injected into naive mice. On day 3, the mice received an i.v. injection of 106 B16-OVA-TCL+CpG-pulsed splenic cDC1s or cDC2s or PBS as control. Lungs were harvested on day 21 for analysis. b Lung area covered by tumor nodules normalized to untreated control lungs is shown (n = 12 [control], 14 [cDC1], 8 [cDC2] biological replicates/group from 2 independent experiments). c Representative image of 3 lung lobes harboring tumor nodules. d Experimental overview for (e, f): 5 × 105 MC38 cells were subcutaneously (s.c.) injected in the right flank of naive mice. On day 3 and 8, the mice received intradermal (i.d.) injections of 106 MC38-TCL+CpG-pulsed splenic cDC1s or cDC2s or PBS (control). e Tumor growth and (f) humane endpoint are shown (n = 27 [control], 12 [cDC1], 14 [cDC2] biological replicates/group from 3 independent experiments). Data are presented as mean ± SEM (dots represent individual data points). Statistical analysis by one-way ANOVA and Tukey post-hoc test (b), two-way ANOVA (e) and Mantel-Cox test (f). Source data are provided as Source Data file.
Fig. 3
Fig. 3. Treatment with cDC1s results in more effective prophylactic anti-cancer vaccination than cDC2 administration.
a Experimental overview for (b): Control PBS or 2.5 × 104, 2 × 105 or 4 × 105 B16-OVA-TCL+CpG-pulsed splenic cDC1s or cDC2s were intravenously (i.v.) injected into naive mice. 30 days later, 4 × 105 B16-OVA cells were i.v. injected and lungs harvested 21 days thereafter. b Counts of tumor nodules on the lung surface are shown (left to right: n = 20, 13, 12, 10, 13, 11, 10 biological replicates/group from 3 independent experiments). c Experimental overview for (d, e), Control PBS or MC38-TCL+CpG-pulsed splenic cDC1s or cDC2s were intradermally (i.d.) injected into naive mice. 30 days later, 5×10⁵ MC38 cells were subcutaneously (s.c.) injected into the right flank. d, e Tumor growth and humane endpoint determined after prophylactic i.d. injection of 105 (d) or 4 × 105 (e) cDCs are shown (n = 8 [control], 9 [105 cDC1], 10 [4 × 105 cDC1], 8 [105 cDC2], 10 [4 × 105 cDC2] biological replicates/group from 2 independent experiments). f Experimental overview for (g, h): XCR1DTRvenus mice were treated with diphtheria toxin (DT) at days −2, −1, 0, 2 and vaccinated i.v. with 2 × 105 B16-OVA-TCL loaded cDC1s at day 0 or injected with control PBS. 30 days later, 4 × 105 B16-OVA cells were i.v. injected and lungs harvested 21 days thereafter. g Representative flow cytometry plots of cDC1 and cDC2 presence in the spleen (left) and lung (right) of XCR1DTRvenus mice inoculated or not with DT at day 0 (just before cDC1 vaccination). h Counts of tumor nodules on the lung surface are shown (n = 11 [control], 14 [cDC1], 15 [cDC2] biological replicates/group from 2 independent experiments). Data are presented as mean ± SEM (dots represent individual data points). Statistical analysis by one-way ANOVA and Tukey post hoc test (b, h), two-way ANOVA (d) and Mantel-Cox test (e). Source data are provided as Source Data file.
Fig. 4
Fig. 4. Dead tumor cell-loaded cDC1s are superior in induction of anti-cancer T cell memory compared with cDC2s.
a Experimental overview for (b, c): naive mice were i.v. injected with 3 × 105 naive CD45.1+ CD44- CD62L+ CD8+ OT-I T cells and, the following day, 2.5 × 104 or 2 × 105 B16-OVA TCL+CpG-pulsed splenic cDC1s or cDC2s or control PBS were i.v. administered. 30 days thereafter, spleen and mediastinal lymph node (mdLN) were analyzed by flow cytometry. b Numbers of antigen experienced CD44+ CD45.1+ CD8+ OT-I T cells in tissues of mice are shown (left to right: n = 6, 9, 10, 11, 10 [mdLN]; 6, 10, 10, 11, 10 [spleen] biological replicates/group from 2 independent experiments). c Representative flow cytometry plot of the spleen of control mice or mice treated with 2 × 105 cDC1s or cDC2s (gated on alive CD3+ CD8+). d Experimental overview for (eg): naive mice were i.v. injected with naive CD45.1+ CD44- CD62L+ CD8+ OT-I T cells one day prior to intradermal prime and boost administration (in the ear) of control PBS, 106 cDC1s or cDC2s pulsed with CpG+B16-OVA TCL 5 days apart. The draining auricular lymph node (auLN) was restimulated with OVA protein and analyzed after 30 days by flow cytometry (n = 3 [control], 4 [cDC1], 4 [cDC2] biological replicates/group from one experiment). e Frequency of CD45.1+ OT-I cells in CD8+ T cells in the auLN is shown. f Frequency of endogenous IFNγ+ CD44+ within total CD45.1- CD8+ (left) or CD4+ (right) T cells in the auLN upon restimulation with OVA protein is shown. g Representative flow cytometry plot of OVA-restimulated endogenous CD45.1- CD8+ T cells in the auLN. Data are presented as mean ± SEM (dots represent individual data points). Statistical analysis by one-way ANOVA and Tukey post hoc test. Source data are provided as Source Data file.
Fig. 5
Fig. 5. cDC1 anti-cancer vaccination blocks experimental cancer recurrence after tumor resection.
a, b Experimental overview for (cf): 5×10⁵ MC38 cells were intradermally (i.d.) injected into naive mice (flank), and cancer growth monitored until day 10, when tumors were resected. Mice received adjuvant (post-surgery, day 13 and 18) (a, c, d) or neoadjuvant (pre-surgery, day 3 and 8) (b, e, f) treatments with anti-PD1 antibody intraperitoneally (i.p.), 106 MC38-TCL loaded cDC1s (i.d.), or PBS control. 30 days after the last intervention, 1.5 × 106 MC38 cells were reinjected (same flank) and tumor growth (c, e) and survival (d, f) monitored. Tumor naive mice only received MC38 cells at day 48 (c, d; n = 11 [control], 11, [anti-PD1], 12 [cDC1], 8 [naïve]) or 40 (e, f; n = 10 [control], 12, [anti-PD1], 9 [cDC1], 7 [naïve]). n represents biological replicates/group from 2 independent experiments). g Experimental overview for (h, i): 105 B16-F10 cells were i.d. injected and on day 12 tumors were resected. On days 4 and 10, mice were treated with B16-F10-TCL loaded cDC1s (106, i.d.), or control PBS. On day 39, 7 × 105 B16-F10 cells were i.d. injected in the same flank, and tumor growth (h) and survival (i) monitored. Tumor naive mice were only injected with 7 × 105 B16-F10 cell at day 39 (n = 6 [control], 7 [cDC1], 7 [cDC2] biological replicates/group from one experiment). j Experimental overview for (k, l): 5 × 105 MC38 cells were i.d. injected and on day 10 tumors were resected. On days 3 and 8, mice were treated with MC38-TCL loaded cDC1s (106, i.d.), or control PBS. At day 49 and 51 after the initial tumor graft, cDC1-treated mice were injected with anti-CD4, anti-CD8b depleting antibodies or rat IgG as control i.p. On day 52, 1.5 × 106 MC38 cells were i.d. injected in the same flank of mice, and tumor growth (k) and survival (l) monitored (n = 9 [control], 9 [cDC1+IgG], 10 [cDC1+anti-CD8], 9 [cDC1+anti-CD4] biological replicates/group from 2 independent experiments). Data are presented as mean ± SEM. Statistical analysis by two-way ANOVA (c, e, h, k) and Mantel-Cox test (d, f, i, l). Source data are provided as Source Data file.
Fig. 6
Fig. 6. Neoadjuvant cDC1-based vaccination enhances CD8+ and CD4+ memory T cell responses upon tumor recurrence.
a Experimental overview for (ah): Mice grafted with MC38 cells (i.d.) were injected at day 3 and 8 with control PBS, anti-PD1 antibody or 106 MC38-TCL loaded cDC1s (i.d), and tumors resected at day 10. 30 days later, mice were re-challenged with MC38 cells. Tumor naive mice only received MC38 cells at day 40. Secondary tumors were analyzed on day 5 after grafting. b Frequency of CD8+ or CD4+ T cells in secondary MC38 tumors (n = 6 or 7 [cDC1] biological replicates/group of one representative of two independent experiments). c CD45+ and CD8+ or CD4+ T cells sorted from secondary MC38 tumors and analyzed by scRNAseq (2 replicates per condition). Multiparametric t-SNE representation and annotation is shown. d Violin plots of tissue resident memory (Trm) hallmark gene expression within most abundant T cell clusters from (c). e t-SNE plot with distribution of T cells for each experimental group. Grey dots show all detected cells, black to yellow-colored areas show T cell density/experimental group. f Frequency of the most abundant clusters within secondary MC38 tumors (n = 2 biological replicates pooling 3 mice/group). g Experimental overview for (h, i): XCR1DTRvenus mice received diphtheria toxin (DT) at days −2, −1, 0, 2, 5 i.p. and 106 B16-OVA-TCL loaded cDC1s or PBS at days 0 and 5 (i.d. in ear) before analysis of ear skin at day 30. Frequency of CD4+ CD69+ CXCR6+ and CD4+ CD69+ CD103- Trms (h, n = 4 [control], 5 [cDC1], 5 [cDC1+DT] biological replicates/group, representative experiment from 2 independent experiments) and representative flow cytometry plots (i, gated on CD45+ CD4+ cells) are shown. j Ranked pathway enrichment analysis comparing gene expression of CD4+ Trms with cells of CD4+ Tem and CD4+ IL7R clusters. k Violin plots showing expression of genes significantly (adj p value ≤0.001) enriched in CD4+ Trms of analysis in (j). Data are presented as mean ± SEM (dots represent individual data points) unless indicated otherwise. Statistical analysis by one-way ANOVA and Tukey post-hoc test (b, h) and Wilcox test (k). Source data are provided as Source Data file.
Fig. 7
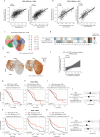
Fig. 7. Intratumoral presence of CD4+ Trms correlates with cDC1 abundance and patient survival in BRCA and SKCM.
a, b cDC1 scores based on the expression of CLNK, BATF3, XCR1 and CLEC9A (cDC1 gene signature established in ref. ) and CD4+ Trm scores based on the expression of the genes included in the cDC1-induced CD4+ Trm signature and the human BRCA CD4+ Trm signature (Table S1) were calculated for breast carcinoma (BRCA) (a) or human skin melanoma (SKCM) (b) from the TCGA. The Pearson’s correlations of cDC1 and CD4+ Trm scores normalized by percentile rank and the linear regression with a 95% confidence region are shown. c Uniform Manifold Approximation and Projection (UMAP) representing CD4+ T cells from 22 human BRCA patients (GSE176078,). The newly identified sub-clusters after re-clustering are shown. d Heatmap showing the scaled signature score of the cDC1-induced CD4+ Trm signature and the human BRCA CD4+ Trm signature (Table S1) of cells contained in each of the 17 CD4+ T cell sub-clusters in human BRCA identified in (c). e UMAPs depicting the single cell expression of CXCR6 (left panel) and CCR7 (right panel) by cells contained within the CD4+ T cell clusters in human BRCA. Grey dots show the outline for the CD4+ T cell clusters and brown-colored dots indicate the level of expression for the respective gene by a cell. A black circle indicates the location of the CD4+ Trm sub-cluster C16. f The frequency of cells contained in the CD4+ Trm sub-cluster C16 (ce) and the cDC1:CLEC9A cluster (identified in ref. ) within all tumor cells was calculated for each BRCA patient (n = 22). The Pearson’s correlation of intratumoral CD4+ Trm and cDC1 frequencies and the linear regression with a 95% confidence region are shown. gn Survival curves of BRCA (g, i, k) and SKCM (h, j, l) patients from the TGCA with high or low (top and bottom tertiles, respectively) intratumoral cDC1 (g, h) or CD4+ Trm (jl) scores calculated using gene signatures as in (a, b). Hazard ratio and 95% coefficient interval are indicated (j, n). Statistical analysis by Mantel-Cox test.

References

    1. Robert, C. A decade of immune-checkpoint inhibitors in cancer therapy. Nat. Commun.11, 3801 (2020). - PMC - PubMed
    1. Sharma, P., Hu-Lieskovan, S., Wargo, J. A. & Ribas, A. Primary, adaptive, and acquired resistance to cancer immunotherapy. Cell168, 707–723 (2017). - PMC - PubMed
    1. Dillekås, H., Rogers, M. S. & Straume, O. Are 90% of deaths from cancer caused by metastases? Cancer Med.8, 5574–5576 (2019). - PMC - PubMed
    1. Correia, A. L. Locally sourced: site-specific immune barriers to metastasis. Nat. Rev. Immunol.10.1038/s41577-023-00836-2 (2023). - PMC - PubMed
    1. Jameson, S. C. & Masopust, D. Understanding subset diversity in T cell memory. Immunity48, 214–226 (2018). - PMC - PubMed

MeSH terms

Substances