. 2025 Apr 9;16(1):3361.
doi: 10.1038/s41467-025-58763-w.

An unsupervised map of excitatory neuron dendritic morphology in the mouse visual cortex

Affiliations

An unsupervised map of excitatory neuron dendritic morphology in the mouse visual cortex

Marissa A Weis et al. Nat Commun. .

Abstract

Neurons in the neocortex exhibit astonishing morphological diversity, which is critical for properly wiring neural circuits and giving neurons their functional properties. However, the organizational principles underlying this morphological diversity remain an open question. Here, we took a data-driven approach using graph-based machine learning methods to obtain a low-dimensional morphological "bar code" describing more than 30,000 excitatory neurons in mouse visual areas V1, AL, and RL that were reconstructed from the millimeter scale MICrONS serial-section electron microscopy volume. Contrary to previous classifications into discrete morphological types (m-types), our data-driven approach suggests that the morphological landscape of cortical excitatory neurons is better described as a continuum, with a few notable exceptions in layers 5 and 6. Dendritic morphologies in layers 2-3 exhibited a trend towards a decreasing width of the dendritic arbor and a smaller tuft with increasing cortical depth. Inter-area differences were most evident in layer 4, where V1 contained more atufted neurons than higher visual areas. Moreover, we discovered neurons in V1 on the border to layer 5, which avoided deeper layers with their dendrites. In summary, we suggest that excitatory neurons' morphological diversity is better understood by considering axes of variation than using distinct m-types.


Conflict of interest statement

Competing interests: A.S.T is a cofounder of Vathes Inc. and UploadAI LLC, companies in which he has financial interests. J.R. is co-founder of Vathes Inc. and UploadAI LLC, companies in which he has financial interests. A.S.E. is a cofounder of Maddox AI GmbH, in which he has financial interests. TM and HSS disclose financial interests in Zetta AI LLC. The remaining authors declare no competing interests.

Figures
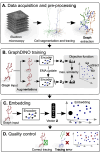
Fig. 1
Fig. 1. Pipeline to generate vector embeddings for large-scale datasets that capture the morphological features of the neurons’ dendritic trees.
A Imaging of brain volume via electron microscopy and subsequent segmentation and tracing to render 3D meshes of individual neurons that are used for skeletonization. B Self-supervised learning of low-dimensional vector embeddings z1z2 that capture the essence of the 3D morphology of individual neurons using GraphDINO. Two augmented “views” of the neuron are input into the network, where the weights of one encoder (bottom) are an exponential moving average (EMA) of the other encoder (top). The objective is to maximize the similarity between the vector embeddings of both views. Vector embeddings of similar neurons are close to each other in latent space. C An individual neuron is represented by its vector embedding as a point in the 32-dimensional vector space. D Quality control to remove neurons with tracing errors. Figure 1 was adapted from Weis, Hansel, Lüddecke, and Ecker, Self-Supervised Graph Representation Learning for Neuronal Morphologies, Transactions on Machine Learning Research, 899 (2023), https://openreview.net/pdf?id=ThhMzfrd6r under a CC BY license: https://creativecommons.org/licenses/by/4.0/.
Fig. 2
Fig. 2. Visualization of soma depths and cortical layer assignments of excitatory neuronal morphologies showing mostly a continuum with distinct clusters only in deeper layers.
A Top view of the EM volume with approximate visual areas indicated. All neurons with their soma origin within the red boundary were used for analysis. B Distribution of complete neurons (N) and fragments (F) along cortical depth as determined by our classifier based on the morphological embeddings. C Distribution of excitatory neurons (E) and interneurons (I) along cortical depth. D Classifier prediction for cortical layer origin based on the learned morphological embeddings. E t-SNE embedding (perplexity = 300) of the vector embeddings of excitatory neuronal morphologies colored by the respective soma depth (in μm) of the neurons relative to the pia (n = 32,571). F t-SNE embedding colored by cortical layer assignments as predicted by a cross-validated classifier trained on the morphological embeddings as features and a subset of manually labeled excitatory neurons (n = 922). G Cross-section of the brain volume depicting soma positions of neurons colored by their assigned cortical layer. Cortical layer thicknesses for primary visual cortex (V1) (left) and higher visual areas (HVA) (right) given as mean  ± standard deviation. H t-SNE embedding of excitatory neuronal morphologies colored by expert-defined cell types. I Example morphologies of the expert-defined cell types. Source data are provided as a Source Data file.
Fig. 3
Fig. 3. Cluster versus continuum analysis.
A Histograms of samples from a 1d Gaussian mixture (n = 30,000, number of components = 2) in green and the underlying mixture components with means μ1 = − 1 and μ2 = 1 in yellow. Data distributions evolve from discrete to continuous by increasing the standard deviation (SD) from left to right. B t-SNE representation of synthetic data (n = 32,571, perplexity = 300). Synthetic data is sampled from Gaussian mixtures with 20 components. Cluster means and weights are estimated from neuronal data. Isotropic variance is set to obtain data evolving from discrete clusters to uniform distributions. Grey insets (1–6) show histograms of two sample clusters (12 and 1) and their nearest neighbors (0 and 17, respectively) projected onto the direction connecting their cluster means (left), as well as the cumulative distribution of the samples assigned to these two clusters' along this direction (right). The “dip” value represents the dip statistic, a measure of bimodality of a distribution (higher = more bimodal). C Mean adjusted rand index (ARI) of 100 GMMs with an increasing number of components fit to the synthetic datasets. The correct number of underlying components can be identified as long as the variance in the data is not too high (< 0.5 for 20 components). D t-SNE representation (n = 32,571, perplexity = 300) of neuronal data colored by cluster membership (GMM with 20 components). Grey insets (7 & 8) show 1d projections of clusters 12 and 1 onto the line connecting their means with their nearest neighbors (0 and 17, respectively). Cumulative distributions show that while there is a gap between cluster 12 and its neighbors, there is none between cluster 1 and its neighbors. E Cluster analysis as in (C) for neuronal data. No specific number of components can be recovered. F t-SNE representation of neuronal data overlaid with nearest neighbor graph between clusters. The line width indicates the dip statistic (thicker = more connected). G. Maximum dip statistic between all clusters and their nearest neighbor for the synthetic data with 20 components and varying variance (yellow curve) and for the neuronal data clustered with 20 components (red dashed line). Source data are provided as a Source Data file.
Fig. 4
Fig. 4. Schematic of morphometric descriptors computed from neuronal skeletons and their labeled compartments.
Soma depth: Depth of the centroid of the soma relative to the pia. Height: Extent of the cell in y-axis. Total apical length: Total length of the skeletal branches of the apical dendrites. Apical width: Maximum extent of the apical dendritic tree in the xz-plane. Total basal length: Total length of the skeletal branches of the basal dendrites. Basal bias: Depth in y-axis of center of mass of basal dendrites relative to the soma.
Fig. 5
Fig. 5. t-SNE visualization of vector embeddings per cortical layer reveal axes of variation in neuronal morphologies.
A t-SNE embeddings per layer colored by percentiles of various morphometric descriptors with example neuronal morphologies along the axis of variation displayed above the embedding. B R2 scores of the six morphometric descriptors (see Fig. 4) per layer showing the strength as predictors of the 32d embeddings. C Spearman’s rank correlation coefficient between morphometric descriptors per layer. Layer 2/3 (blue) Continuum of dendritic morphologies with thinner and less tufted neurons in increasing distance to the pia. Layer 4 (turquoise) Continuation of L2/3 trends with shorter apical dendrites and more atufted cells. Many cells avoid reaching dendrites into L5 (basal bias). Layer 5 (green) Clustering of thick-tufted ET and NP cells. Upper L5 cells resemble L4 cells that avoid reaching into L5, indicating too strict laminar borders. Layer 6 (orange) Continuum with a large morphological diversity, e.g. in cell heights, and existence of horizontal and inverted pyramidal neurons. Source data are provided as a Source Data file.
Fig. 6
Fig. 6. Inter-areal differences between primary visual cortex (V1) and higher visual areas (HVAs).
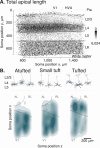
A Side view of the cortical volume. Each point represents the soma location of one neuron and is colored by the apical skeletal length of the respective neuron (dark = no apical, bright = maximal apical skeleton length). Projection from the side orthogonal to the V1/HVA border after a 14-degree rotation around the y-axis (vertical dashed line); top: pia; bottom: white matter. B Top view of the volume showing the density of atufted (left), small tufted (middle), and tufted (right) L4 cells. Atufted neurons are mostly confined to V1, while tufted neurons are more abundant in HVA. Dashed lines: area borders between primary visual cortex (V1), anterolateral area (AL), and rostrolateral area (RL), estimated from reversal of the retinotopic map measured using functional imaging. Source data are provided as a Source Data file.
Fig. 7
Fig. 7. Basal bias neurons in primary visual cortex (V1).
A Side view of the cortical volume. Each point represents the soma location of one neuron and is colored by its respective basal bias (dark = negative basal bias: center of mass of basal dendrites is above the soma; bright = positive basal bias: center of mass of basal dendrites is below soma). B Example neuronal morphologies of basal bias neurons (top) and top view of the volume (as in Fig. 6B) showing horizontal density distribution of L4 cells whose dendrites avoid reaching into L5 and who are mostly located in V1 (bottom). C Functional digital twins can predict the functional response of the neurons to input stimuli such as natural movies. The input-output function of each neuron is described by a functional bar code fi. Schematic adapted from “Functional connectomics reveals general wiring rule in mouse visual cortex'', Ding et al. bioRxiv 2023.03.13.531369; 10.1101/2023.03.13.531369 under a CC BY license: https://creativecommons.org/licenses/by/4.0/. D Predictions of basal bias metric from functional bar code fi using linear regression. Source data are provided as a Source Data file.

References

    1. Ramón y Cajal, S. Histologie du système nerveux de l’homme et des vertébrés. (Ed. Maloine, A.) https://gallica.bnf.fr/ark:/12148/bpt6k6213192g (Paris, 1911).
    1. DeFelipe, J. et al. New insights into the classification and nomenclature of cortical GABAergic interneurons. Nat. Rev. Neurosci.14, 202–216 (2013). - PMC - PubMed
    1. Ding, Z. et al. Functional connectomics reveals general wiring rule in mouse visual cortex. Nature. (in press). - PMC - PubMed
    1. Jiang, X. et al. Principles of connectivity among morphologically defined cell types in adult neocortex. Science350, aac9462 (2015). - PMC - PubMed
    1. O’Leary, J. L. Structure of the area striata of the cat. J. Comp. Neurol.75, 131–164 (1941).

LinkOut - more resources