

Moroccan genome project: genomic insight into a North African population
- PMID: 40204857
- PMCID: PMC11982406
- DOI: 10.1038/s42003-025-08020-z
Moroccan genome project: genomic insight into a North African population
Abstract
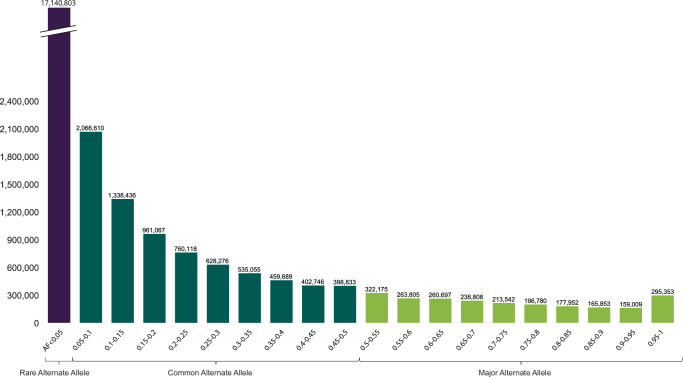
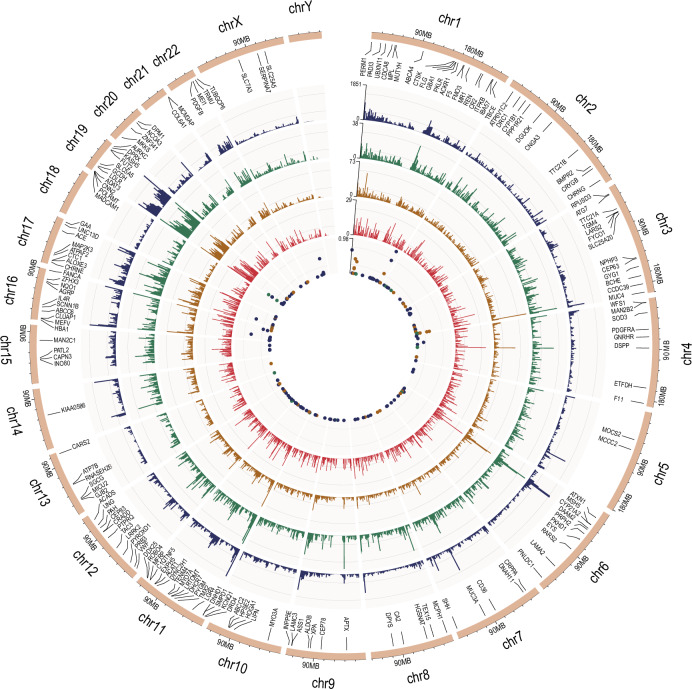
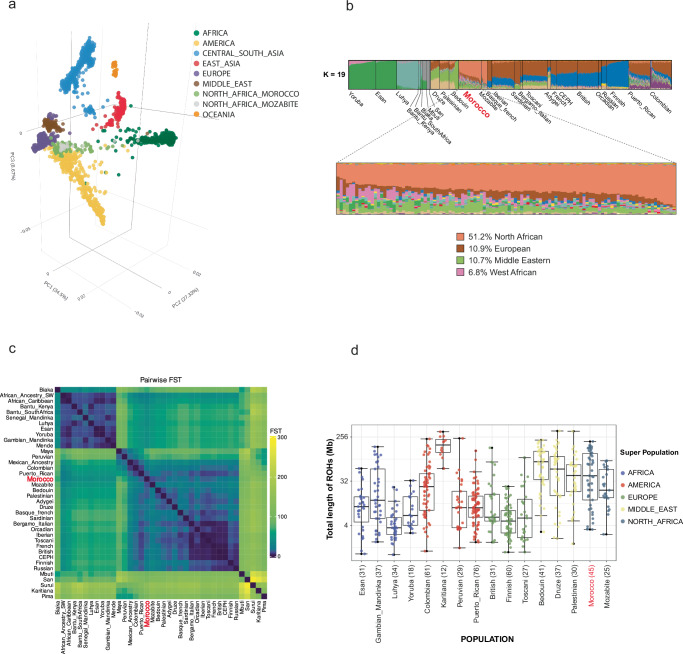
Africa's 1.5 billion people are underrepresented in genomic databases. The African Genome Variation Project exclusively focuses on Sub-Saharan populations, making Morocco, located in North Africa, a valuable site for studying genetic diversity. Understanding genetic variation and customized therapy requires population-specific reference genomes. This study presents Phase 1 results from the Moroccan Genome Project (MGP), which sequenced 109 Moroccan genomes. We report over 27 million variants, including 1.4 million novel ones, of which 15,378 are highly prevalent in the Moroccan population. Furthermore, we propose a Moroccan Major Allele Reference Genome (MMARG), generated using high-coverage consensus sequences from the 109 whole genomes. This MMARG represents more accurately the Moroccan genetic variation than GRCh38. This baseline study also generates an informative genetic variation database that supports regional population-specific initiatives and precision medicine in Morocco and North Africa. The results stress the necessity of population-relevant data in Human genetic research.
© 2025. The Author(s).
Conflict of interest statement
Competing interests: The authors declare no competing interests. Inclusion and ethics statement: All collaborators of this study who met the authorship criteria set by Nature Portfolio journals have been included as authors, as their contributions were vital to the design and implementation of the research.
Figures


Similar articles
-
Identification of single nucleotide variants in the Moroccan population by whole-genome sequencing.BMC Genet. 2020 Sep 21;21(1):111. doi: 10.1186/s12863-020-00917-4. BMC Genet. 2020. PMID: 32957965 Free PMC article.
-
Genomic ancestry of North Africans supports back-to-Africa migrations.PLoS Genet. 2012 Jan;8(1):e1002397. doi: 10.1371/journal.pgen.1002397. Epub 2012 Jan 12. PLoS Genet. 2012. PMID: 22253600 Free PMC article.
-
The genetic structure of Arabidopsis thaliana in the south-western Mediterranean range reveals a shared history between North Africa and southern Europe.BMC Plant Biol. 2014 Jan 10;14:17. doi: 10.1186/1471-2229-14-17. BMC Plant Biol. 2014. PMID: 24411008 Free PMC article.
-
African genetic diversity provides novel insights into evolutionary history and local adaptations.Hum Mol Genet. 2018 Aug 1;27(R2):R209-R218. doi: 10.1093/hmg/ddy161. Hum Mol Genet. 2018. PMID: 29741686 Free PMC article. Review.
-
Human leukocyte antigen-A, -B, and -Cw polymorphism in a Berber population from North Morocco using sequence-based typing.Tissue Antigens. 2004 Feb;63(2):158-72. doi: 10.1111/j.1399-0039.2004.00161.x. Tissue Antigens. 2004. PMID: 14705987 Review.
References
-
- Ellegren, H. & Galtier, N. Determinants of genetic diversity. Nat. Rev. Genet.17, 422–433 (2016). - PubMed
-
- Gaibar, M. et al. Usefulness of autosomal STR polymorphisms beyond forensic purposes: data on Arabic- and Berber-speaking populations from central Morocco. Ann. Hum. Biol.39, 297–304 (2012). - PubMed
MeSH terms
Grants and funding
LinkOut - more resources
Full Text Sources
Miscellaneous
