. 2025 Apr;17(4):625-644.
doi: 10.1038/s44321-025-00212-8. Epub 2025 Apr 1.

Proteomics and personalized PDX models identify treatment for a progressive malignancy within an actionable timeframe

Affiliations

Proteomics and personalized PDX models identify treatment for a progressive malignancy within an actionable timeframe

Georgina D Barnabas et al. EMBO Mol Med. 2025 Apr.

Abstract

Genomics has transformed the diagnostic landscape of pediatric malignancies by identifying and integrating actionable features that refine diagnosis, classification, and treatment. Yet, translating precision oncology data into effective therapies for hard-to-cure childhood, adolescent, and young adult malignancies remains a significant challenge. We present the case for combining proteomics with patient-derived xenograft models to identify personalized treatment for an adolescent with primary and metastatic spindle epithelial tumor with thymus-like elements (SETTLE). Within two weeks of biopsy, proteomics identified elevated SHMT2 as a target for therapy with the anti-depressant sertraline. Drug response was confirmed within two months using a personalized chicken chorioallantoic membrane model of the patient's SETTLE tumor. Following failure of cytotoxic chemotherapy and second-line therapy, the patient received sertraline treatment and showed decreased tumor growth rates, albeit with clinically progressive disease. We demonstrate that proteomics and fast-track xenograft models provide supportive pre-clinical data in a clinically meaningful timeframe to impact clinical practice. By this, we show that proteome-guided and functional precision oncology are feasible and valuable complements to the current genome-driven precision oncology practices.

Keywords: Genomics; Patient Derived Xenografts; Pediatric Cancer; Precision Therapeutics; Proteomics.


Conflict of interest statement

Disclosure and competing interests statement. The authors declare no competing interests.

Figures

Figure 1
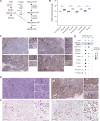
Figure 1. Multi-omics molecular profiling of a progressive SETTLE case.
(A) Patient journey from the resection of the tumor (PR) through three distant recurrences (R1, R2, R3). The molecular analyses, radiographs (Months at time X, MX to M + 7), PDX models, and drug sensitivity assays conducted are linked to the corresponding time points. Proteome analysis of PR, R1 and R2 was performed retrospectively at time of R3. (B) Timeline of precision diagnostics for the SETTLE disease course, including multi-omics molecular tumor profiling, real-time target identification, and validation using personalized xenograft models in providing timely pre-clinical support for medical decision-making. (C) H&E stained sections of the primary resection (PR) and recurrent biopsies (R1-R3). PR demonstrates a biphasic mesenchymal pattern with heterologous elements including gastric foveolar-lined glands showing three patterns, a small blue cell population with a fascicular growth pattern (I). A more collagenous and sclerotic pattern (II). The heterologous epithelial elements show foveolar-like epithelium (III). R1 shows a similar pattern to the resection specimen, including a hypocellular area with increased collagen which transitions into a hypercellular spindle cell area. The cellular nests and fascicles with more collagenous areas (I). Areas of cuboidal-lined (Cu) epithelium are seen. R2 and R3 show hypocellular collagenous tumor transitioning to hypercellular spindled areas with cuboidal-lined (Cu) epithelium. Scale bars: 200 µm in main image; 60 µm in insets. (D) Volcano plot showing the global analysis of proteome perturbation between R3 and adjacent normal regions from three technical replicates for each group. Proteins significant with student’s t-test at 0.01 FDR and with log2 fold change >1 are highlighted in red for increased abundance in tumor and in blue for reduced abundance in tumor. (E) Quantified proteins ranked by their average intensity across all samples to evaluate the dynamic range and depth of the proteome coverage. Venn diagram showing the overlap of all proteins quantified in this study with known pediatric cancer-associated proteins. Source data are available online for this figure.
Figure 2
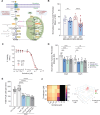
Figure 2. Increased one-carbon metabolism and serine addiction in SETTLE tumor.
(A) Schematic representation of serine biosynthesis and 1C metabolism pathways. Red arrows highlight the increased abundance of proteins involved in serine biosynthesis and those involved in serine and folate metabolism in the SETTLE tumor. (B) Increased abundance of SHMT2 in the primary tumor and lung metastases, data shown represent three technical replicates for each group. Bonferroni’s multiple comparisons test, normal thyroid vs PR tumor **p(adjusted) = 0.0069, normal lung R1 vs R1 lung **p(adjusted) = 0.0034, normal lung R2 vs R2 lung *p(adjusted) = 0.0181 and normal lung R3 vs R3 lung *p(adjusted) = 0.0103. (C) Validation of increased SHMT2 protein levels in SETTLE tumor using IHC staining. Adjacent normal thyroid and lung tissues show minimal basal level staining (score +1), tumor cells show more prominent staining (score +2), and granulocytes show the highest staining (score +3). Scale bars: 200 µm in main image; 60 µm in insets. (D) Levels of SHMT2 in diverse tumor types using tumor microarrays; liver (n = 3), melanoma (n = 3), and leiomyosarcoma (n = 3) showed high SHMT2 levels; bladder (n = 7), colon (n = 5), breast (n = 14), ovarian (n = 12) and lung (n = 16) tumors showed moderate SHMT2 levels and pancreas (n = 9) and prostate (n = 7) tumors had the lowest SHMT2 levels. (E) Mouse-PDX. H&E staining (left) shows a consistent pattern of cellular and spindle area as seen in the patient-derived specimen (black arrowheads). SHMT2 IHC (right) shows a heterogenous pattern, with a mix of 3+ and 2+ staining in tumor cells. (F) CAM-PDX. H&E staining (left) shows largely discohesive cells with mild to moderate pleomorphism and hyperchromasia, tumor cells are oval-to-spindled in appearance with irregular nuclear membranes and scant cytoplasm. SHMT2 IHC (right) shows the retention of the staining seen in the primary human R2 and mouse-PDX samples. Scale bars: 100 µm in main image; 60 µm in insets. Source data are available online for this figure.
Figure 3
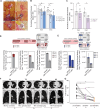
Figure 3. Pre-clinical targeting of 1C metabolic pathway in SETTLE and tumor growth rate before and after sertraline therapy.
(A) Representative images CAM-PDX of SETTLE tumor over five days with sertraline treatment and without (Vehicle Control). Arrowheads indicate periphery of engrafted tumoroids. Scale bars: 3 mm. (B) Measurements of CAM-PDX tumoroid perimeters normalized to day 1 for untreated and treatment with 2 concentrations of sertraline (mean ± s.d., day 3 n = 8;16;8 tumors/group, day5 n = 6;12;6 tumors/group, two-way ANOVA with Bonferroni’s post hoc test, Veh Ctrl vs 1 mg/kg SRT **p = 0.0041, Veh Ctrl vs 2 mg/kg SRT **p = 0.0074). (C) CAM-PDX tumoroid perimeters, normalized to day 1 for untreated and treatment with SHIN1 (mean ± s.d., day 3 n = 4;8 tumors/group, day5 n = 4;8 tumors/group, two-way ANOVA with Sidak’s post hoc test, Veh Ctrl vs 1 mg/kg SHIN1 *p = 0.0329). (D) The abundance of p-serine, serine and glycine isotopologues from 13C-6-glucose labeled NSG-PDX cells treated with sertraline or the vehicle control (mean ± s.d., n = 3 assays per condition). (E) The abundance of serine and glycine isotopologues from 13C3-serine labeled NSG-PDX cells treated with sertraline or the vehicle control (mean ± s.d., n = 3 assays per condition). (F) Patient CT images at 4-time points before, during, and after sertraline therapy spanning 7 months. RECIST score indicated in numbers. (G) Graphs displaying monthly tumor growth rate (TGR) tracked for 9 lesions before (A), during (B) and post (C) sertraline treatment (Data represent %TGR/month, using mixed effects with Bonferroni’s post hoc test, Pre-sertraline vs sertraline *p = 0.0366, pre-sertraline vs post sertraline **p = 0.0023, sertraline vs post sertraline *p = 0.0146). Source data are available online for this figure.
Figure EV1
Figure EV1. Gene and protein expression in progressive SETTLE tumor.
(A) Correlation plot of gene expression from R1 and R3 with Pearson correlation coefficient r = 0.9, p = 1e−1022. (B) Proteome changes do not suggest sensitivity to 21 established therapies. Circular plot showing the targeted proteomic analysis focusing on 29 proteins associated with 21 routinely used therapies in R3 lung nodules. Log2 fold-change values, calculated from the tumor vs normal comparison, are displayed on the proteomics side of the plot. Only associations for quantified proteins are shown. gray arrow: non-significant changes and associations; red arrow: proteome change counter indicative of drug sensitivity. (C, D) Scatter plot comparing protein intensities with gene expression in relapse R1 (C), with Pearson correlation coefficient r = 0.43, p = 4.4e−261 and R3 (D), with Pearson correlation coefficient r = 0.42, p = 2.4e−254.
Figure EV2
Figure EV2. Abundance of serine biosynthesis proteins in SETTLE.
(A, B) Increased abundance of serine biosynthesis proteins PSPH (A) and PSAT1 (B) in the primary tumor and lung metastases. Data shown represent three technical replicates for each group (mean ± s.d.), Bonferroni’s multiple comparisons test, for PSPH: normal thyroid vs PR tumor *p(adjusted) = 0.0208, normal lung R1 vs R1 lung nsp(adjusted) = 0.1596, normal lung R2 vs R2 lung *p(adjusted) = 0.0201, normal lung R3 vs R3 lung **p(adjusted) = 0.0054; for PSAT: normal thyroid vs PR tumor **p(adjusted) = 0.0015, normal lung R1 vs R1 lung *p(adjusted) = 0.0142, normal lung R2 vs R2 lung **p(adjusted) = 0.0046, normal lung R3 vs R3 lung **p(adjusted) = 0.0048. Source data are available online for this figure.
Figure EV3
Figure EV3. Sertraline and trimethoprim combination as a potential therapeutic approach for SETTLE.
(A) Schematic representation of the 1C metabolism pathway showing the significance of therapeutic inhibition of this pathway at DHFR and SHMT2 levels. Serine is converted to glycine by cytoplasmic SHMT1 (left) and mitochondrial SHMT2 (right). The 1C component sliced from serine is transferred to THF, generating methylene-THF. Therapeutic interventions, highlighted in red-dash lines (DHFR inhibitor: Trimethoprim, SHMT2 inhibitor: Sertraline), at two distant ends of this pathway stop the 1C unit being used for THF. THF is produced from folate and serves as a universal 1C acceptor. DHF: dihydrofolate; THF: tetrahydrofolate; DHFR: dihydrofolate reductase; MFT: mitochondrial folate transporter; SHTMT1/2, serine hydroxymethyl transferase, cytosolic (1)/mitochondrial (2); MTHFD1: methylenetetrahydrofolate dehydrogenase 1; MTHFD2: methylenetetrahydrofolate dehydrogenase 2 (2-like). (B) Tumoroid perimeters at Day 4, normalized to Day 1, for CAM xenografts of MDA-MB-468 or MDA-MB-231 cells with and without treatment with sertraline (mean ± s.d., n = 7;13 tumors/group for MDA-MB-231, n = 6;16 tumors/group for MDA-MB-468, One-way ANOVA with Tukey’s post hoc test ***p = 0.0002). (C) In vitro viability assays of NSG-PDX SETTLE cells subjected to treatment with sertraline. As plotted is the mean±s.d. for triplicate wells for each concentration of sertraline, for 2 independently conducted assays. (D) CAM engrafted with NSG-PDX SETTLE cells were untreated or treated with sertraline and/or trimethoprim at the indicated concentrations. The scatter bar graph depicts the tumoroid perimeters at days 3 and 5 normalized against day 1 (mean ± s.d., n = 7–12 tumors/group, two-way ANOVA with Dunnett’s post hoc test, Veh Ctrl vs 2 mg/kg SRT **p = 0.0041, Veh Ctrl vs 20 mg/kg Trim ***p = 0.0074, Veh Ctrl vs SRT+Trim ***p = 0.0074). (E) NSG-PDX SETTLE cells engrafted in larval zebrafish were untreated or treated with sertraline (Sert) and/or trimethoprim (Trim). Scatter bar graphs depict the number of SETTLE cells per larva at 1 or 4 days post-implantation (dpi) (mean ± s.d., n(Ctrl) = 20; n(SRT) = 20; n(Trim) = 12; n(Trim+SRT) = 19 larval zebrafish/group, One-way ANOVA with Dunnet’s post hoc test; ctrl vs 4 μM SRT ****p = 0.0001, ctrl vs 100 μM Trim ****p = 0.0001, ctrl vs 100 μM Trim+2μM SRT ****p = 0.0001). (F) In vitro viability assays of NSG-PDX SETTLE cells subjected to treatment with sertraline and/or trimethoprim shown as heat map viability plots (left) and the Highest Single Agent combinatorial drug synergy plots (d-score >10 indicative of synergistic effects) (right). Source data are available online for this figure.

Similar articles

References

    1. Abel L, Durmaz A, Hu R, Longhurst C, Baschnagel AM, Wheeler D, Scott JG, Kimple RJ (2021) Impact of immediate cryopreservation on the establishment of patient derived xenografts from head and neck cancer patients. J Transl Med 19:180 - PMC - PubMed
    1. Akhoundova D, Rubin MA (2022) Clinical application of advanced multi-omics tumor profiling: Shaping precision oncology of the future. Cancer Cell 40:920–938 - PubMed
    1. Barnabas GD, Goebeler V, Tsui J, Bush JW, Lange PF (2023) ASAP horizontal line automated sonication-free acid-assisted proteomes horizontal line from cells and FFPE tissues. Anal Chem 95:3291–3299 - PMC - PubMed
    1. Beekhof R, van Alphen C, Henneman AA, Knol JC, Pham TV, Rolfs F, Labots M, Henneberry E, Le Large TY, de Haas RR et al (2019) INKA, an integrative data analysis pipeline for phosphoproteomic inference of active kinases. Mol Syst Biol 15:e8250 - PMC - PubMed
    1. Berlanga P, Pierron G, Lacroix L, Chicard M, Adam de Beaumais T, Marchais A, Harttrampf AC, Iddir Y, Larive A, Soriano Fernandez A et al (2022) The European MAPPYACTS trial: precision medicine program in pediatric and adolescent patients with recurrent malignancies. Cancer Discov 12:1266–1281 - PMC - PubMed

LinkOut - more resources