. 2025 Jul;9(7):1101-1116.
doi: 10.1038/s41551-024-01342-z. Epub 2025 Apr 9.

Site-directed multivalent conjugation of antibodies to ubiquitinated payloads

Affiliations

Site-directed multivalent conjugation of antibodies to ubiquitinated payloads

Angela F El Hebieshy et al. Nat Biomed Eng. 2025 Jul.

Abstract

Antibody conjugates are the foundation of a wide range of diagnostic and therapeutic applications. Although many antibody-conjugation techniques are robust and efficient, obtaining homogeneous multimeric conjugation products remains challenging. Here we report a modular and versatile technique for the site-directed multivalent conjugation of antibodies via the small-protein ubiquitin. Specifically, multiple ubiquitin fusions with antibodies, antibody fragments, nanobodies, peptides or small molecules such as fluorescent dyes can be conjugated to antibodies and nanobodies within 30 min. The technique, which we named 'ubi-tagging', allowed us to efficiently generate a bispecific T-cell engager as well as nanobodies conjugated to dendritic-cell-targeted antigens that led to potent T-cell responses. Using both recombinant ubi-tagged proteins and synthetic ubiquitin derivatives allows for the iterative, site-directed and multivalent conjugation of antibodies and nanobodies to a plethora of molecular moieties.


Conflict of interest statement

Competing interests: The authors declare no competing interests.

Figures

Fig. 1
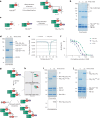
Fig. 1. Generation and site-specific labelling of ubi-tagged antibody fragments.
a, Schematic representation of ubi-tagging using the ubiquitination cascade. The ubi-tag C terminus (Ubdon) is activated by the E1 enzyme to form a thioester bond. The activated ubi-tag is then transferred to an E2 enzyme which, with the help of an E3 enzyme, transfers it to a specific lysine residue of another ubiquitin or ubi-tag (Ubacc), forming a ubi-tag dimer linked via an isopeptide bond. b, Schematic representation of ubi-tag conjugation of Fab-Ub(K48R)don to rhodamine-Ubacc-ΔGG. c, Non-reducing SDS–PAGE analysis of labelling of Fab-Ubdon with Rho-Ubacc using K48-specific ubiquitination enzymes. The deconvoluted ESI–TOF mass spectrum of the Fab’ fragments isolated from the reaction mixture confirmed the formation of Rho-Ub2-Fab. d, Thermal unfolding profiles of Fab-Ubdon (green) and the conjugated Rho-Ub2-Fab (purple) showing comparable thermostability. e, Flow cytometry analysis showing comparable labelling of isolated mouse splenocytes for CD3 with commercial mAb (left) or Rho-Ub2-Fab (right), indicating unaltered binding of the ubi-tagged conjugate. Left: left and right horizontal lines indicate FITC and FITC+ populations, respectively. Right: left and right horizontal lines indicate Rho and Rho+ populations, respectively. Source data
Fig. 2
Fig. 2. Generation of multimeric antibody formats and bi- and trivalent Fab fragment conjugates using ubi-tagging.
a, Schematic representation of multimerization of anti-mDEC205 Fab-UbWT using ubi-tagging, where both the C-terminal glycine residue as well as K48 are available for conjugation. b, Reducing SDS–PAGE analysis visualizing multimerization of Fab-UbWT in 30 min, forming multimers as high as the 11th order and beyond. c, Schematic representation of site-specific heterodimerization using ubi-tagging. d, Non-reducing SDS–PAGE analysis visualizing formation of bivalent Fab2-Ub2-His conjugates in 30 min. Here, both targeting moieties are mCD3. e, Thermal unfolding profiles of Fab2-Ub2 (purple) and Fab-Ub (green) show similar thermal stability. f, Competition binding assay on CD3-expressing EL4 cells of Fab-Ub (green), Fab2-Ub2 (purple) and parental mAb (blue) targeting mCD3 against fluorescently labelled parental mAb. Representative experiment of n = 3, with each condition performed in triplicate. Data are shown as mean ± s.d. g, Schematic representation of controlled formation of trivalent Fab’ fragment conjugates utilizing sequential use of ubi-tagging and UCHL3 to liberate the C-terminal glycine by selectively removing the His-tag. h, Deconvoluted ESI–TOF mass spectra of the heavy chain dimer of Fab2-Ub2 and Fab2-Ub2Don showing the liberation of the His10-tag from Fab2-Ub2 by UCHL3 (calculated mass difference = 1,371 Da, observed mass difference = 1,371 Da). i, Reducing (fluorescent) SDS–PAGE analysis of the formation of Rho-Fab2-Ub3 through ubi-tagging of Fab2-Ub2don and Rho-Ubacc. j, Reducing SDS–PAGE analysis of the formation of Fab3-Ub3 through ubi-tagging of Fab2-Ub2don and Fab-Ubacc. HC, heavy chain; LC, light chain. Source data
Fig. 3
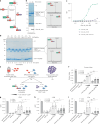
Fig. 3. Conjugation of ubi-tagged mAbs and the generation of a bispecific tetravalent antibody complex for T-cell activation.
a, Schematic representation of ubi-tagged mAbs and bispecific tetravalent complexes. b, Reducing (fluorescent) SDS–PAGE analysis of the formation of mAb-(Ub2-Rho)2 through ubi-tagging of anti-TRP1 mAb-(Ubacc)2 and Rho-Ubdon. c, Reducing SDS–PAGE analysis of the formation of mAb-(Ub2-Fab)2 through ubi-tagging of anti-TRP1 mAb-(Ubacc)2 and anti-mCD3 Fab-Ubdon. dh, In vitro T-cell activation by the ubi-tagged bispecific TRP1×mCD3 complexes. Primary mouse (C57BL/6) CD8+ T cells were added at a 10:1 ratio to KPC3-Trp1, followed by addition of 0–1 µg ml−1 of either mAb-(Ub2-Fab)2 or unconjugated mAb-(Ub-ΔGG)2 and two Fab-Ub(K48R)don, and incubation for 2 days. T-cell activation was assessed using flow cytometry for Ki67 (d), Granzyme B (e), CD69 (f) and 4-1BB (g). Data (n = 3) are shown as percentage positive T cells ± s.d. Cytotoxicity was assessed using an LDH cytotoxicity assay (h). Data (n = 3) are shown as percentage cytotoxicity ± s.d. t-tests; ****P < 0.0001, **P < 0.01. Full statistical analysis results are provided in Supplementary Table 7. Source data
Fig. 4
Fig. 4. Fab-Ub2-OVAp conjugates elicit potent T-cell responses in vitro.
a, Schematic representation of anti-mDEC205 vaccine conjugates used in this experiment: Fab-Ub2-FR-OVAp, Fab-Ub2-OVAp, Fab-Srt-FR-OVAp and Fab-Srt-OVAp. b, Schematic overview of the in vitro OT-I cell activation assay. GM-CSF BMDCs were generated and pulsed for 2 h with 0.01, 0.10 or 1.0 μM vaccine conjugates or 1.0 μM control conditions and 0.3 µg ml−1 LPS. Sequentially, OT-I cells were added at a 1:5 ratio and incubated for 3 days. Cells were analysed using flow cytometry and supernatant was collected for ELISA analysis. c,d, Flow cytometry analysis of OT-I cells. Data (n = 4) are shown as mean fluorescence intensity (MFI) ± s.d. normalized to the positive control for CD25 (c) and 4-1BB (d). e, ELISA analysis (n = 4) for IFNγ. Data are shown as mean ± s.d. normalized to the positive control. Paired t-tests; **P < 0.01, *P < 0.05. Full statistical analysis results are provided in Supplementary Table 8. Source data
Fig. 5
Fig. 5. Fab-Ub2-OVAp conjugates elicit potent T-cell responses in vivo.
a, Schematic overview of in vivo OT-I cell activation assay. Mice (C57BL/6) received 1 × 106 CTV-labelled OT-I cells on day 0, followed by 5 pmol vaccine conjugate + 10 µg LPS on day 1. Spleens were collected on day 3. i.v., intravenous b, Division index obtained by flow cytometry analysis (n = 4) of OT-I cells isolated from spleen. Data are shown as mean ± s.d. Unpaired t-tests, P values are noted in the figure. c, Representative histograms of OT-I cell proliferation in spleen. d, Mice (C57BL/6) were injected with 5 pmol 111In-labelled Fab-Ub2-K(DOTA-GA)-FR-OVAp or Fab-Srt-K(DOTA-GA)-FR-OVAp + 10 µg LPS. Biodistribution was determined ex vivo 24 h after injection (n = 4). Values are presented as percentage injected dose per gram (%ID g−1). Data are shown as mean ± s.d. Unpaired t-tests, P values are noted in the figure. e, The spleens from d were dissociated and the CD11c+ and CD11b+ populations were subsequently isolated from the splenocytes using MACS buffer, after which the radioactivity in all fractions was measured. Values are presented as percentage injected dose per cell (%ID per cell). Data are shown as mean ± s.d. Unpaired t-tests, P values are noted in the figure; ****P < 0.0001, ***P < 0.001 **P < 0.01, *P < 0.05, NSP > 0.05. Source data
Fig. 6
Fig. 6. DC-targeted antigen delivery using ubi-tagged nanobodies.
a, Schematic representation of ubi-tagging for nanobodies. b, Non-reducing (fluorescent) SDS–PAGE analysis and deconvoluted ESI–TOF mass spectra of the formation of Rho-Ub2-VHH through ubi-tagging of VHH-Ubdon and Rho-Ubacc. c, Binding assay on DC-SIGN-transfected CHO cells with DC-SIGN-targeted Rho-Ub2-VHH (green), ALFA-tag-targeted Rho-Ub2-ntVHH (purple) and DC-SIGN-targeted Rho-Ub2-VHH on WT CHO cells (black). Data are shown as MFI of rhodamine channel and a curve fit (sigmoidal, 4PL, X = log concentration) on data points (n = 2). d, SDS–PAGE analysis of VHH-Ub2-antigenic peptide conjugates and deconvoluted ESI–TOF mass spectra of VHH-Ub2-gp100p. VHH-Ubdon was conjugated to Ubacc-EAWGALANWAVDSA (2W1S), Ubacc-ELAGIGILTV (Melan), Ubacc-GILGFVFTL (FluM1), Ubacc-KVLEYVIKV (MAGE), Ubacc-FLIIWQNTM (Casp5), Ubacc-SLLMWITQV (NYESO1) and Ubacc-YLEPGPVTA (gp100) e, Schematic representation of primary TCR-transfected CD8+ T-cell activation assay. HLA-A*02:01+ moDCs were generated and pulsed with 0.1, 0.5, 1 µM vaccine conjugate or 1 µM control condition for 1 h at 37 °C. TCR-transfected CD8+ T cells were added at a 1:5 ratio and after 3 days, supernatant and cells were collected for analysis. Transfection efficiency is shown in Supplementary Fig. 15. fh, Flow cytometry analysis of CD8+ T cells. Division index was calculated for different conditions on the basis of CTV signal (f). Data (n = 4) are shown as mean ± s.d. normalized to the positive control (gp100 peptide) for CD25 (g) and 4-1BB (h). Paired t-tests; ***P < 0.001, **P < 0.01, *P < 0.05, NSP > 0.05. i, ELISA analysis (n = 4) for IFNγ. Data are shown as mean ± s.d. normalized to the positive control. Paired t-tests, P values are noted in the figure. Source data
Extended Data Fig. 1
Extended Data Fig. 1. Ubi-tag conjugation of Fab-Ubdon to Ubacc-OVAp and sortase-mediated conjugation of Fab-Srt to OVAp.
a. Schematic representation of ubi-tag conjugation of DEC205 Fab-Ubdon to chemically synthesized acceptor ubiquitin of which ovalbumin(257-264) peptide is attached to the C-terminus (Ubacc-OVAp). b. Non-reducing SDS-PAGE analysis of the conjugation of Fab-Ubdon to either Ubacc-FR-OVAp or Ubacc-OVAp. The generated conjugates were isolated from the reaction mixture and the purity assessed using ESI-TOF mass spectrometry. c. Non-reducing SDS-PAGE analysis of the conjugation of Fab-Srt to either GGG-FR-OVAp or GGG-OVAp. The generated conjugates were isolated from the reaction mixture and the purity assessed using SDS-PAGE analysis visualized by Sypro Ruby stain. Source data
Extended Data Fig. 2
Extended Data Fig. 2. In vitro OT-I cell activation assay showing data for the T cell activation markers CD44 and IL-2.
GM-CSF BMDCs were generated and pulsed for 2 h. with 1000-100-10 nM vaccine conjugates or 1000 nM control conditions and 0.3 µg/mL LPS. Sequentially, OT-I cells were added in 1:5 ratio and incubated for 3 days. Cells were analyzed using FACS analysis. Data (n = 4) are shown as mean ±SD normalized MFI to positive control for CD44 (a) and IL-2 (b). Full statistics are in supplemental information. Source data
Extended Data Fig. 3
Extended Data Fig. 3. In vivo OT-I cell activation assay data from inguinal lymph nodes.
Plots showing (a) flow cytometry analysis (N = 4) of division index of OT-I cells isolated from inguinal lymph nodes. Data are shown as mean ±SD. Paired T tests, ****P<0.0001, ***P<0.001, *P<0.05 (b) Representative histograms of OT-I cell proliferation in inguinal lymph nodes. Source data

References

    1. Sun, M. M. C. et al. Reduction−alkylation strategies for the modification of specific monoclonal antibody disulfides. Bioconjug. Chem.16, 1282–1290 (2005). - PMC - PubMed
    1. Yamada, K. & Ito, Y. Recent chemical approaches for site-specific conjugation of native antibodies: technologies toward next-generation antibody–drug conjugates. Chembiochem20, 2729–2737 (2019). - PubMed
    1. Shen, B.-Q. et al. Conjugation site modulates the in vivo stability and therapeutic activity of antibody–drug conjugates. Nat. Biotechnol.30, 184–189 (2012). - PubMed
    1. Agarwal, P. & Bertozzi, C. R. Site-specific antibody–drug conjugates: the nexus of bioorthogonal chemistry, protein engineering, and drug development. Bioconjug. Chem.26, 176–192 (2015). - PMC - PubMed
    1. Strop, P. et al. Location matters: site of conjugation modulates stability and pharmacokinetics of antibody drug conjugates. Chem. Biol.20, 161–167 (2013). - PubMed

LinkOut - more resources