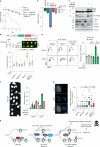
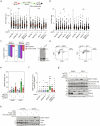
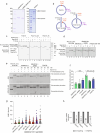
. 2025 Apr;640(8060):1093-1102.
doi: 10.1038/s41586-025-08815-4. Epub 2025 Apr 9.

Comprehensive interrogation of synthetic lethality in the DNA damage response

Affiliations

Comprehensive interrogation of synthetic lethality in the DNA damage response

John Fielden et al. Nature. 2025 Apr.

Abstract

The DNA damage response (DDR) is a multifaceted network of pathways that preserves genome stability1,2. Unravelling the complementary interplay between these pathways remains a challenge3,4. Here we used CRISPR interference (CRISPRi) screening to comprehensively map the genetic interactions required for survival during normal human cell homeostasis across all core DDR genes. We captured known interactions and discovered myriad new connections that are available online. We defined the molecular mechanism of two of the strongest interactions. First, we found that WDR48 works with USP1 to restrain PCNA degradation in FEN1/LIG1-deficient cells. Second, we found that SMARCAL1 and FANCM directly unwind TA-rich DNA cruciforms, preventing catastrophic chromosome breakage by the ERCC1-ERCC4 complex. Our data yield fundamental insights into genome maintenance, provide a springboard for mechanistic investigations into new connections between DDR factors and pinpoint synthetic vulnerabilities that could be exploited in cancer therapy.


Conflict of interest statement

Competing interests: J.E.C. is a cofounder and scientific advisory board (SAB) member of Serac Biosciences; an SAB member of Mission Therapeutics, Relation Therapeutics and Hornet Biologicals; and a consultant for Cimeio Therapeutics. S.P.J. is shareholder and part-time chief research officer of Insmed Innovation UK, board member and chair of scientific advisory board for Mission Therapeutics and a founding partner of Ahren Innovation Capital. All other authors have no competing interests.

Figures
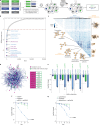
Fig. 1
Fig. 1. Comprehensive combinatorial screening identifies synthetic relationships between DDR factors.
a, Guide RNAs targeting 548 core DDR genes (GO:0006281) are systematically combined into a dual-guide lentiviral library termed SPIDR. Guide RNA samples were taken at time point zero (T0) and day 14 (T14). The screen was performed once in biological duplicates. b, Rank-ordering all pairwise interactions by sensitive GEMINI score identifies known synthetic relationships (magenta) and nominates new candidates (light blue). Red dashed line indicates a sensitive GEMINI score of −1. c, Clustered heat map of SPIDR genetic interaction profiles. Clusters with similar sets of genetic interactions encompass STRING annotated physically interacting sub-complexes. d, Synthetic relationships filtered at a GEMINI score of −1 or less are represented as a complex network, with the strength of the interaction determining the width of the edge. Nodes are coloured on the basis of whether they are mutated in cancer (magenta filled; COSMIC tier 1 and tier 2 genes), small-molecule targets (green rings; DGIdb targets) or both (magenta filled and green rings). Selected genetic interactions that may be therapeutically actionable (one member mutated in cancer and the other targeted by an existing small molecule) are highlighted. e, Experimental validation of five new synthetic lethal interactions identified by the SPIDR screen. Experiments were performed in triplicate, and the percentage of each cell population was quantified by flow cytometry. The log2 fold changes on day 14 relative to day 0 are shown. The additive phenotype (dashed line) was calculated by summing the individual depletion phenotypes. Error bars represent mean ± s.d. Complete survival time courses are shown in Extended Data Fig. 3c–h. f,g, Dual-colour flow cytometry survival time course of the FEN1:WDR48 (f) and FANCM:SMARCAL1 (g) interaction. Lines represent mean of three technical replicates. P values were calculated using two-way analysis of variance (ANOVA) between cells expressing both sgRNAs and each sgRNA alone. Source data
Fig. 2
Fig. 2. WDR48–USP1 counteracts RAD18-driven PCNA degradation.
a, Dual-colour flow cytometry assay of the LIG1:WDR48 interaction in cells expressing a control (CTRL) or RAD18-targeting sgRNA. Lines represent mean (three technical replicates). b, Similar to a, but in this case, cells were complemented with the indicated doxycycline (DOX)-inducible cDNAs. Day 10 values are shown. Error bars represent mean ± s.d. (three technical replicates). c, Western blot analysis of the indicated proteins. Repeated once with similar results. d, Top, schematic of the PIP–FUCCI reporter, experimental set-up and representative images. USP1i, 20 μM. Bottom, quantification of S phase length (two experimental replicates). At least 40 cells were measured per condition. The orange line denotes the median. Statistical analysis was performed using Kruskal–Wallis ANOVA. e, Left, representative flow cytometry plots of EdU incorporation and DNA content. Cells were treated with USP1i (25 μM) for 2 days. Samples were treated with 1 μg ml−1 DOX. Right, quantification of EdU incorporation in G2/M phase cells (three experimental replicates). Error bars represent mean ± s.d.; unpaired two-tailed Student’s t-test. f, Left, representative image of a UFB. Right, corresponding quantification (two experimental replicates). Cells stably expressing H2B–GFP were treated with USP1i (25 μM) for 24 h then imaged for an extra 24 h. Error bars represent mean ± s.d.; unpaired two-tailed Student’s t-test. g, Left, representative images of cyclin A and 53BP1 staining. Cells were treated with USP1i (25 μM) for 48 h. Right, corresponding quantification. Box plots show median values and data within the 10–90 percentile. The lower and upper ends indicate the 25th and 75th percentiles. At least 75 cells from two experimental replicates were quantified. Statistical analysis was performed using Kruskal–Wallis ANOVA. h, A model for the FEN1/LIG1:WDR48–USP1 synthetic lethal interactions. In dg, USP1i refers to KSQ-4279. EV, empty vector; LE, long exposure; SE, short exposure; Ub, ubiquitylated; WT, wild type. Scale bars, 10 μm (d,g), 25 μm (f). Source data
Fig. 3
Fig. 3. Combined FANCM and SMARCAL1 loss leads to DSBs at late-replicating TA-rich repeats.
a, Co-depletion of FANCM and SMARCAL1 reduces clonogenic survival. Cells were transduced with sgRNA-containing lentiviruses, co-expressed with either puromycin or neomycin resistance cassettes. Representative images of 10-day clonogenic survival are shown. Data are representative of two experimental replicates. b, Competitive growth assays for cells co-transduced with the indicated sgRNAs. The log2 fold change of co-depleted cells in a flow cytometry assay was normalized to the corresponding single depletions (sgFANCM or sgSMARCAL1). Values acquired on day 14 are shown. Error bars represent mean ± s.d.; unpaired two-tailed Student’s t-test. Three technical replicates from one experiment are shown. c, Representative images of 53BP1 foci in either wild-type or SMARCAL1 KO cells 7 days post-transduction with a non-targeting or FANCM-targeting sgRNA. d, Quantification of 53BP1 focus formation. Red line denotes the median; two-tailed Mann–Whitney test. A minimum of 80 cells from two experimental replicates were measured per condition. e, Representative images of nuclei, stained with Hoechst, in the indicated cells. White arrows indicate cells exhibiting nuclear fragmentation. f, Quantification of nuclear fragmentation events from three experimental replicates. Error bars represent mean ± s.d.; unpaired two-tailed Student’s t-test. g, Top, a representative metaphase spread from SMARCAL1 KO cells co-depleted of FANCM. Bottom, quantification of metaphases with at least one broken chromosome from three independent experiments. Error bars represent mean ± s.d.; unpaired two-tailed Student’s t-test. h, Top, a schematic of the MRE11 ChIP–seq approach. Three independent ChIP–seq experiments were performed. Bottom, representative MRE11 ChIP–seq tracks spanning a 1.5-kb window aligned with Repli-ChIP and Repli-seq tracks spanning a 10-Mb window in IMR90, H1-hESC, GM12878 and GM06990 cells. i, Consensus motif identified by performing Multiple Expectation maximizations for Motif Elicitation (MEME) analysis on DNA sequences underlying 72 MRE11 ChIP–seq peaks found only in SMARCAL1 KO:sgFANCM cells. NGS, next-generation sequencing; NS, not significant (P > 0.05). Scale bars, 20 μm (c,e), 10 μm (g). Source data
Fig. 4
Fig. 4. FANCM:SMARCAL1-deficient cells accumulate cruciforms that are predominantly cleaved by ERCC1–ERCC4.
a, Representative cruciform, FANCM and SMARCAL1 ChIP–seq (n = 1) tracks spanning a 10-kb window on chromosome 3. b, Profile plots and heat maps showing the intensity of cruciform signal at sites where FANCM is enriched in SMARCAL1 KO cells and sites where SMARCAL1 is enriched in FANCM KO cells. c, Top, schematic representation of the cruciform unfolding assay on a model TA repeat substrate. Bottom, unfolding of TA-cruciform DNA by SMARCAL1, SMARCAL1 ΔRBM and FANCM (data are representative of three experimental replicates). The presence of the cruciform secondary structure was estimated by DNA cutting with EcoRI, which does not cut hairpins at cruciform DNA but cuts double-stranded DNA. d, Representative MRE11 ChIP–seq (n = 1) tracks from SMARCAL1 KO:sgFANCM cells that also have knockdown of one of the indicated nucleases. e, Quantification of MRE11 enrichment at 35 sites in FANCM:SMARCAL1-deficient cells that also have knockdown of one of the indicated nucleases (n = 1; error bars represent mean ± s.d.). f, A model depicting the compensating activities of FANCM and SMARCAL1 in maintaining genome stability at TA repeats. Complementary action of FANCM and SMARCAL1 directly unfolds cruciforms that form at TA-rich repeats. When both SMARCAL1 and FANCM are absent, cruciforms are cleaved by ERCC1–ERCC4, leading to DSB formation upon entry into mitosis. Source data
Extended Data Fig. 1
Extended Data Fig. 1. General Quality control of SPIDR screen.
Quantification of log2 pair count of replicate 1 at a, T0 and b, T14 shows high coverage at T0 and drop out of many combinations at T14. c, LFC comparison between library elements (targeting:non-targeting) with the targeting sgRNA in library position A or B in screen replicate 1 and 2. d, log(RPM + 1) analysis of screen replicate count data at T0 and T14. e, LFC comparison T14vsT0 for all library elements. f, Volcano plot of log2 fold change of non-targeting (non-targeting:non-targeting) and single gene (targeting:targeting) targeting library elements at T14 compared to T0. Common essential genes (e.g., MCM2, GTF2H2) show high negative values while tumor suppressors SAMHD1 and TAOK1 show a positive log2 fold change, respectively. Statistical significance was determined using the Wald test, with Benjamini-Hochberg post-test.
Extended Data Fig. 2
Extended Data Fig. 2. Mismatch guide analysis and correlation of SPIDR interactions with physical interactions.
a, Growth phenotypes of mismatched sgRNAs for strongly essential genes. Violin plot showing the log2 fold change of 91 essential sgRNAs (LFC ≤ −3) and their mismatched variant. Mismatched variants have significantly decreased growth phenotype, two-tailed Wilcoxon rank sum test. Density plot for essential sgRNAs showing delta LFC for mismatched subtracted by perfect sgRNAs. Box plots show median values and data within the 25th–75th percentile, with whiskers representing the upper and lower percentiles +/− 1.5 * interquartile range. Most mismatched variants reduce the negative growth phenotype, leading to the majority of delta LFC density > 0. Vertical dashed line indicates delta LFC of 0. b, log2(mRNA fold change) measured by RT-qPCR of perfect and mismatch sgRNAs for selected essential genes. Error bars represent mean ± s.d. RPA1, RAD9A, and BRCA1 (n = 3 experimental replicates) and CHEK1 (n = 2 experimental replicates). LFCs of the selected sgRNAs (targeting:non-targeting) from the SPIDR screen (right). The boxplot formats are the same as in a. c, Sensitive GEMINI score rank-ordering of all binary interactions with perfect sgRNAs or mismatched sgRNAs (asterisk) for essential genes. Mismatch sgRNAs help to recover known (magenta) as well as novel (light blue) genetic interactions. d, Histogram of GEMINI synergy scores of all genetic interactions. e, Sensitive GEMINI scores from the SPIDR library were separated into six equal bins and compared to STRING probability scores retrieved from version 12 of the human database. A stronger SPIDR genetic interaction correlates with STRING score. Box plots show median values and data within the 25th–75th percentile, with whiskers representing the upper and lower percentiles +/− 1.5 * interquartile range. Analysis was performed on all 147,787 gene pairs in the SPIDR library. f, UMAP projecting the full set of interactions of each DDR gene with all other DDR genes. Several DDR gene neighborhoods with known, shared functions are highlighted. The UMAP was generated using the strong GEMINI score.
Extended Data Fig. 3
Extended Data Fig. 3. Orthogonal validation of novel synthetic lethal gene pairs.
a, Left: Schematic representation of the dual-color flow cytometry assay. Cells are transduced with sgRNAs and assayed 96 h later and at regular intervals thereafter. Right: An example of the flow cytometry gating strategy. b, Representative flow cytometry density plots of the FEN1:WDR48 interaction in RPE-1 TP53 KO dCas9-KRAB cells. c-h, RPE-1 TP53 KO dCas9-KRAB cells were co-transduced with the indicated sgRNAs. Cells populations were first measured by flow cytometry 96 h after transduction (day 0) and on the indicated days thereafter. Log2 fold changes relative to day 0 are shown. These panels show the full quantifications of data plotted in Fig. 1e. Source data
Extended Data Fig. 4
Extended Data Fig. 4. Focused SPIDR screens in HeLa and K562 cells and independent validation of synthetic lethal gene pairs.
a, LFC comparison T14vsT0 for all library elements. b, Volcano plot of log2 fold change of non-targeting (non-targeting:non-targeting) and single gene targeting (targeting:non-targeting) library elements at T14 compared to T0. Statistical significance was determined using the Wald test, with Benjamini-Hochberg post-test. c, Three-way Venn diagram of essential genes shows differential essential genes identified in the three CRISPRi screens. d, Rank order plots of GEMINI sensitive scores in HeLa S3 dCas9-ZIM3 and K562 dCas9-KRAB cells from the focused SPIDR screens. e, Three-way Venn diagram showing the intersection of synthetic lethal interactions identified in the three CRISPRi screens. Hits are listed in supplementary table 4. f, Stringently filtering for only the strongest synthetic relationships (GEMINI sensitive score ≤−2.5) in RPE-1 cells reveals two unanticipated synthetic lethal modules: WDR48 (also known as UAF1) with LIG1 and FEN1, and SMARCAL1 with FANCM and C19orf40/FAAP24. g, Dual-color flow cytometry assay performed in HeLa S3 dCas9-ZIM3 and K562 dCas9-KRAB cells. The log2 fold changes relative to day 0 are shown. Day 10 values are shown for all pairs except for FEN1:WDR48 (in K562 cells), where day 7 values are shown due to complete dropout of the double transduced population. Error bars represent mean ± s.d. 3 technical replicates are shown. Source data
Extended Data Fig. 5
Extended Data Fig. 5. The LIG1/FEN1:WDR48-USP1 genetic interactions involve the enzymatic activities of LIG1, FEN1, and USP1.
a, All genetic interactions of LIG1 identified in the SPIDR screen. b-c, Quantification of dual-color competitive growth assays with the indicated (DOX)-inducible FEN1 and LIG1 cDNAs. Dox concentration, 0.5 μg ml−1. Day 3 values are shown. Unpaired, two-tailed Student’s t-test. d, Western blots validating FEN1 and LIG1 cDNA expression (n = 1). e, Flow cytometric quantifications of the genetic interactions between FEN1/LIG1 and the genes encoding the WDR48-interacting proteins USP1, USP12, and USP46. Values acquired on day 14 and day 18 are shown respectively. f, Quantification of competitive growth assays with cells transduced with the indicated sgRNAs. Cell populations were monitored by flow cytometry after a 12-day treatment with DMSO or USP1i (KSQ-4279, 6 μM). g, Left: Dual-color flow cytometry for the LIG1:WDR48 interaction in cells expressing CTRL or FANCL sgRNA. Right: RT-qPCR data showing relative mRNA expression of FANCL in sgCTRL and sgFANCL cells. h, Quantification of competitive growth assays with cells transduced with the indicated sgRNAs. Cell populations were monitored by flow cytometry after a 10-day treatment with DMSO or FEN1i (10 μM). i, Clonogenic survival assay of cells transduced with either a CTRL or RAD18 sgRNA. Cells were cultured for 10 days in the presence of DMSO, FEN1i (5 μM) and/or the USP1 inhibitor KSQ-4279 (2 μM). Data are representative of two experimental replicates. j-k, The indicated cells were treated with KSQ-4279 (25 μM, 24 h), and cells lysates were subjected to diGly capture proteomics. The fold change of individual ubiquitylated peptides is shown. Three technical replicates are shown for b, c & e-h. Error bars represent mean ± s.d. Source data
Extended Data Fig. 6
Extended Data Fig. 6. The LIG1/FEN1:WDR48-USP1 genetic interactions are driven by low PCNA protein levels and associated with replication gaps and a longer S phase.
a, Left: Dual-color flow cytometry assay of the LIG1:WDR48 interaction in cells that were treated with the REV1-REV7 interface inhibitor, JH-RE-06 (REV1-REV7i, 1 μM) or expressing CTRL or RFWD3 sgRNA. Right: RT-qPCR data showing relative mRNA expression of RFWD3 in sgCTRL and sgRFWD3 cells. b, Dual-color flow cytometry assay of FEN1, WDR48, and co-depleted cells complemented with the indicated doxycycline (DOX)-inducible cDNAs. Dox concentration 1 μg ml−1 (for all PCNA cDNAs). Day 10 values are shown. Unpaired, two-tailed Student’s t-test. c, Western blot showing PCNA and ubiquitylated PCNA levels in sgCTRL, sgLIG1 or sgFEN1 cells after a 7-day treatment with DMSO or USP1i (KSQ-4279, 25 μM). d, RT-qPCR data of relative PCNA mRNA expression in the cells in (a). e, Representative flow cytometry profiles of DNA content (DAPI) analysis in cells transduced with the indicated sgRNAs 28 hrs after release from G0/G1. G0/G1 arrested cells were released into the cell cycle in the presence of DMSO or the USP1 inhibitor ML-323 (USP1i; 30 μM). f, Quantification of (e) with all timepoints. g, Representative images and quantification of BrdU/RPA32 staining of sgCTRL or sgLIG1 cells after a 7-day treatment with DMSO or USP1i (KSQ-4279, 25 μM). Red line denotes the mean; unpaired, two-tailed Student’s t-test. A minimum of 100 cells derived from two experimental replicates were measured per condition. Scale bar, 2 μm. 3 technical replicates are shown for a, b & d-f. Error bars represent mean ± s.d. Source data
Extended Data Fig. 7
Extended Data Fig. 7. Low PCNA protein levels lead to ssDNA gaps, a longer S phase, ultrafine bridges, under-replicated DNA, and DNA damage.
a, Top: schematic of the S1 nuclease DNA fiber assay. Where indicated, cells were treated with KSQ-4279 (25 μM). Bottom: measurements of IdU tract lengths in the indicated cells, with and without S1 nuclease treatment. A minimum of 70 tracts from one experiment were measured per condition. Orange line denotes the median. b, Measurements of IdU/CIdU ratio for fibers shown in Extended Data Fig. 7a. A minimum of 70 tracts from one experiment were measured per condition. Orange line denotes the median. c, Left: Quantification of the dual-color flow cytometry assay with indicated cDNAs. 3 technical replicates are shown. Error bars represent mean ± s.d. Right: Western blot of indicated cells. Expression was induced with 1 µg ml−1 doxycycline. d, Representative gating of EdU-high cells in G2/M phases. Corresponds to data shown in Fig. 2e. e, Quantification of ultrafine anaphase bridges for sgFEN1 cells. Data are representative of two experimental replicates. Error bars represent mean ± s.d. f, Quantification of 53BP1 nuclear bodies for sgFEN1 cells. Whisker box plots show median values and data within the 10–90 percentile. The lower and upper ends of the boxplot indicate the 25th and 75th percentile values. At least 75 cells were quantified from two experimental replicates. The values for sgCTRL and sgRAD18 samples are the same as those in Fig. 2g. g, Western blot of cells transduced with the indicated sgRNAs and treated with DMSO or the USP1 inhibitor (USP1i) ML-323 (30 μM) for 7 days. LE, long exposure; SE, short exposure. Phosphorylated (p)KAP1 on serine (S) 824 and γH2AX ubiquitylation (Ub) serve as markers of DSB signalling. h, Western blot of cells transduced with the indicated sgRNAs and cDNAs, treated with DMSO or the USP1i, KSQ-4279 (25 μM) for 7 days. g-h were each performed once. Source data
Extended Data Fig. 8
Extended Data Fig. 8. Validation and characterization of the FANCM:SMARCAL1 synthetic lethal interaction.
a, Western blot validating sgRNA-mediated knockdown of FANCM and SMARCAL1 (n = 1). b, Quantifications of the dual-color flow cytometry assay measurements of cells transduced with the indicated sgRNAs. The log2 fold change on day 14 is shown. Error bars represent mean ± s.d. of 3 technical replicates. c, Western blot of FANCM and SMARCAL1 knockout (KO) cells (n = 1). The asterisk denotes a non-specific band. d, Competitive growth assays of wild-type (WT) and FANCM or SMARCAL1 KO RPE-1 TP53 KO dCas9-KRAB cells transduced with the indicated sgRNAs with the same MOI. Values were normalized to day 0. e, Dual-color flow cytometry assay of dCas9-KRAB-expressing RPE-1 TP53-proficient and HEK293 cells transduced with the indicated sgRNAs. Log2 fold changes relative to day 0 are shown. f, Quantification of the dual-color assay for cells expressing sgRNAs targeting FAAP24 and/or SMARCAL1. g, Validation of CRISPRi-mediated knockdown of ZRANB3 and HLTF by RT-qPCR. mRNA expression was normalized to the sgCTRL sample. 3 technical replicates are shown. h, Quantification of the dual-color flow cytometry assay for FANCM:SMARCAL1 co-depleted cells complemented with the indicated FANCM cDNAs. cDNA expression was induced with 1 µg ml−1 doxycycline. The log2 fold change was normalized to Day 0. Error bars represent mean ± s.d. i, Western blot controls of cDNA expression for Extended Data Fig. 8h. j, Dual-color flow cytometry assay for FANCM:SMARCAL1 co-depleted cells complemented with the indicated SMARCAL1 cDNAs. Error bars represent mean ± s.d. Experiments were performed as in Extended Data Fig. 8h, except cDNA expression was induced with 0.25 µg/ml−1 doxycycline. k, Western blot controls of cDNA expression for Extended Data Fig. 8j. Unpaired, two-tailed Student’s t-tests compare cells expressing WT cDNAs with each other condition on day 14; ns = not significant (P > 0.05); Three technical replicates are shown for b, d, e, f, h, and j. Source data
Extended Data Fig. 9
Extended Data Fig. 9. Related to Fig. 3. FANCM:SMARCAL1-deficient cells are highly sensitive to hydroxyurea or Olaparib.
a, Left: schematic representation of the drug sensitivity assay. Right: dual-color flow cytometry survival curves for cells expressing the indicated sgRNAs and treated with mitomycin C (5 nM, 24 h; n = 3 technical replicates), hydroxyurea (2 mM, 24 h; n = 2 experimental replicates), or Olaparib (2 µM, chronic; n = 3 technical replicates). Cell population ratios were normalized to those of corresponding untreated cells. A full stress sensitization panel can be found in (b). b, Cells were treated with genotoxic agents (APH, aphidicolin; PDS, pyridostatin; ETO, etoposide; CPT, camptothecin) 96 hrs after transduction with the indicated sgRNAs. Concentrations and treatment durations are indicated above each panel. Cells were re-analysed by FACS 7 days later. Cell population ratios were normalized to those of corresponding untreated cells. Three technical replicates are shown. Error bars represent mean ± s.d. c, Survival curves of RPE-1 TP53 KO cells transduced with sgRNAs targeting FANCM and SMARCAL1 and nucleofected with a cDNA encoding either wild-type (WT) or R-loop-binding defective (WKKD) RNase H1. Source data
Extended Data Fig. 10
Extended Data Fig. 10. Related to Fig. 3. Further characterization of late-replicating TA-rich DSB sites.
a, A Venn diagram showing the intersection between the 72 break sites and the 125 common fragile sites in the humCFS database. b, Example screenshot of MAST output from the 72 break sites. The most common motifs are shown in dark and light gray. Peak sequences contain multiple copies of the respective motifs. c, Plot showing the AT fraction per 20 base pair adjacent windows across 72 MRE11 ChIP-Seq peaks only found in the SMARCAL1 KO:sgFANCM cells. Peaks were aligned according to their peak center. The AT fraction was calculated per 20 base pair in a 1 kb window. Blackline indicates the mean and blue area indicates standard deviation. The average AT fraction of the human genome is shown as a grey dashed line. d, Boxplot showing the lengths (1-99 percentile) of all annotated TA repeats in the hg19 reference genome, grouped according to whether or not they overlap an MRE11 ChIP-Seq peak exclusively detected in SMARCAL1 KO:sgFANCM cells. The lower and upper ends of the boxplot indicate the 25th and 75th percentile values. Centre line represents median. 69/72 MRE11 peaks overlapped an annotated TA repeat. 66,575 annotated TA repeats do not overlap MRE11 peaks. The locations and lengths of (TA)n repeats in the hg19 reference genome were taken from van Wietmarschen et al., 2020. e, Heatmap showing percentage-normalized signal from Repli-seq data in GM06990 cells across 72 MRE11 ChIP-Seq peaks only found in the SMARCAL1 KO:sgFANCM cells. The average signal for each phase was taken per peak and ordered from late to early replication timing. f Pie chart showing 72 MRE11 ChIP-Seq peaks only found in the SMARCAL1 KO:sgFANCM cells categorized into replication timing phases based on the maximum signal below each peak using percentage-normalized signal tracks from Repli-seq data in GM06990 cells. Source data
Extended Data Fig. 11
Extended Data Fig. 11. Related to Fig. 4. Cruciform formation at MRE11 sites and characterisation of FANCM and SMARCAL1 binding sites.
a, Profile plots and heat maps showing the intensity of cruciform signal at sites where MRE11 is enriched in the indicated cells. b, Consensus motif identified by performing MEME analysis on DNA sequences underlying cruciform peaks identified in SMARCAL1 KO:sgFANCM cells that do not overlap MRE11 sites. c, MEME analysis on DNA sequences underlying FANCM ChIP-Seq peaks in SMARCAL1 KO cells and SMARCAL1 peaks in FANCM KO cells. d, Venn diagram showing the overlap between ChIP-Seq peaks for SMARCAL1 and FANCM.
Extended Data Fig. 12
Extended Data Fig. 12. Related to Fig. 4. In vitro cruciform unwinding and rescue of 53BP1 foci.
a, Polyacrylamide gels showing recombinant SMARCAL1, SMARCAL1 ΔRBM and FANCM (n = 1). b, Schematic of the different substrates used in the unwinding assays. c, Gels validating secondary structure formation. Incubation with the structure-specific T7 Endonuclease I and SspI results in the production of bands at the expected positions of 606 and 2,120 bp (n = 1). The SspI restriction site is 606 bp away from the cruciform site. Incubation with EcoRI produces a linear DNA fragment with PUC19 and PUC19_chr3. On PUC19_TA, the EcoRI sites are at the apex of the cruciform, and hence refractory to cleavage when a cruciform is present. d, Representative cruciform unfolding assay on the PUC19_chr3 substrate showing SMARCAL1, SMARCAL1 ΔRBM and FANCM prevent DNA cutting by T7 endonuclease I (n = 2). e, Representative unwinding assay of PUC19_chr3 in the presence and absence of RPA (20 nM). SMARCAL1 ΔRBM shows a reduced activity in the presence of RPA at lower concentrations. Quantified for 30 nM in f. g, Quantification of 53BP1 foci in the indicated cells. At least 100 cells were quantified per condition. Red line denotes the mean. h, RT-qPCR data of cells transduced with sgCTRL, sgERCC1, sgERCC4, sgMUS81, sgGEN1 show knockdown of mRNA transcripts for each sgRNA. Error bars represent mean ± s.d. of three experimental replicates. Source data

References

    1. Jackson, S. P. & Bartek, J. The DNA-damage response in human biology and disease. Nature461, 1071–1078 (2009). - PMC - PubMed
    1. Cortez, D. Replication-coupled DNA repair. Mol. Cell74, 866–876 (2019). - PMC - PubMed
    1. Tong, A. H. Y. et al. Global mapping of the yeast genetic interaction network. Science303, 808–813 (2004). - PubMed
    1. Horlbeck, M. A. et al. Mapping the genetic landscape of human cells. Cell174, 953–967.e22 (2018). - PMC - PubMed
    1. Shaheen, C. et al. Non-equilibrium structural dynamics of supercoiled DNA plasmids exhibits asymmetrical relaxation. Nucleic Acids Res.50, 2754–2764 (2022). - PMC - PubMed

MeSH terms

LinkOut - more resources