. 2025 May;641(8062):427-437.
doi: 10.1038/s41586-025-08807-4. Epub 2025 Apr 9.

Stress dynamically modulates neuronal autophagy to gate depression onset

Affiliations

Stress dynamically modulates neuronal autophagy to gate depression onset

Liang Yang et al. Nature. 2025 May.

Erratum in

Abstract

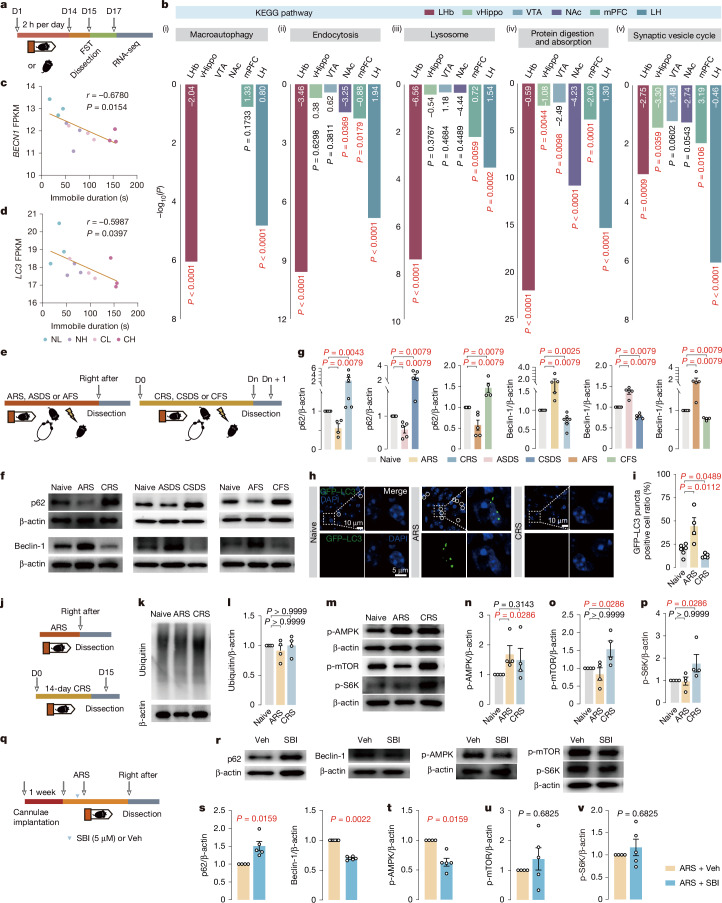
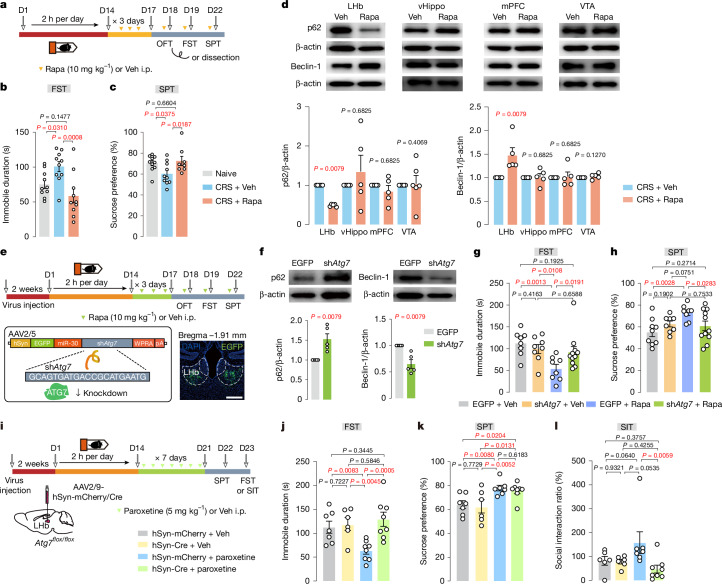
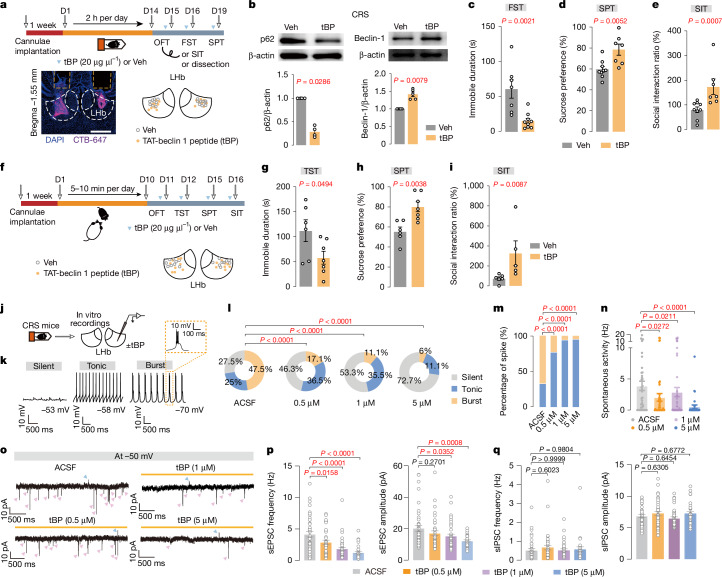
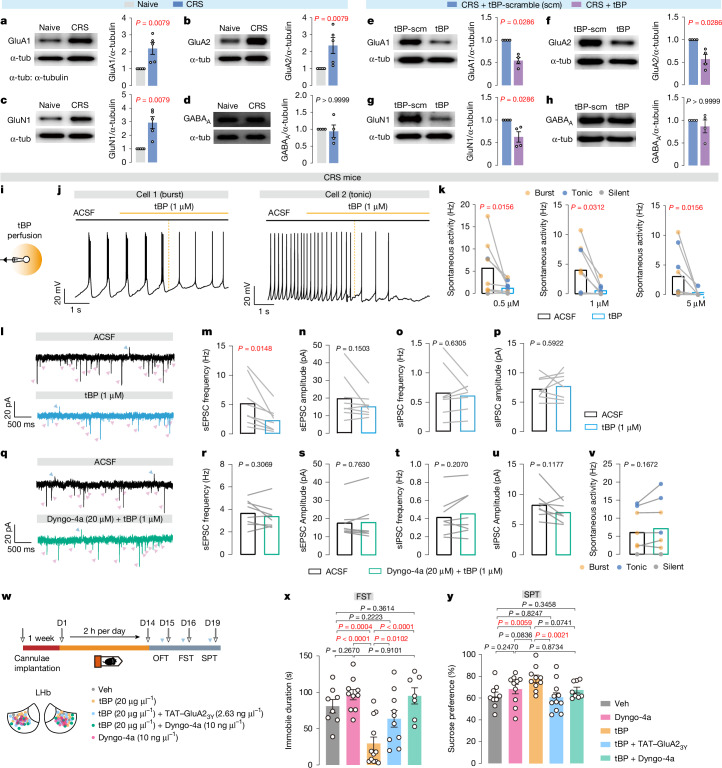
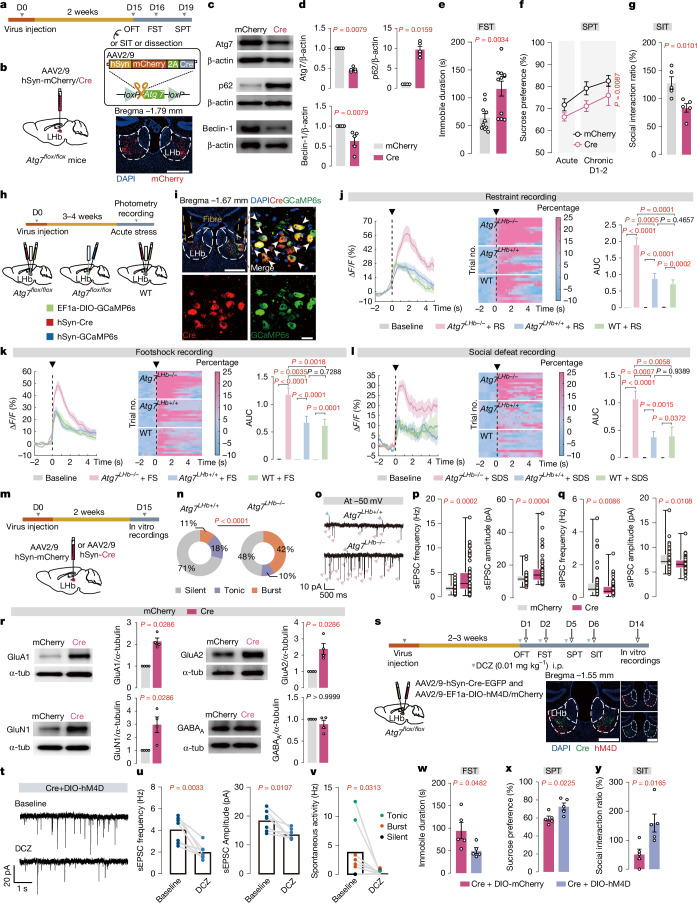
Chronic stress remodels brain homeostasis, in which persistent change leads to depressive disorders1. As a key modulator of brain homeostasis2, it remains elusive whether and how brain autophagy is engaged in stress dynamics. Here we discover that acute stress activates, whereas chronic stress suppresses, autophagy mainly in the lateral habenula (LHb). Systemic administration of distinct antidepressant drugs similarly restores autophagy function in the LHb, suggesting LHb autophagy as a common antidepressant target. Genetic ablation of LHb neuronal autophagy promotes stress susceptibility, whereas enhancing LHb autophagy exerts rapid antidepressant-like effects. LHb autophagy controls neuronal excitability, synaptic transmission and plasticity by means of on-demand degradation of glutamate receptors. Collectively, this study shows a causal role of LHb autophagy in maintaining emotional homeostasis against stress. Disrupted LHb autophagy is implicated in the maladaptation to chronic stress, and its reversal by autophagy enhancers provides a new antidepressant strategy.


Conflict of interest statement

Competing interests: The authors declare no competing interests.

Figures

Fig. 1
Fig. 1. Acute stress activates, whereas chronic stress impairs, LHb autophagy.
a, Experimental design. D, day. b, Two-sided classic KEGG analysis of bulk RNA-seq (nnaive/CRS = 3 per group; numbers on the bar indicate the corresponding z-score). LH, lateral hypothalamus. c,d, Correlation of Becn1 (c) and LC3 (d) mRNA fragments per kilobase million (FPKM) with behavioural scores (n = 12 mice). CH, CRS mice with high FST; CL, CRS mice with low FST; NH, naive mice with high FST; NL, naive mice with low FST. e, Experimental designs. AFS, acute footshock stress; ASDS, acute social defeat stress; CFS, chronic footshock stress; CSDS, chronic social defeat stress. f,g, Representative images (f) and quantification (g) of western blot (p62, nnaive/ARS/CRS = 5, 4, 6; Beclin-1, nnaive/ARS/CRS = 5, 5, 7; nnaive/ASDS/CSDS = 5 per group for p62 and Beclin-1; nnaive/AFS/CFS = 5, 5, 4 for p62 and Beclin-1). h,i, Representative images (h) and quantification (i) of the proportion of GFP-puncta-positive cells in LHb of GFP-LC3 mice treated with ARS and CRS. White circles denote colocalization of GFP–LC3 puncta and DAPI (nnaive/ARS/CRS = 6/4/5). j, Experimental designs. kp, Representative images (k,m) and quantification of ubiquitin (l), p-AMPK (n), p-mTOR (o) and p-S6K (p) western blot (nnaive/ARS/CRS = 4 per group). qv, Experimental design (q), representative images (r) and quantification of p62 and Beclin-1 (s, p62, nARS+Veh/CRS+SBI = 4, 5; Beclin-1, nARS+Veh/CRS+SBI = 6 per group), p-AMPK (t, nARS+Veh/CRS+SBI = 4, 5), p-mTOR (u, nARS+Veh/CRS+SBI = 4, 5) and p-S6K (v, nARS+Veh/CRS+SBI = 4, 5) western blot showing effect of SBI treatment on autophagy. Veh, vehicle. Two-sided Mann–Whitney test (g,l,mp,sv), two-sided unpaired t-test (i) and Pearson correlation test (c,d). Data are mean ± s.e.m. Schematics in a,e,j,k adapted from ref. , Elsevier. Source data
Fig. 2
Fig. 2. Actions of different antidepressants commonly require LHb autophagy.
a, Experimental design. Rapa, rapamycin; i.p., intraperitoneal injection. b,c, Intraperitoneal injection of rapamycin alleviates depression-like phenotypes (b, nnaive/CRS+Veh/CRS+Rapa = 10 per group; c, nnaive/CRS+Veh/CRS+Rapa = 10, 10, 8). d, Intraperitoneal injection of rapamycin enhances autophagy selectively in LHb but not vHippo, mPFC and VTA of CRS mice (p62, nCRS+Veh/CRS+Rapa = 5, 6 for VTA, nCRS+Veh/CRS+Rapa = 5 per group for the rest of brain regions; Beclin-1, nCRS+Veh/CRS+Rapa = 5 per group). e, Experimental design, shRNA working model and a representative image of viral expression. Scale bar, 500 μm. f, Representative images (top) and quantification (bottom) of p62 and Beclin-1 western blot from LHb lysates, showing that Atg7 knockdown decreases LHb autophagy (that is, increased p62 and decreased Beclin-1) (nEGFP/shAtg7 = 5 per group for p62 and Beclin-1). g,h, Knockdown of Atg7 in LHb abolishes antidepressant-like effects of rapamycin in CRS mice (g, nEGFP+Veh/shAtg7+Veh/EGFP+Rapa/shAtg7+Rapa = 8, 8, 11, 8; h, nEGFP+Veh/shAtg7+Veh/EGFP+Rapa/shAtg7+Rapa = 9, 8, 11, 8). i, Experimental design. jl, Conditional knockout of Atg7 in LHb abolishes antidepressant-like effects of paroxetine in FST (j, nmCherry+Veh/cre+Veh/mCherry+Pxt/cre+Pxt = 7, 6, 8, 8) and SIT (l, nmCherry+Veh/cre+Veh/mCherry+Pxt/cre+Pxt = 6/6/7/8), but not SPT (k, nmCherry+Veh/cre+Veh/mCherry+Pxt/cre+Pxt = 7, 6, 7, 8). Two-sided Mann–Whitney test (d,f) and one-way ANOVA with uncorrected Fisher’s least significant difference (LSD) test (b,c,g,h,jl). Data are mean ± s.e.m. Schematics in a,e,i adapted from ref. , Elsevier. Source data
Fig. 3
Fig. 3. Enhancing LHb autophagy rapidly exerts antidepressant-like effects by means of normalization of neuronal hyperactivity and synaptic deficit in chronic stressed mice.
a, Experimental designs, representative illustrations of bilateral implantation of cannulae and drug infusion sites. Scale bar, 500 μm. b, Representative images (top) and quantification (bottom) of western blot show that local infusion of tBP instantly increases LHb autophagy (that is, decreased p62 and increased Beclin-1) (tested within 30 min after tBP infusion; p62, nVeh/tBP = 4 per group; Beclin-1, nVeh/tBP = 5 per group). ce, LHb local infusion of tBP rapidly alleviates depression-like phenotypes in CRS mice (c, nVeh/tBP = 7, 9; d,e, nVeh/tBP = 9, 7). f, Experimental design. gi, Local infusion of tBP in LHb rapidly alleviates depression-like phenotypes in CSDS mice (g,h, nVeh/tBP = 6, 7; i, nVeh/tBP = 6, 5). j, Experimental design. k, Representative traces showing spontaneous activity (I = 0) of silent (left), tonic-firing (middle) and burst-firing (right) LHb neurons recorded with whole-cell patch clamp. ln, Pie charts (l, nACSF/0.5/1/5 = 40, 41, 45, 33 neurons; nACSF/0.5/1/5 = 8, 6, 7, 8 mice), histograms (m, nACSF/0.5/1/5 = 40, 41, 45, 33 neurons; nACSF/0.5/1/5 = 8, 6, 7, 8 mice) and bar graphs (n, nACSF/0.5/1/5 = 40, 41, 43, 33 neurons; nACSF/0.5/1/5 = 8, 6, 7, 8 mice) showing dose-dependent effects of tBP on spontaneous firing patterns, percentage of spikes and firing frequencies of LHb neurons in CRS mice. ACSF, artificial cerebrospinal fluid. oq, Representative traces (o) and quantification (frequency (p) and amplitude (q)) showing dose-dependent effects of tBP on synaptic transmission onto LHb neurons in CRS mice (p, nACSF/0.5/1/5 = 43, 39, 44, 30 neurons; nACSF/0.5/1/5 = 8, 6, 7, 8 mice; q, nACSF/0.5/1/5 = 42, 39, 44, 29 neurons; nACSF/0.5/1/5 = 8, 6, 7, 8 mice). Blue or pink arrowheads indicate spontaneous excitatory and inhibitory postsynaptic current (sEPSC and sIPSC, respectively) events. Two-sided unpaired t-test (g,h), two-sided Mann–Whitney test (be,i), one-way ANOVA with Dunn’s multiple comparisons test (p,q), Kruskal–Wallis test with uncorrected Dunn’s test (n) and two-sided chi-square test (l,m). Data are mean ± s.e.m. Schematics in a,f,j adapted from ref. , Elsevier. Source data
Fig. 4
Fig. 4. Enhancing LHb autophagy facilitates synaptic GluRs degradation for normalizing neuronal hyperactivity and depression-like behaviours.
ah, Western blot analysis showing that CRS (ad) increased, whereas activating LHb autophagy by local infusion of tBP (eh) decreased, the expression of GluA1 (a,e), GluA2 (b,f) and GluN1 (c,g), without affecting the GABAA receptor subunit (d,h) (ac, nnaive/CRS = 5 per group; d, nnaive/CRS = 4; eh, nCRS+tBP-scm/CRS+tBP = 4 per group). α-tub, α-tubulin i, Experimental design. j,k, Representative traces (j) and quantification (k) show the acute effect of tBP perfusion on spontaneous firing patterns and firing frequency of LHb neurons (nACSF/0.5/1/5 = 8, 8, 9 neurons, nACSF/0.5/1/5 = 7, 6, 6 mice). lp, Representative traces (l) and quantification (frequency (m,o) and amplitude (n,p) of sEPSC and sIPSC) showing spontaneous neural transmission before and right after tBP perfusion in LHb neurons of CRS mice (1 μM tBP, nACSF/tBP = 8 neurons, nACSF/tBP = 6 mice). qu, Representative traces (q) and quantification (ru) showing spontaneous neural transmission before and right after coperfusion of tBP and Dyngo-4a in LHb neurons of CRS mice (Dyngo-4a + 1 μM tBP, nACSF/Dyngo+tBP = 8 neurons, nACSF/Dyngo+tBP = 3 mice): sEPSC frequency (r), sEPSC amplitude (s), sIPSC frequency (t) and sIPSC amplitude (u). v, Bar graph showing spontaneous firing frequency before and after coperfusion of tBP and Dyngo-4a (Dyngo-4a + 1 μM tBP, nACSF/Dyngo+tBP = 8 neurons, nACSF/Dyngo+tBP = 3 mice). w, Experimental design. x,y, tBP decreases immobile duration in FST (x) and increases sucrose preference in SPT (y) whereas co-application of tBP with Dyngo-4a or TAT–GluA23Y reverses this effect (x, nVeh/Dyngo/tBP/tBP+TAT–GluA23y/Dyngo+tBP = 8, 10, 12, 10, 7; y, nVeh/Dyngo/tBP/tBP+TAT–GluA23y/Dyngo+tBP = 9, 10, 10, 11, 8. Two-sided Mann–Whitney test (ah), two-sided paired t-test (k,mp,rv), two-sided Wilcoxon test (k), one-way ANOVA with uncorrected Fisher’s LSD test (x,y). Data are mean ± s.e.m. Schematic in w adapted from ref. , Elsevier. Source data
Fig. 5
Fig. 5. Genetic ablation of LHb neuronal autophagy directly elicits depression-like phenotypes and neuronal hyperactivity.
a, Experimental design. b, Viral strategy. c,d, Representative images (c) and quantification (d) of Atg7, p62 and Beclin-1 western blot showing decreased autophagy in LHb of Atg7LHb−/− mice (d, Atg7: nmCherry/Cre = 5 per group, p62: nmCherry/Cre = 4/5, Beclin-1: nmCherry/Cre = 5 per group). eg, Atg7LHb−/− mice showed depression-like phenotypes (e and f, nmCherry/Cre = 10/11; g, nmCherry/Cre = 5 per group). h, Experimental designs. i, Representative images of histology. White arrowheads: colocalization of GCaMP6s and Cre. Scale bars: 500 μm (top), 20 μm (bottom). jl, Averaged responses (left), heat maps (middle) and area under the curve (AUC) (right) showing Ca2+ signals in LHb neurons evoked by stressors (j, nAtg7−/−+RS/Atg7+/+RS/WT+RS = 12, 14, 10 trials; 3, 3, 3 mice; k, nAtg7−/−+FS/Atg7+/+FS/WT+FS = 17, 15, 14 trials; 3, 4, 4 mice; l, nAtg7−/−+SDS/Atg7+/+SDS/WT+SDS = 14, 13, 11 trials; 3, 3, 3 mice). m, Experimental design. n, Pie charts illustrating the percentage of three neuronal subtypes in LHb (nAtg7+/+/Atg7−/− = 55, 64 neurons; 6, 6 mice). oq, Representative traces (o) and quantification (p, nAtg7+/+/Atg7−/− = 53, 64 neurons; 6, 6 mice; q, nAtg7+/+/Atg7−/− = 51/61 neurons, 6/6 mice) showing that Atg7 deficiency alters LHb synaptic transmission. r, Western blot analysis of GluA1, GluA2, GluN1 and GABAA expression in LHb of Atg7LHb+/+ and Atg7LHb−/− mice (nmCherry/Cre = 4 per group). s, Chemogenetic strategy and representative images of histology. tv, Representative traces (t) and quantification showing the effect of deschloroclozapine (DCZ) on sEPSCs (n = 7 neurons, three mice) (u) and spontaneous activity (n = 8 neurons, three mice) (v). wy, Chemogenetic silencing of LHb neurons rescues depression-like phenotypes in FST (w), SPT (x) and SIT (y) in Atg7LHb−/− mice (nDIO-mCherry/DIO-hM4D = 5 per group). Two-sided Mann–Whitney test (d,pr), two-sided unpaired t-test (e,g,wy), two-sided paired t-test (u), two-sided unpaired t-test and two-sided paired t-test (jl), two-sided Wilcoxon test (v), two-way ANOVA (f) and two-sided chi-square test (n). Data are mean ± s.e.m. Scale bar, 500 μm (b,s). Schematics in b,h,m,s adapted from ref. , Elsevier. Source data
Extended Data Fig. 1
Extended Data Fig. 1. Region-specific effect of chronic stress or antidepressants on brain autophagy.
a, b, Antidepressant dose regimen of paroxetine (a1, LHb, nVeh/Pxt = 5/7; nVeh/Pxt = 7 for the rest of brain regions; a2, nVeh/Pxt = 5/group) and ketamine (b1, nVeh/Pxt = 5/6, for LS, nVeh/Pxt = 5 for the rest of brain regions; b2, nVeh/Pxt = 5 for MRN, nVeh/Pxt = 5/6 for the rest of brain regions) treatment (i.p.) enhances autophagy (i.e., decreased p62 and increased Beclin-1) in LHb, but does not affect autophagy in vHippo, mPFC, VTA, LH, NAc, LS, DRN and MRN of CRS mice. Two-sided Mann-Whitney test (a1, a2, b1 and b2). Data are mean ± s.e.m. LHb, lateral habenula; vHippo, ventral hippocampus; VTA, ventral tegmental area; NAc, nucleus accumbens; mPFC, medial prefrontal cortex; LH, lateral hypothalamus; LS, lateral septum; DRN, dorsal raphe; MRN, median raphe; Veh, vehicle; Pxt, paroxetine; Ket, ketamine; CRS, chronic restraint stress. Schematics in a,b adapted from ref. , Elsevier. Source data
Extended Data Fig. 2
Extended Data Fig. 2. Chronic but not acute administration of paroxetine enhances LHb autophagy, normalizes LHb neuronal hyperactivity and affects behavioral outcomes.
a-c, Acute paroxetine treatment (i.p.) does not exert antidepressant-like effects (b, nVeh/Pxt = 5/group) or alter LHb autophagy (c, nVeh/Pxt = 4/5 for p62, nVeh/Pxt = 5/group for Beclin-1) in CRS mice. d-h, Representative traces (d) and quantification (e-h) of synaptic activity under 1-day or 7-day i.p. injection of paroxetine in CRS mice (e and f, NCRS/CRS+paro 1d/CRS+paro 7d = 35/42/40 neurons, NCRS/CRS+paro 1d/CRS+paro 7d = 4/5/5 mice; g and h, NCRS/CRS+paro 1d/CRS+paro 7d = 35/42/37 neurons, NCRS/CRS+paro 1d/CRS+paro 7d = 4/5/5 mice). i, Pie charts illustrating spontaneous firing activity of LHb neurons under 1-day or 7-day i.p. injection of paroxetine in CRS mice (NCRS/CRS+paro 1d/CRS+paro 7d = 43/42/40 neurons, NCRS/CRS+paro 1d/CRS+paro 7d = 5/5/5 mice). Two-sided Mann-Whitney test (b and c), One way-ANOVA with Dunnett’s multiple comparisons test (e-h), two-sided Chi-square (i). Data are mean ± s.e.m. Schematic in a adapted from ref. , Elsevier. Source data
Extended Data Fig. 3
Extended Data Fig. 3. Transcriptome data indicates attenuated autophagy function in LHb neurons.
a, Single-nucleus sequencing showing neuronal and glial autophagosome formation pathway in naïve vs. CRS mice (n = 3 mice per group). b, Schematics of autophagy signaling. Genes annotated in red indicate the most altered genes listed in Panel c. c1-c18, Bar graphs showing autophagy-related mRNA expression level in LHb from naïve and CRS mice (nnaïve/CRS = 3/group). d1-d9, Quantification of qPCR experiments showing mRNA expression levels of autophagy-related genes after CRS. (nnaïve/CRS = 6/group). e, Schematics of ubiquitin signaling. f, Correlation of UBB, UBC, UBA52 and RPS27A mRNA FPKM with behavioral scores (immobile durations in FST) (n = 12 mice). g, Bar graphs showing ubiquitin-related mRNA expression level in LHb from CRS and naïve mice (nnaïve/CRS = 3/group). h,i, Quantification of mRNA levels of Kir2.1 (h) and T-VSCC (i) in the LHb of naïve and CRS mice (nnaïve/CRS = 3/group). Two-sided Gene set variation analysis (a), two-sided Unpaired t-test (c1-c18, g-i), Two-sided Mann-Whitney test (d1-d9), Pearson correlation test (f). Data are mean ± s.e.m. Source data
Extended Data Fig. 4
Extended Data Fig. 4. Autophagy levels in the brain or peripheral organ under stress or fasting conditions.
a, Experimental design. b, Representative images (left) and quantification (right) of western blot analysis showing 40-Hz phasic photostimulation at LH-LHb axonal terminals instantly decreased p62 and increased Beclin-1 levels (nmCherry/oChIEF = 4/group). c, Representative images (left) and quantification (right) of proportion of LC3 puncta positive neurons in LHb of mice treated with ARS or CRS. White circles indicate the localization of LC3 puncta signals (nnaïve/ARS/CRS = 4/3/4). d, Representative images (left) and quantification (right) of electron microscopy showing the number of autophagosomes (quantified from 15 randomly selected neurons) in LHb of mice treated with ARS or CRS. Red arrowheads indicate the location of autophagosomes. Dash lines circle the contour of a representative organelle (nnaïve/ARS/CRS = 4/3/4). e, Representative images (top) and quantification (bottom) of p62 or Beclin-1 western blot of vHippo samples from naïve, ARS or CRS mice (nnaïve/ARS/CRS = 4/4/6 for both p62 and Beclin-1). f,g, Representative images (top) and quantification (bottom) of p62 or Beclin-1 western blot of LHb (f) or liver (g) samples from naïve or 24h-fasted mice (f and g, nnaïve/fast = 4/3/4). Two-sided Unpaired t-test (c, d, and g), Two-sided Mann-Whitney test (b, e and f). Data are mean ± s.e.m. Schematic in a adapted from ref. , Elsevier. Source data
Extended Data Fig. 5
Extended Data Fig. 5. Local infusion of SBI in LHb facilitates stress susceptibility and prevents the LTD-like process naturally occurring after acute stress.
a, Experimental design. b-d, Representative traces (b) and quantification (c,d) of spontaneous excitatory neurotransmission immediately after ARS, or pre-treated with SBI or vehicle (Veh) and 1–3 days after ARS in the homecage (HC) (c and d, nnaïve/ARS/ARS+HC+Veh/ARS+HC+SBI = 39/32/43/37 neurons, 6/5/5/5 mice). e, Experimental design. f-h, Local infusion of SBI in LHb before stress facilitates depression-like phenotype in mice (f, nARS+Veh/ARS+SBI = 6/11; g, nARS+Veh/ARS+SBI = 5/8; h, nARS+Veh/ARS+SBI = 8/11). One way-ANOVA with Uncorrected Fisher’s LSD (c) or Dunnett’s multiple comparisons test (d), two-sided Unpaired t-test (f-h). Data are mean ± s.e.m. Schematic in e adapted from ref. , Elsevier. Source data
Extended Data Fig. 6
Extended Data Fig. 6. Behavioral performances in the OFT and viral expression profiles under different circumstances.
a, nnaïve/CRS+Veh/CRS+Rapa = 10/group for both OFT total distance and center time; b, nEGFP+Veh/EGFP+Rapa/Atg7+Rapa/Atg7+Veh = 9/8/8/12 for both OFT total distance and center time; c, nCRS/tBP = 9/group for both OFT total distance and center time; d, nCRS/tBP = 6/8 for both OFT total distance and center time; e, nVeh/dyngo/tBP/tBP+TAT-GluA23y/dyngo+tBP = 9/10/11/11/8 for both OFT total distance and center time; f, nmCherry/Cre = 10/11 for both OFT total distance and center time; g, ndio-mCherry/dio-hM4D = 4/5 for both OFT total distance and center time. h-k, viral expression profiles under different circumstances. One way-ANOVA with Uncorrected Fisher’s LSD (a, b and e), two-sided Unpaired t-test (c and d, f and g). Data are mean ± s.e.m. Schematics in hk adapted from ref. , Elsevier. Source data
Extended Data Fig. 7
Extended Data Fig. 7. LHb autophagy plays essential roles in antidepressant-like effects of both paroxetine and ketamine.
a, Antidepressant dosage of ketamine enhances autophagy (i.e., decreased p62 and increased Beclin-1) in LHb 24 h after i.p. injection (nCRS+Veh/CRS+Ket = 5/group). b, Experimental design. c,d, Ketamine does not affect FST and SPT scores in Atg7LHb−/− mice (c, nCre+Veh/Cre+Ket = 7/6; d, nCre+Veh/Cre+Ket = 8/6). e, Experimental design. f, Paroxetine treatment (i.p., 7 d) decreased p-Akt and p-mTOR levels in the LHb (nVeh/Paro = 5/group). g, Experimental design. h, Ketamine treatment (i.p.) decreased p-Akt and p-mTOR levels in the LHb (nVeh/Paro = 5/group). Two-sided Mann-Whitney test (a, f and h) and two-sided Unpaired t-test (c and d). Data are mean ± s.e.m. Schematic in b adapted from ref. , Elsevier; schematics in e,g adapted from ref. , Elsevier. Source data
Extended Data Fig. 8
Extended Data Fig. 8. Genetic ablating Atg7 in LHb or pharmacological enhancement of LHb autophagy does not induce neuronal apoptosis.
a,b, Western blot of cleaved caspase 3 shows that tBP treatment or knockout of Atg7 does not induce apoptosis in LHb (a, ntBP/Veh = 3/4; b, nmCherry/Cre = 3/4). c, Tunel immunostaining shows that knock-out of Atg7 in LHb does not induce neuronal apoptosis (c, nmCherry/Cre/DNase = 3/4/2; DNase as a positive control). Two-sided Mann-Whitney test for all. Data are mean ± s.e.m. Source data
Extended Data Fig. 9
Extended Data Fig. 9. Local infusion of tBP into the LHb exerts sustained and prophylactic antidepressant-like effects.
a,h, Experimental designs. b,c, tBP decreases immobile duration in FST (b, ntBP/Veh = 7/5) and increases social interaction ratio in SIT (c, ntBP/Veh = 9/5) 24 h after tBP treatment. d,e, tBP decreases immobile duration in TST (d, ntBP/Veh = 7/5) and increases sucrose preference (e, ntBP/Veh = 9/5) in SPT 7 d after tBP treatment. f,g, tBP does not affect SPT (f, ntBP/Veh = 5/4) and FST (g, ntBP/Veh = 5/4) phenotypes 18–19 d after tBP treatment. i-m, Prophylactic treatment of tBP decreases immobile duration in FST and TST (i, ntBP/Veh = 7/8; l, ntBP/Veh = 6/8), increases sucrose preference in SPT (j, ntBP/Veh = 6/7), without affecting social interaction ratio (k, ntBP/Veh = 7/group) and locomotion or anxiety-like behavior (m, ntBP/Veh = 7/8). Two-sided Mann-Whitney test (b) and Two-sided Unpaired t-test (c-g, i-m). Data are mean ± s.e.m. Schematics in a,h adapted from ref. , Elsevier. Source data
Extended Data Fig. 10
Extended Data Fig. 10. Dose and activity-dependent effect of tBP on neuronal activity.
a-c, Representative traces (a), quantification of neuronal excitability (b, nACSF/0.5/1/5 = 35/24/29/18 neurons, 3/2/2/2 mice) and rheobases (c, nACSF/0.5/1/5 = 30/31/37/23 neurons, 3/2/2/2 mice). d-g, Representative traces (d), pie charts (e) and bar graphs (f,g) showing the effects of tBP on spontaneous firing properties of LHb neurons in naïve mice (e-g, nACSF/5 = 16/21 neurons, 2/2 mice). h-j, Representative traces (h) and quantification (i,j) showing the effect of tBP incubation on spontaneous transmission in LHb neurons from naïve mice (i and j, nACSF/5 = 16/21 neurons, 2/2 mice). k,l, Representative images of Western Blot and quantification of p62 and Beclin-1 levels in the Arc (k) and BLA (l) after CRS (k and l, nnaïve/CRS = 5/group). m,n, Representative traces (m) and quantification (n, nbase/tBP = 6 neurons, 4 mice) of excitability in Arc POMC neurons treated with tBP. o,p, Representative traces (o) and quantification (p, nbase/tBP = 8 neurons, 4 mice) of sEPSCs in Arc POMC neurons treated with tBP. q,r, Representative traces (q) and quantification (r, nbase/tBP = 9 neuron, 4 mice) of excitability in BLA PNs treated with tBP. s,t, Representative traces (s) and quantification (t, nbase/tBP = 9 neurons, 4 mice) of sEPSCs in BLA PNs treated with tBP. u,v, Comparison of excitability (u, nLHb/Arc/BLA = 8/6/9 neurons, 8/4/4 mice) and sEPSCs (v, nLHb/Arc/BLA = 8/9/9 neurons, 8/4/4 mice) in LHb neurons, Arc POMC neurons and BLA PNs. Two-sided Unpaired t-test (b, n and r), Two-sided Mann-Whitney test (g, i-l), Two-sided Paired t-test (p and t), Two-sided Wilcoxon test (p), One-way ANOVA with Dunnett’s multiple comparisons test (c) or Uncorrected Fisher’s LSD (u and v), two-sided Chi-square (e) and two-sided Fisher’s exact test (f). Data are mean ± s.e.m. Source data
Extended Data Fig. 11
Extended Data Fig. 11. Autophagosomes are mostly co-localized with a post-synaptic marker PSD95 and co-labeled with GluRs in LHb.
a,b, Representative images (a) and quantification (b) showing co-localization of PSD95 and LC3 in LHb neurons of mice treated with ARS (n = 4 mice). c, Representative STORM images showing localization of GluA2 (green) and LC3 puncta (red) in LHb, Arc and BLA from ARS-treated mice. d,e, Representative immunoelectron microscopy images (d, nnaïve/ARS/CRS = 3/group) and quantification (e) showing GluA2 immunoreactivity co-localized within autophagosomes (quantified from 15 randomly selected neurons) in LHb from mice treated with ARS or CRS. One-way ANOVA with Uncorrected Fisher’s LSD (e). Data are mean ± s.e.m. Source data
Extended Data Fig. 12
Extended Data Fig. 12. tBP rapidly decreases neuronal excitability and excitatory synaptic transmission.
a-c, Representative traces (top) and quantification (bottom) showing neuronal excitability before and after tBP perfusion in LHb neurons of CRS mice (a, nACSF/tBP = 7/6 neurons, 7 mice; b, nACSF/tBP = 8/8 neurons, 6 mice; c, nACSF/tBP = 8/8 neuron, 6 mice). d,e, Representative traces (top) and quantification (bottom) showing spontaneous neural transmission before and immediately after tBP perfusion in LHb neurons of CRS mice (d, nACSF/tBP = 8/8 neurons, 7 mice for both sEPSCs and sIPSCs; e, nACSF/tBP = 9/9 neurons, 6 mice for both sEPSCs and sIPSCs). Two-sided Unpaired t-test (a-c) and Two-sided Paired t-test (d and e). Data are mean ± s.e.m. Source data
Extended Data Fig. 13
Extended Data Fig. 13. Impairment of autophagy in LHb neurons directly drives depression-like behaviors and neuronal hyperfunctions.
a, Conditional hemi knock-out of Atg7 in LHb neurons of heterozygotes fails to induce depressive-like phenotypes (nmCherry/Cre = 9/12 for FST and SPT; nmCherry/Cre = 10/12 for OFT). b, Conditional knock down of Atg7 with shRNA-Atg7 directly leads to increased immobile duration in FST and decreased sucrose preference in SPT (nEGFP/shAtg7 = 7/10 for FST and SPT). c, Experimental designs and conditional knock-down of BECN1 with shRNA-BECN1 directly leads to increased immobile duration in FST and decreased social interaction ratio in SIT (nmCherry/shBECN1 = 9/14 for FST, nmCherry/shBECN1 = 6/5 for SIT). d, Conditional knock-down of Atg5 with shRNA-Atg5 directly leads to increased immobile duration in FST, decreased sucrose preference in SPT, and decreased trends of social interaction ratio in SIT (nEGFP/shAtg5 = 7/8 for FST, nEGFP/shAtg5 = 7/group for SPT and SIT). e, Conditional knock-out of Atg7 in LHb astrocytes fails to induce depressive-like phenotypes (nEGFP/Cre = 7/6 for FST, SPT and SIT). f, Conditional knock-out of Atg7 in vHippo neurons fails to induce depressive-like phenotypes (nmCherry/Cre = 4/7 for FST, SPT and SIT). g, Pie charts illustrating the percentage of three types of LHb neurons with Atg5 knock-down and its EGFP controls (nEGFP/shAtg5 = 41/40 neurons, nEGFP/shAtg5 = 5/5 mice). h-j, Representative traces (h) and quantification (i-j) of spontaneous neurotransmission in LHb neurons with Atg5 deficiency (i, nEGFP/shAtg5 = 40/40 neurons, nEGFP/shAtg5 = 5/5 mice; j, nEGFP/shAtg5 = 39/40 neurons, nEGFP/shAtg5 = 5/5 mice). Two-sided Unpaired t-test (a-d, i and j), Two-sided Mann-Whitney test (e and f) and two-sided Chi-square (g). Data are mean ± s.e.m. Source data
Extended Data Fig. 14
Extended Data Fig. 14. Autophagy controls the occurrence and magnitude of LHb synaptic plasticity.
a, Experimental design. b,c, Representative images (left) and quantification (right) of p62 or Beclin-1 western blot showing LTD induction protocol instantly enhances autophagy level in LHb of naïve mice (i.e., decreased p62 and increased Beclin-1 (b, nmCherry/oChIEF = 3/group for p62, nmCherry/oChIEF = 4/group for Beclin-1) but not CRS mice (c, nmCherry/oChIEF = 3/group for p62, nmCherry/oChIEF = 4/group for Beclin-1). d, LFS fails to induce LTD in the LHb of CRS mice (nnaïve = 9 neurons, 7 mice; nCRS = 11 neurons, 7 mice). e, SBI abolishes the LTD induction and induces a slight but significant LTP in LHb neurons (n = 7 neurons, 6 mice). f, Schematics of stereotaxic surgeries. g, Conditional knock-out of Atg7 abolishes LTD in LHb neurons (nAtg7+/+ = 11 neurons, 6 mice; nAtg7−/− = 10 neurons, 7 mice). h, Kinetics and representative traces showing conditional knock-out of Atg7 increases the LTP magnitude in LHb neurons (nAtg7+/+ = 8 neurons, 3 mice; nAtg7−/− = 10 neurons, 8 mice). i, tBP, but not tBP-scm, directly induces dose-dependent pharmacological LTD in the LHb of CRS mice (1 μΜ tBP, n = 10 neurons, 8 mice; 5 μΜ tBP, n = 11 neurons, 7 mice; 1 μΜ tBP-scm, n = 10 neurons, 7 mice). j, TAT-GluA23Y peptide, but not its scrambled analog (TAT-GluA23Y-scm), disrupts the tBP-induced LTD in the LHb of CRS mice (TAT-GluA23Y, n = 9 neurons, 6 mice; TAT-GluA23Y-scm, n = 9 neurons, 7 mice). k, tBP fails to induce LTD in the LHb of Atg7LHb−/− mice (n = 11 neurons, 7 mice). Two-sided Unpaired t-test for all. Data are mean ± s.e.m. Schematics in a,f adapted from ref. , Elsevier. Source data
Extended Data Fig. 15
Extended Data Fig. 15. Hypothesized model.
LHb autophagy is switched on rapidly in an energy-dependent manner (within minutes) via AMPK phosphorylation, acting as the “alarm reaction” phase of stress. As stress exposure persists, excitatory afferents onto LHb are gradually potentiated, and LHb autophagy may be constantly recruited for degrading excessive synaptic GluRs, resulting in the “resistance” phase. During the late phase of chronic stress, LHb autophagy is suppressed by the over-activation of mTOR signaling. Consequently, LHb autophagy is incapable of counterbalancing the excessive synaptic weight through GluRs degradation, therefore slowing down towards GluRs endocytosis and causing the “exhaustion” phase of stress, neuronal hyperactivity and depression-like phenotypes. Adapted from ref. , Elsevier.

References

    1. McEwen, B. S. et al. Mechanisms of stress in the brain. Nat. Neurosci.18, 1353–1363 (2015). - PMC - PubMed
    1. Griffey, C. J. & Yamamoto, A. Macroautophagy in CNS health and disease. Nat. Rev. Neurosci.23, 411–427 (2022). - PMC - PubMed
    1. Herrman, H. et al. Time for united action on depression: a Lancet–World Psychiatric Association Commission. Lancet399, 957–1022 (2022). - PubMed
    1. Soykan, T., Haucke, V. & Kuijpers, M. Mechanism of synaptic protein turnover and its regulation by neuronal activity. Curr. Opin. Neurobiol.69, 76–83 (2021). - PubMed
    1. Levine, B. & Kroemer, G. Biological functions of autophagy genes: a disease perspective. Cell176, 11–42 (2019). - PMC - PubMed

MeSH terms

Substances