. 2025 Jun;642(8067):501-507.
doi: 10.1038/s41586-025-08856-9. Epub 2025 Apr 9.

Small molecules restore mutant mitochondrial DNA polymerase activity

Affiliations

Small molecules restore mutant mitochondrial DNA polymerase activity

Sebastian Valenzuela et al. Nature. 2025 Jun.

Abstract

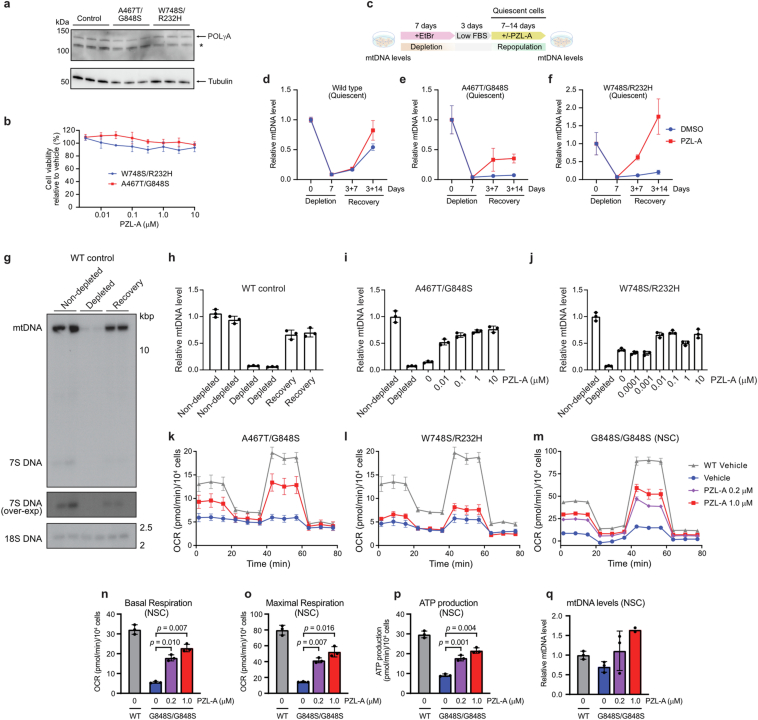
Mammalian mitochondrial DNA (mtDNA) is replicated by DNA polymerase γ (POLγ), a heterotrimeric complex consisting of a catalytic POLγA subunit and two accessory POLγB subunits1. More than 300 mutations in POLG, the gene encoding the catalytic subunit, have been linked to severe, progressive conditions with high rates of morbidity and mortality, for which no treatment exists2. Here we report on the discovery and characterization of PZL-A, a first-in-class small-molecule activator of mtDNA synthesis that is capable of restoring function to the most common mutant variants of POLγ. PZL-A binds to an allosteric site at the interface between the catalytic POLγA subunit and the proximal POLγB subunit, a region that is unaffected by nearly all disease-causing mutations. The compound restores wild-type-like activity to mutant forms of POLγ in vitro and activates mtDNA synthesis in cells from paediatric patients with lethal POLG disease, thereby enhancing biogenesis of the oxidative phosphorylation machinery and cellular respiration. Our work demonstrates that a small molecule can restore function to mutant DNA polymerases, offering a promising avenue for treating POLG disorders and other severe conditions linked to depletion of mtDNA.


Conflict of interest statement

Competing interests: M.F., C.M.G., G.M.B. and N.-G.L. are co-founders of Pretzel Therapeutics. M.F., C.M.G., B.M., X.Z. and N.-G.L. are shareholders of Pretzel Therapeutics and have received consulting fees. S.V. has received consulting fees from Pretzel Therapeutics. M.S., C.G., A.V.G., J.M.F., Y.S., S.J.K., L.A., G.M.B., S.E., C.P.-H., T.A.K., B.K.-M., C.P., J.E.J., X.X. and S.G. are full-time employees of Pretzel Therapeutics and may hold stock or stock options as part of their compensation. V.P. is a former employee of Pretzel Therapeutics. P.S.C., A.M.G., G.K. and J.G. are consultants for Pretzel Therapeutics and hold stock or stock options as part of their compensation. The other authors declare no competing interests.

Figures

Fig. 1
Fig. 1. PZL-A activates mutant POLγ.
a, Chemical structure of compound 1, a high-throughput screening hit, and PZL-A, a more potent compound produced by a medicinal chemistry optimization effort. AC50 values are shown for two POLγ mutants and wild-type. b, Schematic representation of the primer-elongation assay used for hit-to-lead optimization of POLγ activators. A short 20-nucleotide (nt) primer was annealed to circular, single-stranded M13mp18 DNA, providing a preexisting 3′-OH group from which POLγ could initiate DNA synthesis. POLγ activity was followed by monitoring the increase of SYBR Green fluorescence over time as the dye bound to newly formed dsDNA. Drawing by Jennifer Uhler (copyright holder). c, Increasing concentrations of PZL-A activate the indicated mutant POLγ variants in a dose-dependent manner (mean ± s.d.; n = 3 independent experiments). d, Steady-state kinetics of dNMP incorporation (mean ± s.d.; WT: n = 4; mutants: n = 3 independent experiments). Rates were determined by dividing the initial incorporation rates by the concentration of active enzyme–DNA complex (Extended Data Fig. 1b). PZL-A enhances catalytic efficiency in all four mutants. e, Representative plots of differential scanning fluorimetry performed with POLγA mutants (R232H, A467T, W748S and G848S) in complex with POLγB, in the absence or presence of 10 μM PZL-A. Values are presented as normalized fluorescence (Fnorm) in arbitrary units (a.u.). The presence of PZL-A induces a shift in melting temperature in all four POLγA mutants and is given as ΔTm (mean ± s.d.; n = 3 independent experiments). For source data of blots in d, see Supplementary Figs. 1 and 2. Source Data
Fig. 2
Fig. 2. PZL-A binds at the interface between POLγA and POLγB.
a, Overview of overlaid POLγ(A467T) (blue), POLγ(G848S) (pink) and wild-type POLγ (green) heterotrimeric structures. b, Close-up of A467, A467T and nearby residues. c, Close-up of G848, G848S, DNA and nearby residues. The base pairs in the DNA template strand are numbered according to their proximity to the nucleotide insertion site (n). The introduced serine forms a hydrogen bond (dashed line) with the backbone carbonyl of V845. d, Close-up of the polymerization site while stalled during elongation. The incoming dCTP base pairs with the template strand at the nucleotide insertion site (n). e, Cartoon representation of the cryo-EM structure of PZL-A bound to POLγ(G848S). The binding pocket is highlighted with the cryo-EM density for PZL-A (cyan). PZL-A binds POLγ in a pocket at the interface between POLγA and the proximal POLγB subunit. f, Close-up of PZL-A and its cryo-EM density in the binding pocket. g, The structures of G848S-PZL-A (colours as in e,f) and A467T-PZL-A (grey) superimposed on wild-type POLγ (green). PZL-A forms a hydrogen bond with POLγA (G588, 2.7 Å) and an intramolecular hydrogen bond between the urea and pyrazole groups (2.7–2.8 Å). h, G848S (pink) and G848S-PZL-A (light purple) structures overlaid on the wild-type POLγ (green) structure at the mutation site. The secondary structure is not affected by the mutation or PZL-A. i, Superimposition of the G848S (pink) and G848S-PZL-A (light purple) structures at the binding site of PZL-A. Minor positional changes of nearby residues can be observed upon binding of PZL-A, and the directions of these adjustments are shown with arrows.
Fig. 3
Fig. 3. PZL-A increases processivity of mutant POLγ and restores mitochondrial replisome function.
a, Mutant POLγ variants and mtSSB were incubated with a primed, single-stranded DNA (ssDNA) template at 37 °C. Samples were taken at the indicated time points and analysed on a 0.8% native agarose gel. The positions of the full-length (FL) product and the radiolabelled primer template (T) are indicated. Primers may dissociate from the circular ssDNA during electrophoresis, explaining the lower signals in the template control lanes (−). Representative gels are shown (n = 3 independent experiments). b, Schematic representation of the processivity assay. Heparin is used to trap free POLγ, preventing dissociated enzyme from rebinding to the template to continue DNA synthesis. c, Mutant forms of POLγ have impaired processivity compared with wild-type. Processivity is restored in the presence of PZL-A. The products were separated on an 8% urea-PAGE sequencing gel. The positions of products (P) and the radiolabelled template (T) are indicated. Representative gels are shown (n = 3 independent experiments). d, Schematic representation of the rolling-circle assay used to investigate the effects of PZL-A on replisome function on a dsDNA template. e, Time-course experiments as outlined in d demonstrate that PZL-A activates mutant POLγ variants during Twinkle DNA helicase-dependent rolling-circle DNA replication. DNA synthesis was monitored by the incorporation of radiolabelled nucleotides and the resulting products of increasing length were separated on a 0.8% alkaline agarose gel (quantified in Extended Data Fig. 8f). Representative gels are shown (n = 3 independent experiments). For source data of gels in a,c,e, see Supplementary Figs. 4–7. Drawings in b,d by Jennifer Uhler (copyright holder).
Fig. 4
Fig. 4. PZL-A stimulates mtDNA synthesis and OXPHOS activity in patient cells.
a, Schematic illustration of the mtDNA depletion and recovery experiment. Drawing by Jennifer Uhler (copyright holder). bd, mtDNA depletion and repopulation in wild-type (b), POLGA467T/G848S (c) and POLGW748S/R232H fibroblasts treated with 50 ng ml−1 EtBr for 4 days. PZL-A and vehicle were added after EtBr removal. mtDNA was quantified at the indicated time points (mean ± s.d.; n = 3 biological replicates). e, Dose-dependent recovery of mtDNA in POLGA467T/G848S mutant cells after 7 days of EtBr treatments (50 ng ml−1), followed by recovery for 10 days. PZL-A was added at the indicated concentrations after removal of EtBr. Southern blot analysis after BamHI digestion was used to detect mtDNA and 7S DNA. Nuclear 18S rDNA was used as a loading control. f, As in e, but with POLGW748S/R232H mutant cells, 4 days of EtBr treatments and recovery for 5 days. g, PZL-A (1 μM) stimulates mtDNA synthesis in intact mitochondria isolated from patient-derived fibroblasts. DNA synthesis was monitored by incorporation of radiolabelled dCTP. VDAC was used as a loading control. h, Immunoblot analysis of OXPHOS complex subunits in mutant fibroblasts after 7 days recovery. PZL-A (1 μM) increased NDUFB8 (complex I (CI)), UQCRC2 (complex III (CIII)) and COXI (complex IV (CIV)) levels, whereas SDHB (complex II (CII)) and ATP5A (complex V (CV)) remained unchanged. Tubulin was used as a loading control. ik, Mitochondrial respiration in fibroblast cells treated as in a. A Seahorse XFe96 pro extracellular flux analyser was used to measure basal respiration (i), maximal respiration (j) and ATP production (k) after 7 days of recovery. Data are mean ± s.d. (n = 3 biological replicates). Unpaired two-tailed Welch’s t-tests were used to determine P values. Blots in eh are representative of n = 2 independent experiments. For source data of gels and blots in eh, see Supplementary Fig. 8. Source Data
Extended Data Fig. 1
Extended Data Fig. 1. Effects of PZL-A on mutant POLγ activities.
a, PZL-A (1 μM) stimulates DNA synthesis in indicated mutant POLγ variants across a broad range of dNTP concentrations. Mutant POLγ variants and mtSSB were incubated with a primed, single-stranded DNA template at 37 °C. Samples were taken at the indicated time points and analyzed on a 0.8% native agarose gel. The positions of the full-length (FL) product and the radiolabelled primer template (T) are indicated. Primers may dissociate from the circular ssDNA during electrophoresis, explaining the lower signals in the template control lanes (-). Representative gels are shown (n = 2 independent experiments). b, EMSA (electrophoretic mobility shift assay) was used to determine the concentration of active POLγ holoenzyme–DNA complex (active enzyme) under the conditions used in the kinetic experiments (Fig. 1d). The fraction of template-bound POLγ holoenzyme was calculated relative to the unbound template. The concentration was calculated by multiplying the fraction active enzyme by 0.5 nM (maximum theoretical enzyme–DNA complex concentration). Data are presented as the mean ± s.d. (n = 3 independent experiments). c, Schematic representation of the exonuclease assay used to investigate effects of PZL-A on the exonuclease activity of POLγ. Drawing by Jennifer Uhler (copyright holder). d, Time-course experiments reveal that wild-type POLγ efficiently removes a mismatch at the 3′-end, whereas an exonuclease-deficient, mutant POLγ variant (D274A) is unable to remove the mismatch. POLγ was incubated with the mismatch-template at 37 °C in the absence of dNTPs for times indicated. The products were separated on a 10% urea-PAGE sequencing gel. The positions of products (P) and the radiolabelled mismatch template (T) are indicated. The fraction of short oligonucleotides (shorter than the 19-mer) was quantified and plotted versus time to visualize the DNA degradation. Data are presented as the mean ± s.d. (n = 3 independent experiments). e–f, Time-course experiments demonstrate that PZL-A (1 μM) has no observable negative effect on the exonuclease activity of mutant POLγ variants tested. The experiments were performed as in d. Data are presented as the mean ± s.d. (n = 3 independent experiments). For gel source data (a, b, df), see Supplementary Figs. 9–13. Source Data
Extended Data Fig. 2
Extended Data Fig. 2. Cryo-EM data processing of the G848S-PZL-A and G848S datasets.
a, Cryo-EM processing workflow in cryoSPARC for G848S-PZL-A, with representative images of micrographs and 2D classification averages. b, FSC resolution at 0.143 GSFSC threshold as reported by cryoSPARC for the G848S-PZL-A map. c, Orientation distribution plot. d, Local resolution estimation calculated by cryoSPARC (FSC threshold = 0.5). The position of PZL-A is indicated by the red box. e, Cryo-EM processing workflow in cryoSPARC for G848S, with representative images of micrographs and 2D classification averages. f, FSC resolution at 0.143 GSFSC threshold as reported by cryoSPARC for the G848S map. g, Orientation distribution plot. h, Local resolution estimation calculated by cryoSPARC (FSC threshold = 0.5).
Extended Data Fig. 3
Extended Data Fig. 3. Cryo-EM data processing of the A467T-PZL-A and A467T datasets.
a, Cryo-EM processing workflow in cryoSPARC for A467T-PZL-A, with representative images of micrographs and 2D classification averages. b, FSC resolution at the 0.143 GSFSC threshold as reported by cryoSPARC for the A467T-PZL-A map. c, Orientation distribution plot. d, Local resolution estimation calculated by cryoSPARC (FSC threshold = 0.5). The position of PZL-A is indicated with the red box. e, Cryo-EM processing workflow in cryoSPARC for A467T, with representative images of micrographs and 2D classification averages. f, FSC resolution at the 0.143 GSFSC threshold as reported by cryoSPARC for the A467T map. g, Orientation distribution plot. h, Local resolution estimation calculated by cryoSPARC (FSC threshold = 0.5).
Extended Data Fig. 4
Extended Data Fig. 4. Cryo-EM data processing of the wild-type POLγ dataset.
a, Cryo-EM processing workflow in cryoSPARC for wild-type POLγ, with representative images of micrographs and 2D classification averages. b, FSC resolution at the 0.143 GSFSC threshold as reported by cryoSPARC for the wild-type POLγ map. c, Orientation distribution plot. d, Local resolution estimation calculated by cryoSPARC (FSC threshold = 0.5).
Extended Data Fig. 5
Extended Data Fig. 5. Structure of A467T in complex with PZL-A.
a, Cartoon representation of the cryo-EM structure of A467T bound to PZL-A. The binding pocket is highlighted with the cryo-EM density for PZL-A (cyan). PZL-A binds POLγ in a pocket at the interface between POLγA and the proximal POLγB subunit. b, Close-up of PZL-A and its cryo-EM density in the binding pocket. c, PZL-A binds approximately 9.2 Å from the A467T residue, which resides in one of the thumb helices. d, A467T (blue) and A467T-PZL-A (grey) structures overlaid on the wild-type POLγ (green) structure at the mutation location. Potential hydrogen bonds are shown as dashed lines. e, Superimposition of the A467T (blue) and A467T-PZL-A (grey) structures at the binding site of PZL-A. Minor positional changes of nearby residues can be observed upon binding of PZL-A, and the directions of these adjustments are shown with arrows. A467T is not affected by PZL-A binding.
Extended Data Fig. 6
Extended Data Fig. 6. Structural comparison of the PZL-A binding pocket in wild-type and mutant POLγ.
a, Overview of overlaid A467T-PZL-A (grey), G848S-PZL-A (purple), and wild-type POLγ (green) structures. b, Close-up of the PZL-A binding pocket in the overlaid structures. Sidechains are shown as sticks and labelled in black (POLγA) or brown (POLγB). c, Close-up of the empty PZL-A binding pocket in the A467T (blue), G848S (pink), and wild-type POLγ (green) apo-structures. Sidechains are shown as sticks and labelled in black (POLγA) or brown (POLγB).
Extended Data Fig. 7
Extended Data Fig. 7. Mutagenesis of the PZL-A binding pocket.
a, PZL-A in the binding site in the G848S-PZL-A structure, with sidechains from nearby residues displayed as sticks. The protein surface surrounding the compound is coloured by hydrophobicity potential (calculated in UCSF ChimeraX). The binding site is mainly a hydrophobic pocket, with PZL-A wedged between hydrophobic residues from both POLγA (light purple) and POLγB (beige). However, a small hydrophilic patch is located near the polar urea carbonyl group and the chromane oxygen in PZL-A. b, Three residues in POLγA (L566, H569 and W585) are in close proximity to PZL-A and interacts with different parts of the compound. Cryo-EM densities for PZL-A (blue) and the residues (purple) are shown. c, Representative plots of differential scanning fluorimetry performed with POLγA variants in complex with POLγB, in the absence or presence of 10 μM PZL-A. Residues in close proximity to PZL-A (see b) were replaced with alanine (L566A, H569A and W585A). Values are presented as normalized fluorescence (Fnorm) in arbitrary units (A.U.). The difference in melting temperature, ΔTm (mean ± s.d., n = 3 independent experiments) is given. d, Representative plots of differential scanning fluorimetry performed with wild-type POLγA, wild-type POLγB, and the wild-type POLγ complex, in the absence or presence of 10 μM PZL-A. Values are presented as normalized fluorescence (Fnorm) in arbitrary units (A.U.). The difference in melting temperature, ΔTm (mean ± s.d., n = 3 independent experiments) is given. For the wild-type POLγ complex, ΔTm is given for the POLγA subunit. Source Data
Extended Data Fig. 8
Extended Data Fig. 8. PZL-A stabilizes mutant POLγ interactions with the template during active DNA synthesis.
a, Formation of stalled elongation complexes was analysed by EMSA in the absence or presence of PZL-A. Complex formation was plotted against POLγ concentrations, and the binding curves were fitted to a quadratic equation for tight-binding to determine the dissociation constants (Kd). Presented data are the mean ± s.d. (n = 3 independent experiments). b, Summary of the determined dissociation constants, Kd (nM) from experiments in a. Presented data are the mean ± s.e.m. (n = 3 independent experiments). c, Schematic representation of the competition experiment used to evaluate DNA binding of idling POLγ. The indicated POLγ variants were incubated with a radiolabelled template at room temperature in the presence of dCTP and dGTP. A 50-fold excess of unlabelled competitor template was added, and the reactions were incubated at 37 °C for the indicated times. Samples were separated using 4% native-PAGE, and the fraction of the formed complex was quantified and plotted against time to determine the dissociation rate constant. Drawing by Jennifer Uhler (copyright holder). d, The percentage of labeled DNA bound to POLγ during idling was plotted versus time (minutes after addition of unlabeled DNA) and the data were fit to an exponential dissociation model to determine the dissociation rate constant, koff. The fit to the wild-type data (dashed line) was added to the mutant plots for comparison. Data points are mean ± s.d. (n = 3 independent experiments). e, Summary of the determined dissociation rate constants, koff (min−1) from experiments described in c,d. Presented data are the mean ± s.e.m. (n = 3 independent experiments). f, Quantification of the rolling circle assay in Fig. 3e. Data are presented as replication products relative to WT (15 min time point). The values from three timepoints (15, 30 and 60 min) were plotted for each mutant ± PZL-A as well as wild-type. Data presented are mean ± s.d., n = 3 (mutants) or n = 6 (wild-type) independent experiments. For gel source data (a, b, d, e), see Supplementary Figs. 14–16. Source Data
Extended Data Fig. 9
Extended Data Fig. 9. PZL-A stimulates mtDNA synthesis and ATP production.
a, Immunoblot analysis of POLγA in control and mutant fibroblasts. Tubulin was used as a loading control. * indicates a non-specific band. Representative blot is shown (n = 2 independent experiments). b, Cell viability of A467T/G848S, W748S/R232H fibroblasts after PZL-A treatment for 5 days at indicated concentrations relative to vehicle treatment (mean ± s.d., n = 3 biological replicates). c, Schematic illustration of the mtDNA depletion and recovery experiment in quiescent cells. Drawing by Jennifer Uhler (copyright holder). d–f, Depletion of mtDNA followed by repopulation in quiescent fibroblasts (wild-type or indicated mutant cells) after 7 days of treatment with 50 ng/ml EtBr. After 7 days of EtBr treatment, the cells reached confluence and FBS was reduced to 0.1% to induce quiescence. PZL-A and vehicle treatment were started after removal of EtBr and DNA samples were analyzed at the indicated time points (mean ± s.d., n = 3 biological replicates). g, The mtDNA levels in wild-type fibroblasts after EtBr depletion (50 ng/ml) for 7 days, followed by recovery for 10 days. Southern blot analysis after BamHI digestion was used to detect mtDNA and 7S DNA. Nuclear 18S rDNA is used as a loading control. h–j, Relative mtDNA levels were assessed with real-time quantitative PCR (qPCR). Samples analyzed correspond to those presented in Extended Data Fig. 9g and Fig. 4e,f respectively. (mean ± s.d., n = 3 technical replicates). k–l, Bioenergetic profiles of 1 μM PZL-A or vehicle treated mutant and wild-type fibroblasts were measured by Seahorse XFe96 pro extracellular flux analyzer and used to calculate parameters reported in Fig. 4i–k (mean ± s. e.m. n = 3 biological replicates). m, Bioenergetic profiles of 0.2 and 1 μM PZL-A or vehicle treated G848S/G848S mutant and PGP-1 wild-type NSCs were measured by Seahorse XFe96 pro extracellular flux analyzer (mean ± s.e.m. n = 3 biological replicates). n–p, Mitochondrial respiration changes in G848S/G848S mutant and wild-type NSCs treated with PZL-A or vehicle. A Seahorse XFe96 pro extracellular flux analyzer was used to analyze basal respiration, maximal respiration, and ATP production. The cells were treated for 10 days before transferring to Seahorse XFe96 Pro plates. Data presented are the mean ± s.d. (n = 3 biological replicates). Welch and Brown-Forsythe one-way ANOVA was used determine all p-values. q, Relative mtDNA levels were assessed in G848S/G848S mutant and wild-type NSCs treated with PZL-A or vehicle (mean ± s.d., n = 3 biological replicates except n = 2 in 1 μM PZL-A treatments). Samples analyzed correspond to those presented in mp. For gel source data (a, g), see Supplementary Fig. 17. Source Data

References

    1. Falkenberg, M., Larsson, N. G. & Gustafsson, C. M. Replication and transcription of human mitochondrial DNA. Annu. Rev. Biochem.93, 47–77 (2024). - PubMed
    1. Rahman, S. & Copeland, W. C. POLG-related disorders and their neurological manifestations. Nat. Rev. Neurol.15, 40–52 (2019). - PMC - PubMed
    1. Suomalainen, A. & Nunnari, J. Mitochondria at the crossroads of health and disease. Cell187, 2601–2627 (2024). - PubMed
    1. Taylor, R. W. & Turnbull, D. M. Mitochondrial DNA mutations in human disease. Nat. Rev. Genet.6, 389–402 (2005). - PMC - PubMed
    1. Gorman, G. S. et al. Mitochondrial diseases. Nat. Rev. Dis. Primers2, 16080 (2016). - PubMed

MeSH terms

LinkOut - more resources