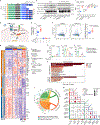
. 2025 May;641(8063):718-731.
doi: 10.1038/s41586-025-08852-z. Epub 2025 Apr 9.

Immune checkpoint TIM-3 regulates microglia and Alzheimer's disease

Affiliations

Immune checkpoint TIM-3 regulates microglia and Alzheimer's disease

Kimitoshi Kimura et al. Nature. 2025 May.

Abstract

Microglia are the resident immune cells in the brain and have pivotal roles in neurodevelopment and neuroinflammation1,2. This study investigates the function of the immune-checkpoint molecule TIM-3 (encoded by HAVCR2) in microglia. TIM-3 was recently identified as a genetic risk factor for late-onset Alzheimer's disease3, and it can induce T cell exhaustion4. However, its specific function in brain microglia remains unclear. We demonstrate in mouse models that TGFβ signalling induces TIM-3 expression in microglia. In turn, TIM-3 interacts with SMAD2 and TGFBR2 through its carboxy-terminal tail, which enhances TGFβ signalling by promoting TGFBR-mediated SMAD2 phosphorylation, and this process maintains microglial homeostasis. Genetic deletion of Havcr2 in microglia leads to increased phagocytic activity and a gene-expression profile consistent with the neurodegenerative microglial phenotype (MGnD), also referred to as disease-associated microglia (DAM). Furthermore, microglia-targeted deletion of Havcr2 ameliorates cognitive impairment and reduces amyloid-β pathology in 5×FAD mice (a transgenic model of Alzheimer's disease). Single-nucleus RNA sequencing revealed a subpopulation of MGnD microglia in Havcr2-deficient 5×FAD mice characterized by increased pro-phagocytic and anti-inflammatory gene expression alongside reduced pro-inflammatory gene expression. These transcriptomic changes were corroborated by single-cell RNA sequencing data across most microglial clusters in Havcr2-deficient 5×FAD mice. Our findings reveal that TIM-3 mediates microglia homeostasis through TGFβ signalling and highlight the therapeutic potential of targeting microglial TIM-3 in Alzheimer's disease.


Conflict of interest statement

Competing interests: G.J.F. has equity in Nextpoint, iTeos, IgM, Invaria, GV20, Bioentre and Geode. G.J.F. has served on advisory boards for iTeos, NextPoint, IgM, GV20, IOME, Bioentre, Santa Ana Bio, Simcere of America and Geode. G.J.F.’s interests were reviewed and managed by the Dana-Farber Cancer Institute in accordance with their conflict-of-interest policies. D.J.S. is a director of Prothena Biosciences and an ad hoc consultant to Roche and Eisai. M.B.-J. is a co-founder and consultant for Savanna Biotherapeutics (formally NovoGlia). A.R. is a cofounder and equity holder of Celsius Therapeutics, an equity holder in Immunitas and was a scientific advisory board member of ThermoFisher Scientific, Syros Pharmaceuticals, Neogene Therapeutics and Asimov until 31 July 2020. From 1 August 2020, A.R. is an employee of Genentech and has equity in Roche. M.L.S. is an equity holder, scientific cofounder and advisory board member of Immunity Therapeutics. O.B. is a cofounder of and has an ownership interest in Glial Therapeutics and Gliax. O.B. has a financial interest in Glial Therapeutics, a company developing a new therapy to target ITGB8–TGFβ signalling as a treatment for AD. O.B.’s interests were reviewed and are managed by Brigham and Women’s Hospital and Mass General Brigham in accordance with their conflict-of-interest policies and include collaboration with GSK and Regulus Therapeutics, receiving research funding from Sanofi and GSK, and honoraria for lectures and consultancy from UCB, Camp4 and Ono Pharma USA. V.K.K. has an ownership interest in Tizona Therapeutics, Trishula, Celsius Therapeutics, Bicara Therapeutics, Larkspur Therapeutics and Werewolf Therapeutics. V.K.K. has financial interests in Biocon Biologic, Compass, Elpiscience Biopharmaceutical, Equilium, PerkinElmer and Syngene. V.K.K. is a member of SABs for Cell Signaling Technology, Elpiscience Biopharmaceutical, Larkspur, Tizona Therapeutics, Tr1X and Werewolf. V.K.K.’s interests were reviewed and managed by Mass General Brigham in accordance with their conflict-of-interest policies.

Figures
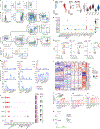
Extended Data Fig. 1 |
Extended Data Fig. 1 |. Havcr2 is highly expressed by microglia and induced by TGFβ.
a, Representative gating strategy for microglia. b, Representative gating strategy for immune cells in the spleen. c, Representative gating strategy for HEK293 cells transfected with Havcr2 constructs. d, Immune checkpoint genes were quantified by RT-qPCR in microglia in the brain (live CD45intCD11b+), and peripheral immune cells in the spleen (n = 3/condition, independent mice). e, The expression of immune checkpoint genes, including Havcr2, Lag3, and Vsir, is shown in mouse microglia and other cell populations in the central and peripheral nervous system using a public scRNAseq dataset. f, The previous dataset was reanalyzed to detect a dissociation signature in microglia and perivascular macrophages. Unsupervised clustering divided microglia into 3 populations (MGL1, 2, and 3). Though genes induced by tissue dissociation were highly expressed in two of the three mouse microglial clusters, Havcr2, Lag3, and Vsir showed high and specific expression in microglia (e). g, The expression of immune checkpoint genes and TGFβ pathway-related genes is shown in human microglia and other cell populations in the brain. h, Immune checkpoint receptor expression on microglia was analyzed by flow cytometry during the early postnatal period (n = 9, 3, 5 for day 7, 13, 20, respectively, independent mice). i, Developmental alterations of MGnD and homeostasis-associated genes in microglia were analyzed using a published dataset. MGnD and homeostasis-associated genes include the top 10 DEGs in Clec7a+ plaque-associated microglia and several selected genes. j, Primary microglia (live CD45intCD11b+) were cultured with either TGFβ (2, 10, or 50 ng/mL), M-CSF (10 ng/mL), GM-CSF (10 ng/mL), IL-27 (10 ng/mL), or LPS (10 ng/mL) for 24 h. RT-qPCR quantified the immune checkpoint gene expression (n = 3/condition, independent samples). k, TPM value of Havcr2 in the RNAseq analysis of sorted microglia (live CD45intCD11b+) from one-month-old Havcr2cKO mice (n = 4 (3 males, 1 female)), and Havcr2flox/flox mice (n = 5 (4 males, 1 female)). Avg Expr, average expression; Pct Expr, percent expressed; MGL, microglia; PVM, perivascular macrophage. Results are shown from one experiment, representing at least two independent experiments for h. Data are mean ± s.e.m. One-way ANOVA with Dunnett’s multiple comparisons test.
Extended Data Fig. 2 |
Extended Data Fig. 2 |. TGFβ pathway-related genes are not altered in Havcr2cKO microglia.
a, The structure of Dox-inducible (Tet-on system) Flag-conjugated HAVCR2 plasmid, which was used for CoIP-MS screening for binding partners of Tim-3. b, Tim-3 expression was evaluated by western blot in Jurkat cells transduced with Dox-inducible Flag-conjugated HAVCR2, after treatment with Dox. Supernatant samples were from the supernatant solution after incubation of input cell lysate with anti-Flag antibody-conjugated dynabeads. c, d, Proximity ligation assay for Tim-3, Smad2, and Tgfbr2 in primary microglia from the brain (c) and the spinal cord (d) of WT mice. e, pSmad2, Smad2, and Gapdh were quantified in Havcr2KO primary microglia by western blotting. The samples for the control Gapdh were run on a separate gel as sample processing controls (Supplementary Fig. 1 for gel source data). f, pSmad3 and Smad3 expression was quantified in Havcr2cKO microglia by flow cytometry (n = 5 control, 4 Havcr2cKO, independent mice). g, Microglia (live CD45intCD11b+) were sorted from control and Havcr2cKO male mice and cultured in the presence of M-CSF (10 ng/mL), GM-CSF (10 ng/mL), or TGFβ (10 ng/mL) for 16 h. TGFβ pathway-related gene expressions were quantified by RT-qPCR (n = 3/condition, 2 for Havcr2cKO-GM-CSF group, independent samples. h, HEK293 cells were transfected with WT-Havcr2 plasmid. Smad3 and pSmad3 expression was quantified by flow cytometry (n = 4/condition, independent samples). i, Tgfbr2KO BV2 cells were stimulated with TGFβ, and evaluated for pSmad2 expression by flow cytometry. j, Smad2 was quantified in HEK293 cells by flow cytometry after transfection with WT and mutant Havcr2 constructs (n = 3/condition, independent samples). k, HEK293 cells were transfected with WT-Havcr2 plasmid and either non-phosphorylated Smad2 mimetic (3SA) or phosphorylated Smad2 mimetic (2 SD) plasmid. The cell lysate was coimmunoprecipitated for HA-Tim-3 and blotted for Smad2 mimetics. The samples for the control β actin were run on the same gel as loading controls (Supplementary Fig. 1 for gel source data) l, Microglia (live CD45intCD11b+) were sorted and cultured in the presence of Galectin 9 (3 ug/mL), or CEACAM1 (3 ug/mL), combined with TGFβ (1 ng/mL) for 16 h. pSmad2 expression was quantified by flow cytometry (n = 3/condition, independent samples). m, HEK293 cells were transfected with WT-Havcr2 plasmid and either one of three plasmids with major Smad2 domains: MH1 (Amino acid sequences (AA) 1–181), and MH2 (AA 274–467). The cell lysate was co-immunoprecipitated for HA-Tim-3 and blotted for Smad2 domains. The samples for the control β actin were run on the same gel as sample processing controls (Supplementary Fig. 1 for gel source data). Dox, doxycycline; Sup, supernatant; CoIP, coimmunoprecipitation; MS, mass spectrometry. Results are shown from one experiment, representing at least two independent experiments for h-m. Data are mean ± s.e.m.
Extended Data Fig. 3 |
Extended Data Fig. 3 |. Havcr2cKO microglia share gene expression signature with Tgfbr2cKO microglia, phagocytosing microglia, and MGnD.
a, Circos plot comparison of DEGs up- and down-regulated in Havcr2cKO, phagocytosing, Tgfbr2cKO, and Clec7a+ microglia compared to control microglia. Only islands with DEGs shared by at least 3 of the 4 comparisons were included. Permutation test p-values were displayed as ns P > 0.025, *P ≤ 0.025, **P ≤ 0.01, ***P ≤ 0.001, ****P ≤ 0.0001, and *****P ≤ 0.00001. b, Heatmap visualization of DEGs shared by at least 3 of the 4 comparisons. c, Heatmap representation of the correlation between vectors of the gene expression levels of all DEGs of (1) Havcr2cKO microglia compared to control microglia, and those shared by comparison (2) to (4) (phagocytosing, Tgfbr2cKO, Clec7a+ microglia compared to their corresponding control groups).
Extended Data Fig. 4 |
Extended Data Fig. 4 |. Aβ plaque load is not reduced in Havcr2icKO:5xFAD mice at five months.
a, Tim-3 expression was quantified in microglia and infiltrating monocytes by flow cytometry at 4 and 7 months (n = 19, 13, 14, 20 (4 M), 8, 9, 9, and 6 (7 M), from the left). b, Tim-3 expression was quantified in macrophages and Ly6Chigh and Ly6Clow monocytes in the spleen by flow cytometry at 7 months (n = 9, 8, 3, and 10, from the left). c, Havcr2 gene expression was quantified in microglia from 5xFAD and Havcr2icKO:5xFAD mice at the age of 4 and 7 months by qPCR (n = 16, 13, 14, 20 (4 M), 5, 13, 14, and 14 (7 M), from the left). d, Locomotor activity measures (including total arm entries, distance moved, movement duration, and velocity) were assessed by spontaneous alternation Y-maze test (n = 37, 33, 30, and 35, from the left). No significant difference was observed among the groups regarding the locomotor activity. e, Representative tile images of Aβ (HJ3.4b antibody) and Clec7a staining in male 5xFAD and Havcr2icKO:5xFAD mice at the age of 6 months. f, Confocal images of Tmem119, Clec7a and HJ3.4b staining at the age of 6 months. g, Aβ plaque load and size were quantified in the cortices at 7 months (n = 17, 17, 12, and 15, from the left). The difference was still significant after separating sexes, both for plaque load and size. h, Aβ plaque load and size were quantified in the cortices at 5 months (n = 4, 7, 8, and 4, from the left). i, Gene expressions of molecules involved in Aβ production were quantified in brain homogenate at 7 months (n = 6 and 8, from the left). Results are shown using three, one, one, and six independent cohorts for 4, 5, 6, and 7 months, respectively. Data are mean ± s.e.m. Kruskal-Wallis test adjusted by the false discovery rate (FDR) for d, student’s two-tailed t-test for g and h.
Extended Data Fig. 5 |
Extended Data Fig. 5 |. Reduction of Aβ plaque burden is observed for all the plaque phenotypes in Havcr2icKO:5xFAD mice.
a, The plaques in the cortices at 7 months were classified into filamentous, compact, and inert areas by double staining with Methoxy-X04 and HJ3.4b. The percentage of each area was calculated per plaque depending on its size (at least 100 um2). #: significant only in females. b, Aβ plaque number with more than 100 um2 of size was quantified per 1×10⁵ um2 of the cortices at 7 months. The plaque area was calculated for total, filamentous, compact, and inert phenotypes. The inert area difference was insignificant when assessed only for female mice. c, The percentage area of each phenotype was calculated per each plaque with more than 100 um2 of size at 5 months. As plaque groups, plaques with ≥ 50% area of any phenotype were classified into the category of that phenotype. Results are shown using one and six independent cohorts for 5 and 7 months, respectively. d, Confocal images of Thioflavin-S+ and HJ3.4b+ plaques in the cortex from 7-month-old 5xFAD and Havcr2icKO:5xFAD mice. e, Quantification of the areas of filamentous plaques (HJ3.4b+Thioflavin-S), compact plaques (HJ3.4b+Thioflavin-S+), and inert plaques (HJ3.4bThioflavin-S+) from 5xFAD and Havcr2icKO:5xFAD mice at the age of 7 months (n = 13–15 ROIs/group for filamentous area, n = 14 ROIs/group for compact area, n = 14 ROIs/group for inert area; 2–3 ROIs per mouse). f, Quantification of the areas of filamentous plaques, compact plaques, and inert plaques from 5-month-old 5xFAD and Havcr2icKO:5xFAD mice (n = 11–14 ROIs/group for filamentous area, n = 11–14 ROIs/group for compact area, n = 11–14 ROIs/group for inert area; 2–3 ROIs per mouse). g, The number of synapses detected by colocalization of Homer1 and Vglut2 was quantified in the cortices at 7 months (n = 6, 12, 6, and 17, from the left). The difference was significant when both sexes were combined. Data are mean ± s.e.m. Student’s two-tailed t-test for a-c and e. One-way ANOVA with Holm-Sidak’s multiple comparisons test for g.
Extended Data Fig. 6 |
Extended Data Fig. 6 |. Galectin-3-positive area is reduced in Havcr2icKO: 5xFAD mice.
a, Representative tile images of galectin-3 staining in 5xFAD and Havcr2icKO:5xFAD mice of both sexes at the age of 6 months. b, Confocal images of galectin-3 staining in females at the age of 6 months. c, Quantification of galectin-3-positive area and fluorescence intensity in cortical regions in females at the age of 6 months (n = 4 and 7 for 5xFAD and Havcr2icKO:5xFAD mice, respectively). d, Confocal images of galectin-3 staining in males at the age of 6 months. e, Quantification of galectin-3-positive area and fluorescence intensity in cortical regions in males at the age of 6 months (n = 6/each group). f, g, The frequencies of immune cell populations were quantified among live CD45+ cells (except for DC1 and DC2, among DC) in the spleen at 7 months. Results are shown using two independent cohorts. Data are mean ± s.e.m. Student’s two-tailed t-test.
Extended Data Fig. 7 |
Extended Data Fig. 7 |. Microglial clusters found in snRNAseq of the 5xFAD cohort.
a, b, RNAseq analysis of sorted microglia (live CD45intCD11b+Tmem119+ Gr1) from 5xFAD cohort at 4 and 7 months old females. Gene expression signatures of Havcr2icKO microglia (DEGs between Havcr2icKO and control microglia) and 5xFAD microglia (DEGs between 5xFAD and control microglia) were compared. c, d, Boxplots showing the gene expression levels (log2 TPM) of Havcr2 at 4 and 7 months (n = 4, 2, 2, 4 (4 M female), 2, 3, 6, 2 (4 M male), 8, 8, 7, 6 (7 M female), 8, 5, 6, and 11 (7 M male) from the left). e, The frequency of Clec7a+ MGnD-type microglia was evaluated by flow cytometry at 4 months. f, UMAP visualization of 63,119 nuclei across all genotypes (n = 10,063, 12,531, 18,734, and 21,791 nuclei from control, Havcr2icKO, 5xFAD, and Havcr2icKO:5xFAD mice, respectively) with 26 transcriptionally distinct populations (color in the figure). g, DotPlot visualization of Havcr2 expression by genotype in 26 populations. Size of the dot is the percentage of cells in the cluster (column) expressing the marker gene (row). Color represents the average scaled expression of the gene among expressing cells. h-j, Barplot visualization of proportions (Y-axis) of individual mouse (a), and genotype (b) per microglial cluster (X-axis); and cluster per mouse (X-axis) (c). k, Dotplot visualization of top genes distinguishing each microglial cluster from snRNAseq (Fig. 5a). Size of the dot is the percentage of cells in the cluster (column) expressing the marker gene (row). Color represents the average scaled expression of the gene among expressing cells. l, m, Visualization of the MGnD (g) and homeostasis (h) signature score (Y-axis) across microglia clusters (X-axis) and genotypes (color). Each point represents a microglial cell. n, Proportions of microglial cluster 0–4 in 5xFAD and Havcr2icKO:5xFAD mice (n = 3 for each). o, Violin plot of scores for Tgfbr2cKO signature genes among genotypes in cluster 0. Results are shown using three independent cohorts for e. Data are mean ± s.e.m. Permutation test p-values were used in a and b. Student’s two-tailed t-test with Bonferroni correction for n. Student’s two-tailed t-test for o.
Extended Data Fig. 8 |
Extended Data Fig. 8 |. Havcr2icKO mice have unique microglial states in an Alzheimer’s disease model.
a, b, Heatmap of top DEGs distinguishing P1 (a) and P2 (b) subpopulations in Cluster 2/MGnD. c, d, UMAP Visualization of microglial snRNA-seq clusters colored by P1 (c) and P2 (d) signature scores.
Extended Data Fig. 9 |
Extended Data Fig. 9 |. Signature scores of different cell types in each microglial cluster.
a-h, Violin plots of microglia, border-associated macrophages (BAM), perivascular macrophages (PVM), infiltrating monocyte, and monocyte/monocyte-derived antigen-presenting cells (APC) signature scores (Y-axis) across microglial clusters (X-axis) and genotypes (color). Each point represents a microglial cell. i, j, Violin plot of signature scores (Y-axis) of P1 and P2 populations from Havcr2icKO:5xFAD mice across all genotypes and microglial clusters (X-axis).
Extended Data Fig. 10 |
Extended Data Fig. 10 |. Tim-3 expression is inversely correlated with P2 marker expressions in MGnD cluster.
a, Boxplot of pairwise spearman correlation coefficient (Y-axis) of whole gene expression pseudobulk microglial profiles between conditions (X-axis). Each point represents the spearman correlation coefficient between profiles of two biological replicates. Havcr2icKO:5xFAD;P1 vs 5xFAD: n = 9 spearman correlations derived from 34 cells from 3 biologically independent Havcr2icKO:5xFAD samples and 201 cells from 3 biologically independent 5xFAD samples. Havcr2icKO:5xFAD;P2 vs 5xFAD: n = 9 spearman correlations derived from 23 cells from 3 biologically independent Havcr2icKO:5xFAD samples and 201 cells from 3 biologically independent 5xFAD samples. Havcr2icKO:5xFAD;P1 vs Havcr2icKO:5xFAD;P2: n = 9 spearman correlations derived from 57 cells (34 cells, 23 cells, respectively) from 3 biologically independent Havcr2icKO:5xFAD samples. b, Twelve human microglial signatures were curated from a previous paper using samples from patients with AD. These signature scores were plotted for cluster 2 in our snRNAseq data. A significant difference was found only in human MG8 signature annotated as inflammatory. c, d, Scatterplot of P1(Y-axis, a) or P2 (Y-axis, b), and Hallmark TGFB signature scores among C2 5xFAD and Havcr2icKO microglia in current study. e-g, Scatterplot of P1 (Y-axis) or P2 (Y-axis), and Hallmark TGFB signature scores among 5xFAD microglia in MGnD clusters in public datasets (GSE98969 cluster 2 (e), GSE98969 cluster 3 (f), GSE140510 (g)). h, i, The cells isolated from the brain were analyzed by flow cytometry, and identified clusters were annotated according to their markers, with cluster 12 annotated as MGnD. The proportion of cluster 12 among all the cells was compared between control, 5xFAD, and Havcr2icKO:5xFAD mice at the age of 4.5−5 months (n = 3, 3, 3 (female), 2, 4, 3 (male), from the left). j, Phenograph clustering of microglia from 4-month-old control, 5xFAD, and Havcr2icKO:5xFAD mice using flow cytometry data. Cluster 12 represents Clec7a+ MGnD among the microglia. k, Pearson’s correlation between MFI of paired markers of interest within combined Clec7a+ MGnD from 4-month-old control, 5xFAD, and Havcr2icKO:5xFAD was analyzed. The coefficient indicates the strength and direction of the correlation. Data are mean ± s.e.m. *P ≤ 0.05, **P ≤ 0.01, ***P ≤ 0.001 and ****P ≤ 0.0001; Student’s two-tailed t-test for a. One-way ANOVA with Tukey’s HSD correction for b. Spearman correlation test was used for c-g. One-way ANOVA with Holm-Sidak’s multiple comparisons test for i. Pearson’s correlation analysis was adjusted by the false discovery rate (FDR) method for k.
Extended Data Fig. 11 |
Extended Data Fig. 11 |. General appearance of scRNAseq of microglia from 5xFAD cohort.
a, UMAP visualization of signature scores for the MGnD, homeostasis, and Interferon signatures. Each dot is a microglial cell, and the color represents the value of the signature score in that cell. b, DotPlot visualization of marker genes (Y-axis) for each cluster (X-axis) determined by differential gene expression between each cluster and all other cells. The size of the dot represents the number of cells in the cluster that have a non-zero expression of the gene and the color represents the average level of expression in scaled units (scaled across clusters). c, Barplot representing proportions of microglial cells in each cluster from either condition: 5xFAD (purple) or Havcr2icKO:5xFAD (dark yellow). d, e, Scatter plot of log2 fold changes of gene expression in microglia between conditions 5XFAD and Havcr2icKO:5xFAD on the X-axis and Clec7a vs Clec7a+ on the Y-axis for the clusters HMG_0 (a) and MGnD_0 (b). Spearman Correlation coefficients and p-values are indicated. Spearman correlation test for d and e.
Extended Data Fig. 12 |
Extended Data Fig. 12 |. Transcriptional characteristics of Havcr2icKO:5xFAD microglia revealed by scRNAseq.
a, The characteristic genes that were differentially expressed between Havcr2icKO:5xFAD and 5xFAD mice are described in each microglial cluster. The genes were sorted into several gene categories. Color is the log2 fold change comparing Havcr2icKO:5xFAD to 5xFAD. Asterisks are the significance level by Wilcoxon test adjusted with Benjamini-Hochberg method. b, c, Scatter plot of log2 fold changes of gene expression in microglia between conditions 5XFAD and Havcr2icKO:5xFAD on the X-axis and Clec7a vs Clec7a+ on the Y-axis for the clusters HMG_0 (b) and MGnD_0 (c). Spearman Correlation coefficients and p-values are indicated. d, e, Volcano plot of differential gene expression between conditions 5XFAD and Havcr2icKO:5xFAD and Clec7a vs Clec7a+ in clusters HMG_0 (d) and MGnD_0 (e). Each point is a gene; the X-axis represents the average log2 foldchange between conditions and the Y-axis represents the -log10(FDR). Spearman correlation test for b and c. *P ≤ 0.05, **P ≤ 0.01, ***P ≤ 0.001 and ****P ≤ 0.0001; HMG: homeostatic microglia, CC: cell-cycling.
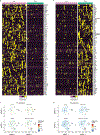
Extended Data Fig. 13 |
Extended Data Fig. 13 |. Gene expression signatures of Havcr2icKO:5xFAD microglia.
a, Gene expression was analyzed across all the genotypes at the age of 4.5 months by qPCR (n = 9, 5, 7, 11 (male), 8, 8, 7, 9 (female), from the left). b, Microglial signature scores curated using a previous paper were compared between Havcr2icKO:5xFAD and 5xFAD in each microglial cluster defined in Fig. 5k using a t-test. Numbers are the test statistics (Havcr2icKO:5xFAD against 5xFAD); background color shows upregulation or downregulation; and text color is the significance of the t-test. The p-values were adjusted using the Benjamini-Hochberg method. Data are mean ± s.e.m. One-way ANOVA with Sidak’s multiple comparisons test for a. HMG: homeostatic microglia, CC: cell-cycling.
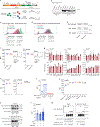
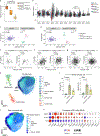
Fig. 1 |
Fig. 1 |. Havcr2cKO microglia have a MGnD-like gene-expression profile.
a,b, Gene expression in microglia during development. a, Heatmap visualization of the average expression across microarray probes mapping to the same gene (row), normalized across replicates (column) in progenitor, embryonic (E) and postnatal (P) adult stage (2 months old) microglia. YSM, yolk sac macrophage. b, Dot plot visualization of gene expression (rows) at P9 and P28 stages of development. The dot size indicates the proportion of cells expressing the gene, and the colour represents average expression. c,d, RT–qPCR analysis of co-inhibitory molecules (c) and TGFβ-pathway-related molecules (d) in microglia (live CD45intCD11b+) during the early postnatal period (n = 9 (P7), 3 (P13), 5 (P20), 4 (P26)). The mean expression value at P7 was set as 1 for each gene. a.u., arbitrary units. e, Flow cytometry analyses of primary microglia (live CD45intTMEM119+) cultured with TGFβ (10 ng ml−1) (n = 3 per condition). The mean fluorescence intensity (MFI) of samples without stimulation was set as 1 for each molecule. FMO, fluorescence minus one. f, RT–qPCR analysis of primary microglia (live CD45intCD11b+) cultured with TGFβ (10 ng ml−1) for 24 h (n = 3 per condition, independent samples). g, Fragments per kilobase of transcript per million mapped reads (FPKM) value of Havcr2 in Tgfbr2cKO microglia (n = 3 per condition). h,i, RNA-seq analysis of microglia (live CD45intCD11b+) from 1-month-old Havcr2cKO mice (n = 4 (3 males, 1 female), independent mice) and Havcr2flox/flox (control) mice (n = 5 (4 males, 1 female), independent mice). h, Heatmap visualization of DEGs (FDR < 0.05). Rows represent genes and columns are biological replicates. Gene expression is row-normalized across replicates. i, Volcano plot of a DEG analysis performed using DESeq2. jl, The scores of MGnD (j), homeostasis (k) and KEGG phagosome (l) signatures. The y axis represents log2-transformed average transcripts per million (TPM) (the same dataset as Fig. 1h, independent mice). m, RT–qPCR analysis of Havcr2cKO microglia (live CD45intCD11b+4D4+GR1) (n = 8 control, 7 Havcr2cKO, all females). The mean expression value of controls was set as 1 for each gene. n, Flow cytometry analysis of AXL, LY9 and TIM-3 in Havcr2cKO microglia (n = 8 control, 8 Havcr2cKO, all females). Results are shown from one experiment, representing at least two independent experiments (e,f,n). Data are the mean ± s.e.m. Student’s two-tailed t-test.
Fig. 2 |
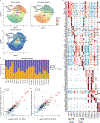
Fig. 2 |. Havcr2cKO and Tgfbr2cKO microglia share SMAD2-related gene-expression changes.
a, Circos plot comparison of DEGs upregulated (yellow) and downregulated (green) in Havcr2cKO microglia (the same dataset as Fig. 1h) with those upregulated (pink) and downregulated (blue) in Tgfbr2cKO microglia. b, Scatter plot of genes based on expression differences represented by log2-transformed fold changes in Havcr2cKO (x axis) and Tgfbr2cKO microglia (y axis) compared with control microglia. Genes upregulated or downregulated in both comparisons are indicated in red and blue, respectively. c, Co-IP–MS screening for binding partners of TIM-3. d, Blots of HEK293 cells transfected with WT Havcr2 and co-immunoprecipitated for HA–TIM-3. The samples for the control β-actin were run on a separate gel as sample-processing controls. IP, immunoprecipitated. e, Blots of lysate from human iMG co-immunoprecipitated for TIM-3. The band with a lower molecular weight in the lanes of the co-immunoprecipitated samples for SMAD2 is from the heavy chain of the IgG (around 50 kDa) antibody used for Co-IP. f, Homer transcription factor motif-enrichment analysis of 82 upregulated and 79 downregulated DEGs in Havcr2cKO microglia described in Fig. 1h. g,h, Flow cytometry analysis of Havcr2cKO microglia for pSMAD2 (g) and SMAD2 (h) (n = 8 and 7 for g; 5 and 4 for h, independent samples). MFI, mean fluorescence intensity. i, RT–qPCR analysis of Havcr2cKO microglia (live CD45intCD11b+4D4+GR1) (n = 8 control, 7 Havcr2cKO). j, Flow cytometry analysis of microglia (live CD45intCD11b+) for pSMAD2 cultured with M-CSF (10 ng ml−1), GM-CSF (10 ng ml−1) or TGFβ (10 ng ml−1) for 16 h (n = 3 per condition, independent samples). k, Flow cytometry analysis of pSMAd2 in HEK293 cells transfected with WT Havcr2 plasmid stimulated with TGFβ for 4 h (n = 3 per condition, independent samples). l, Flow cytometry analysis of Tgfbr2KO and Smad2KO BV2 cells transfected with WT Havcr2 plasmid (n = 4 per condition, independent samples). Results are shown from one experiment, representing at least two independent experiments (d,e,g,h,jl). Data are the mean ± s.e.m. Statistical tests: permutation test (a), two-sided Spearman’s correlation test (b), two-sided moderated t-test with Benjamini–Hochberg correction (c) or Student’s two-tailed t-test (g,jl). See Supplementary Fig. 1 for gel source data (d,e). NS, not significant.
Fig. 3 |
Fig. 3 |. Havcr2cKO microglia have increased phagocytic ability and share a gene-expression signature with phagocytosing microglia.
a, WT and mutant Havcr2 structures. HA, haemagglutinin; TM, transmembrane. b, Blots of HEK293 cells transfected with Havcr2 constructs co-immunoprecipitated for HA–TIM-3. The samples for the control β-tubulin were run on a separate gel as sample-processing controls (see Supplementary Fig. 1 for gel source data). c, Flow cytometry analysis of pSMAD2 in Havcr2 construct-transfected HEK293 cells. A successfully transfected TIM-3-positive fraction was analysed and compared with all the live cells in the control group (Extended Data Fig. 1c) (n = 3 per condition, independent samples). d, Schematic of the regulation of SMAD2 phosphorylation by TIM-3. e, Havcr2cKO microglia were cultured with pH-sensitive dye-stained Aβ for 4 h (n = 8 control, 7 Havcr2cKO, 1 without Aβ, independent samples). f, Fluorescence-stained dead neurons were injected into the cortex and hippocampus of live male mice (3 months old, n = 8 control, 6 Havcr2cKO, independent mice). The fraction of phagocytosing microglia was analysed 16 h later. g, RNA-seq analysis of sorted microglia (live CD45intCD11b+ 4D4+Ly6C) from the same experiment as f. The top DEGs shared by at least two of the following three comparisons are shown in the heatmap: (1) control phagocytosing (Phago(+)) versus control non-phagocytosing (Phago(–)); (2) Havcr2cKO phagocytosing versus control phagocytosing; (3) Havcr2cKO non-phagocytosing versus control non-phagocytosing. Selected genes are highlighted, including the KEGG phagosome pathway gene set (mmu04145), the top 100 DEGs of Clec7Aa+ versus Clec7a microglia and selected genes (Cd9, Cd33, Cst7, Cstb, Cxcl16, Ly9, Lyz2 and H2). hj, The expression of Marco, Cd33 and Havcr2 in microglia from the same experiment as g (n = 8, 5, 5 and 4, from the left, independent mice in each genotype). k, Pathway analysis of the top DEGs comparing non-phagocytosing Havcr2cKO to non-phagocytosing control microglia (FDR < 0.1). Disease pathways (pathways under sections 6.1–6.10 from https://www.kegg.jp/kegg/pathway.html) and ribosomal genes were excluded from the analysis. l, Gene-expression signatures of Havcr2cKO microglia (DEGs between Havcr2cKO non-phagocytosing and control non-phagocytosing microglia) and phagocytosing microglia (DEGs between control phagocytosing and control non-phagocytosing microglia) were compared using the same RNA-seq data as in g. The same set of genes is highlighted as in g. m, The number of overlapping genes (n) between each pair of DEGs upregulated and downregulated in Havcr2cKO, phagocytosing, Tgfbr2cKO and Clec7a+ microglia compared with control microglia. N is the total number of up- or downregulated genes in the condition (row). Results are shown from one experiment, representing at least two independent experiments (b,c,e,f). Data are the mean ± s.e.m. Statistical tests: one-way analysis of variance (ANOVA) with Dunnett’s multiple comparisons test (c) or Student’s two-tailed t-test (e,f,hj). One-sided permutation test is described in the section ‘Circos plot and permutation test’ in the Methods for l and m. The schematic in d was created using BioRender (https://biorender.com).
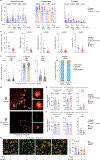
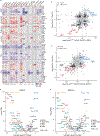
Fig. 4 |
Fig. 4 |. Havcr2icKO microglia improve cognitive function and mitigate pathological changes in the brain of a mouse model of AD.
a,b, Spatial memory function was assessed using spontaneous alternation Y-mazes tests in mice aged 7–8 months (n = 37, 33, 30 and 35, from the left, independent mice) (a). Multivariate linear regression analysis confirmed that memory function was restored in Havcr2icKO:5×FAD mice compared with 5×FAD mice (b). c,d, Cognitive function was assessed using forced alternation Y-maze tests in mice aged 7–8 months (n = 53, 52, 50 and 55, from the left) (c). Multivariate linear regression analysis (d). eg, Anxiety-like behaviour was longitudinally assessed using open-field tests in mice aged 4, 6, 8 and 10 months (groups from the left: n = 41, 49, 39 and 37 (4 months old); 44, 49, 39 and 41 (6 months old); 44, 47, 38 and 40 (8 months old); and 39, 40, 30 and 35 (10 months old)) (e,f). Multivariate linear regression analysis for mice aged 10 months (g). h, Images of immunostaining for Aβ (HJ3.4b antibody) and CLEC7A in 6 month-old female mice. i, Confocal images of CLEC7A, P2RY12 and HJ3.4b in 6-month-old female mice. j,k, Quantification of HJ3.4b-positive (j) and CLEC7A-positive (k) area and fluorescence intensity in cortical regions at 6 months (n = 4 and 7 females in 5 × FAD and Havcr2icKO:5 × FAD, respectively. n = 6 males per group). l, Images of plaques in the cortices of mice aged 7 months were classified into filamentous, compact and inert areas by double staining with methoxy-X04 and HJ3.4b (n = 336 and 251 plaques). The percentage of each area was calculated per plaque >100 μm2 in size. As plaque groups, plaques with ≥50% area of any phenotype were classified into the category of that phenotype. The difference in filamentous and inert areas was not significant when assessed only for male mice. Results are shown from one experiment, representing at least two independent experiments (hk). The results were reproduced with an alternative method in Extended Data Fig. 5d,e, for l. Data are the mean ± s.e.m. Statistical tests: Kruskal–Wallis test adjusted by the FDR (a,f), unpaired two-sided Wilcoxon test (c) or Student’s two-tailed t-test (jl). Scale bars, 1 mm (h), 50 μm (i) or 10 μm (l).
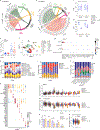
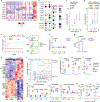
Fig. 5 |
Fig. 5 |. Havcr2icKO mice have distinct microglial states in an AD model.
a, UMAP visualization of snRNA-seq data of microglia prepared from mice aged 5 months (colour, number on legend). b, Probability density curves of the signature score for the hallmark TGFβ pathway in C2 from 5×FAD (purple) and Havcr2icKO:5×FAD (yellow) mice. Individual cells of each genotype are represented by the bars on top. ce, Projection of P1 (magenta) and P2 (green) marker genes on the volcano plot of DEGs in different microglial perturbations: phagocytosis assay (c), MGnD (d) and Tgfbr2cKO (e). Only marker genes that are also significant in each perturbation are indicated. Spearman’s correlation was analysed for log2 fold changes of all expressed genes in each perturbation condition (ce) with those in P1 versus P2. f, Dot plot representation of P1 and P2 marker genes that are significant DEGs in perturbations (ce) and known anti-inflammatory, pro-inflammatory and phagocytic properties. Size of the dot is the percentage of cells in the genotype (row) expressing the marker gene. Colour represents the average scaled expression of the gene. g,h, Violin plots of alternative macrophage (g) and phagocytic (h) signature genes among genotypes in C2 (MGnD). i, Flow cytometry analysis of microglia prepared from mice aged 4 months (n = 3, 3 female; 4, 3 male, independent mice). Each data point in the bar plots represent the MFI for each sample only from Clec7a+ MGnD (the phenograph C12 of the UMAP, as shown in Extended Data Fig. 10j). j, Gating of microglia based on the expressions of NRP1 and IL-10RA in Clec7a+ MGnD. The frequencies of each population are shown (n = 3 5xFAD female mice, 3 Havcr2icKO:5×FAD female mice, 4 5xFAD male mice and 3 Havcr2icKO:5xFAD male mice). k, UMAP visualization of transcriptomic profiles of Havcr2icKO: 5×FAD and 5×FAD microglia coloured by clusters. Each dot is a microglial cell. l, KEGG, GO and MSigDB hallmark signatures and the cGAS–STING signature from a previous study were compared between Havcr2icKO:5×FAD and 5×FAD mice in each microglial cluster defined in k. Colour is Hedges’ g effect size, and asterisks are the significance level of the Benjamini–Hochberg-adjusted t-test (Havcr2icKO:5×FAD against 5×FAD). Data are the mean ± s.e.m. *P ≤ 0.05, **P ≤ 0.01, ***P ≤ 0.001 and ****P ≤ 0.0001. Statistical tests: Student’s two-tailed t-test (i,j) or one-way ANOVA with Tukey’s honestly significant difference correction (g,h). CC, cell cycling; HMG, homeostatic microglia.

References

    1. Colonna M & Butovsky O Microglia function in the central nervous system during health and neurodegeneration. Annu. Rev. Immunol 35, 441–468 (2017). - PMC - PubMed
    1. Butovsky O & Weiner HL Microglial signatures and their role in health and disease. Nat. Rev. Neurosci 19, 622–635 (2018). - PMC - PubMed
    1. Wightman DP et al. A genome-wide association study with 1,126,563 individuals identifies new risk loci for Alzheimer’s disease. Nat. Genet 53, 1276–1282 (2021). - PMC - PubMed
    1. Wolf Y, Anderson AC & Kuchroo VK TIM3 comes of age as an inhibitory receptor. Nat. Rev. Immunol 20, 173–185 (2020). - PMC - PubMed
    1. Jansen IE et al. Genome-wide meta-analysis identifies new loci and functional pathways influencing Alzheimer’s disease risk. Nat. Genet 51, 404–413 (2019). - PMC - PubMed

MeSH terms

Substances