Randomized Controlled Trial
. 2025 Jun;642(8067):442-450.
doi: 10.1038/s41586-025-08866-7. Epub 2025 Apr 9.

Towards conversational diagnostic artificial intelligence

Affiliations
Randomized Controlled Trial

Towards conversational diagnostic artificial intelligence

Tao Tu et al. Nature. 2025 Jun.

Abstract

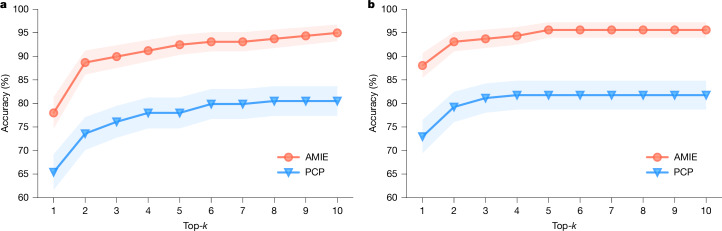
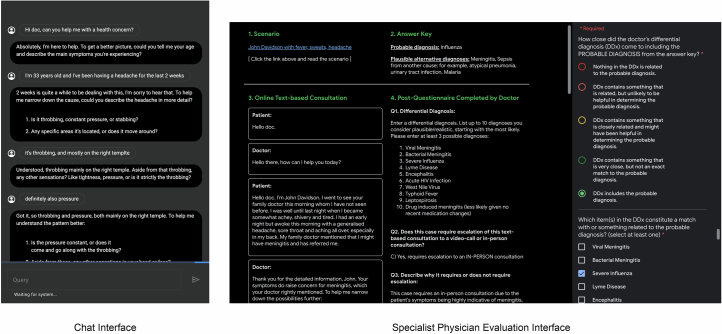
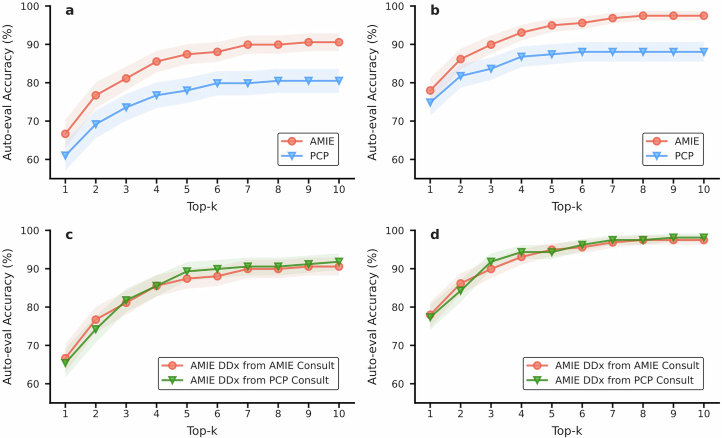
At the heart of medicine lies physician-patient dialogue, where skillful history-taking enables effective diagnosis, management and enduring trust1,2. Artificial intelligence (AI) systems capable of diagnostic dialogue could increase accessibility and quality of care. However, approximating clinicians' expertise is an outstanding challenge. Here we introduce AMIE (Articulate Medical Intelligence Explorer), a large language model (LLM)-based AI system optimized for diagnostic dialogue. AMIE uses a self-play-based3 simulated environment with automated feedback for scaling learning across disease conditions, specialties and contexts. We designed a framework for evaluating clinically meaningful axes of performance, including history-taking, diagnostic accuracy, management, communication skills and empathy. We compared AMIE's performance to that of primary care physicians in a randomized, double-blind crossover study of text-based consultations with validated patient-actors similar to objective structured clinical examination4,5. The study included 159 case scenarios from providers in Canada, the United Kingdom and India, 20 primary care physicians compared to AMIE, and evaluations by specialist physicians and patient-actors. AMIE demonstrated greater diagnostic accuracy and superior performance on 30 out of 32 axes according to the specialist physicians and 25 out of 26 axes according to the patient-actors. Our research has several limitations and should be interpreted with caution. Clinicians used synchronous text chat, which permits large-scale LLM-patient interactions, but this is unfamiliar in clinical practice. While further research is required before AMIE could be translated to real-world settings, the results represent a milestone towards conversational diagnostic AI.


Conflict of interest statement

Competing interests: This study was funded by Alphabet Inc. and/or a subsidiary thereof (‘Alphabet’). All authors are employees of Alphabet and may own stock as part of the standard compensation package.

Figures

Fig. 1
Fig. 1. Overview of contributions.
AMIE is a conversational medical AI optimized for diagnostic dialogue. It is instruction fine-tuned with a combination of real-world and simulated medical dialogues, alongside a diverse set of medical reasoning, question-answering (QA) and summarization datasets. Notably, we designed a self-play-based simulated dialogue environment with automated feedback mechanisms to scale AMIE’s capabilities across various medical contexts and specialties. Specifically, this iterative self-improvement process consisted of two self-play loops: (1) an ‘inner’ self-play loop, where AMIE leveraged in-context critic feedback to refine its behaviour on simulated conversations with an AI patient agent; and (2) an ‘outer’ self-play loop where the set of refined simulated dialogues were incorporated into subsequent fine-tuning iterations. During online inference, AMIE used a chain-of-reasoning strategy to progressively refine its response, conditioned on the current conversation, to arrive at an accurate and grounded reply to the patient in each dialogue turn. We designed and conducted a blinded remote OSCE with validated patient-actors interacting with AMIE or PCPs by means of a text chat interface. Across multiple axes, corresponding to both specialist physician (30 out of 32) and patient-actor (25 out of 26) perspectives, AMIE was rated as superior to PCPs while being non-inferior on the rest.
Fig. 2
Fig. 2. Overview of randomized study design.
A PCP and AMIE perform (in a randomized order) a virtual remote OSCE with simulated patients by means of an online multi-turn synchronous text chat and produce answers to a post-questionnaire. Both the PCP and AMIE are then evaluated by both the patient-actors and specialist physicians.
Fig. 3
Fig. 3. Specialist-rated top-k diagnostic accuracy.
a,b, The AMIE and PCP top-k DDx accuracies, determined by the majority vote of three specialists, are compared across 159 scenarios with respect to the ground-truth diagnosis (a) and all diagnoses in the accepted differential (b). Centrelines correspond to the average top-k accuracies, with the shaded areas indicating 95% confidence intervals computed from two-sided bootstrap testing (n = 10,000). All top-k differences between AMIE and PCP DDx accuracy are significant, with P < 0.05 after FDR correction. The FDR-adjusted P values for ground-truth comparison are: 0.0017 (k = 1), 0.0002 (k = 2), 0.0002 (k = 3), 0.0002 (k = 4), 0.0002 (k = 5), 0.0003 (k = 6), 0.0003 (k = 7), 0.0003 (k = 8), 0.0002 (k = 9) and 0.0002 (k = 10) (a). The FDR-adjusted P values for accepted differential comparison are: 0.0001 (k = 1), 0.0001 (k = 2), 0.0002 (k = 3), 0.0002 (k = 4), 0.0001 (k = 5), 0.0001 (k = 6), 0.0001 (k = 7), 0.0001 (k = 8), 0.0001 (k = 9) and 0.0001 (k = 10) (b).
Fig. 4
Fig. 4. Patient-actor ratings.
Conversation qualities, as assessed by the patient-actors upon conclusion of the consultation. For illustration purposes, all responses from the five-point rating scales were mapped to a generic five-point scale ranging from ‘Very favourable’ to ‘Very unfavourable’. For Yes/No (Y/N) questions, a (positive) ‘Yes’ response was mapped to the same colour as ‘Favourable’ and a (negative) ‘No’ response to the same colour as ‘Unfavourable’. The rating scales were adapted from the GMCPQ, PACES and a narrative review about PCCBP. Details on question-wording and response options are provided in Extended Data Tables 1 and 2. The evaluation involved 159 simulated patients. The P values were determined using two-sided Wilcoxon signed-rank tests with FDR correction. Cases where either AMIE or the PCP received ‘Cannot rate/Does not apply’ were excluded from the test.
Fig. 5
Fig. 5. Specialist physician ratings.
Conversation and reasoning qualities, as assessed by specialist physicians. For illustration purposes, all responses from the five-point rating scales were mapped to a generic five-point scale ranging from ‘Very favourable’ to ‘Very unfavourable’. The only four-point scale (DDx comprehensiveness) was mapped to the same scale, ignoring the ‘Neither favourable nor unfavourable’ option. For Yes/No questions, a (positive) ‘Yes’ response was mapped to the same colour as ‘Favourable’ and a (negative) ‘No’ response to the same colour as ‘Unfavourable’. The rating scales were adapted from PACES, a narrative review about PCCBP and other sources. Details on question-wording and response options are provided in Extended Data Tables 1–3. The evaluation involved 159 simulated patients, with the ratings from three distinct specialist physician raters for each case being aggregated using the median. The P values were determined using two-sided Wilcoxon signed-rank tests with FDR correction. Cases where either AMIE or the PCP received ‘Cannot rate/Does not apply’ were excluded from the test.
Extended Data Fig. 1
Extended Data Fig. 1. User interfaces for the online consultation and evaluation processes.
Online consultations between patient actors and either AMIE or the primary care physicians (PCPs) were conducted by means of a synchronous text-based chat interface. The evaluation process was facilitated through a rating interface in which specialist physicians were provided the scenario information including differential diagnosis answer key, as well as a consultation transcript along with post-questionnaire responses from AMIE or the PCPs. Rating prompts were provided alongside these pieces of information.
Extended Data Fig. 2
Extended Data Fig. 2. DDx top-k accuracy for non-disease-states and positive disease-states.
a,b: Specialist rated DDx top-k accuracy for the 149 “positive” scenarios with respect to (a) the ground-truth diagnosis and (b) the accepted differentials. c,d: Specialist rated DDx top-k accuracy for the 10 “negative” scenarios with respect to (c) the ground-truth diagnosis and (d) the accepted differentials. Using two-sided bootstrap tests (n = 10,000) with FDR correction, differences in the “positive” scenarios were significant (P <0.05) for all k, but differences in “negative” scenarios were not significant due to the small sample size. Centrelines correspond to the average top-k accuracy, with 95% confidence intervals shaded. The FDR-adjusted P values for positive disease states, ground-truth comparison: 0.0041 (k = 1), 0.0002 (k = 2), 0.0001 (k = 3), 0.0002 (k = 4), 0.0001 (k = 5), 0.0002 (k = 6), 0.0002 (k = 7), 0.0003 (k = 8), 0.0001 (k = 9) and 0.0001 (k = 10) (a). The FDR-adjusted P values for positive disease states, accepted differential comparison: 0.0002 (k = 1), 0.0001 (= 2), 0.0002 (k = 3), 0.0003 (k = 4), 0.0001 (= 5), 0.0001 (k = 6), 0.0001 (k = 7), 0.0001 (k = 8), 0.0001 (k = 9) and 0.0001 (k = 10) (b). The FDR-adjusted P values for non-disease states, ground-truth comparison: 0.1907 (k = 1), 0.1035 (k = 2), 0.1035 (k = 3), 0.1035 (k = 4), 0.1035 (k = 5), 0.1035 (k = 6), 0.1035 (k = 7), 0.1035 (k = 8), 0.1035 (k = 9) and 0.1035 (k = 10) (c). The FDR-adjusted P values for non-disease states, accepted differential comparison: 0.1035 (k = 1), 0.1035 (k = 2), 0.1829 (k = 3), 0.1035 (k = 4), 0.1035 (k = 5), 0.1035 (k = 6), 0.1035 (k = 7), 0.1035 (k = 8), 0.1035 (k = 9) and 0.1035 (k = 10) (d).
Extended Data Fig. 3
Extended Data Fig. 3. Specialist rated DDx accuracy by scenario specialty.
Top-k DDx accuracy for scenarios with respect to the ground-truth in (a) Cardiology (N = 31, not significant), (b) Gastroenterology (N = 33, not significant), (c) Internal Medicine (N = 16, significant for all k), (d) Neurology (N = 32, significant for k > 5), (e) Obstetrics and Gynaecology (OBGYN)/Urology (N = 15, not significant), (f) Respiratory (N = 32, significant for all k). Two-sided bootstrap tests (n = 10,000) with FDR correction were used to assess significance (P < 0.05) on these cases. Centrelines correspond to the average top-k accuracy, with 95% confidence intervals shaded. The FDR-adjusted P values for Cardiology: 0.0911 (k = 1), 0.0637 (k = 2), 0.0637 (k = 3), 0.0911 (k = 4), 0.0911 (k = 5), 0.0929 (k = 6), 0.0929 (k = 7), 0.0929 (k = 8), 0.0929 (k = 9) and 0.0929 (k = 10) (a). The FDR-adjusted P values for Gastroenterology: 0.4533 (k = 1), 0.1735 (k = 2), 0.1735 (k = 3), 0.1735 (k = 4), 0.1735 (k = 5), 0.1735 (k = 6), 0.1735 (k = 7), 0.1735 (k = 8), 0.1735 (k = 9) and 0.1735 (k = 10) (b). The FDR-adjusted P values for Internal Medicine: 0.0016 (k = 1), 0.0102 (k = 2), 0.0216 (k = 3), 0.0216 (k = 4), 0.0013 (k = 5), 0.0013 (k = 6), 0.0013 (k = 7), 0.0013 (k = 8), 0.0013 (k = 9) and 0.0013 (k = 10) (c). The FDR-adjusted P values for Neurology: 0.2822 (k = 1), 0.1655 (k = 2), 0.1655 (k = 3), 0.069 (k = 4), 0.069 (k = 5), 0.0492 (k = 6), 0.0492 (k = 7), 0.0492 (k = 8), 0.0492 (k = 9) and 0.0492 (k = 10) (d). The FDR-adjusted P values for OBGYN/Urology: 0.285 (k = 1), 0.1432 (k = 2), 0.1432 (k = 3), 0.1432 (k = 4), 0.1432 (k = 5), 0.1432 (k = 6), 0.1432 (k = 7), 0.1432 (k = 8), 0.1432 (k = 9) and 0.1432 (k = 10) (e). The FDR-adjusted P values for Respiratory: 0.0004 (k = 1), 0.0004 (k = 2), 0.0004 (k = 3), 0.0004 (k = 4), 0.0004 (k = 5), 0.0006 (k = 6), 0.0006 (k = 7), 0.0006 (k = 8), 0.0006 (k = 9) and 0.0006 (k = 10) (f).
Extended Data Fig. 4
Extended Data Fig. 4. DDx accuracy by location.
a, b: Specialist DDx rating of AMIE and the PCPs with respect to the ground-truth for the 77 cases conducted in Canada (a) and 82 cases in India (b). The differences between AMIE and the PCPs performance are significant for all values of k. c, d: Auto-evaluation rated DDx for 40 scenarios which were duplicated in both Canada and India for AMIE (c) and the PCPs (d). The differences between Canada and India performance are not significant on these shared scenarios, for both AMIE and the PCPs. Significance was determined using two-sided bootstrap tests (n = 10,000) with FDR correction. Centrelines correspond to the average top-k accuracy, with 95% confidence intervals shaded. The FDR-adjusted P values for Canada comparison: 0.0438 (k = 1), 0.0289 (k = 2), 0.0438 (k = 3), 0.0305 (k = 4), 0.0267 (k = 5), 0.0267 (k = 6), 0.0267 (k = 7), 0.0305 (k = 8), 0.0305 (k = 9) and 0.0276 (k = 10) (a). The FDR-adjusted P values for India comparison: 0.0037 (k = 1), 0.0005 (k = 2), 0.0005 (k = 3), 0.0013 (k = 4), 0.0013 (k = 5), 0.0009 (k = 6), 0.0009 (k = 7), 0.0005 (k = 8), 0.0005 (k = 9) and 0.0005 (k = 10) (b). The FDR-adjusted P values for shared AMIE scenarios: 0.3465 (k = 1), 0.3465 (k = 2), 0.4109 (k = 3), 0.4109 (k = 4), 0.3465 (k = 5), 0.3465 (k = 6), 0.3465 (k = 7), 0.3465 (k = 8), 0.3465 (k = 9) and 0.3465 (k = 10) (c). The FDR-adjusted P values for shared PCP scenarios: 0.3905 (k = 1), 0.4356 (k = 2), 0.3905 (k = 3), 0.3905 (k = 4), 0.3905 (k = 5), 0.3905 (k = 6), 0.3905 (k = 7), 0.3905 (k = 8), 0.3905 (k = 9) and 0.3905 (k = 10) (d).
Extended Data Fig. 5
Extended Data Fig. 5. Auto-evaluation of DDx performance.
a, b: Top-k DDx auto-evaluation of AMIE’s and the PCP’s differential diagnoses from their own consultations with respect to the ground-truth (a, significant for k > 3) and the list of accepted differentials (b, significant for k > 4). c, d: Top-k DDx auto-evaluation of AMIE’s differential diagnoses when provided its own vs. the PCP’s consultation transcript with respect to the ground-truth (c, not significant) and the list of accepted differentials (d, not significant). Two-sided bootstrap tests (n = 10,000) with FDR correction were used to assess significance (P < 0.05) on these 159 cases. Centrelines correspond to the average top-k accuracy, with 95% confidence intervals shaded. The FDR-adjusted P values for AMIE vs. the PCP ground-truth comparison: 0.1399 (k = 1), 0.0737 (k = 2), 0.0596 (k = 3), 0.0315 (k = 4), 0.0221 (k = 5), 0.0315 (k = 6), 0.0182 (k = 7), 0.0221 (k = 8), 0.0182 (k = 9) and 0.0182 (k = 10) (a). The FDR-adjusted P values for AMIE vs. the PCP accepted differential comparison: 0.2297 (k = 1), 0.1713 (k = 2), 0.0779 (k = 3), 0.0546 (k = 4), 0.018 (k = 5), 0.0174 (k = 6), 0.006 (k = 7), 0.0033 (k = 8), 0.0033 (k = 9) and 0.0033 (k = 10) (b). The FDR-adjusted P values for AMIE vs. the PCP consultation ground-truth comparison: 0.4929 (k = 1), 0.4929 (k = 2), 0.4929 (k = 3), 0.4929 (k = 4), 0.4929 (k = 5), 0.4929 (k = 6), 0.4929 (k = 7), 0.4929 (k = 8), 0.4929 (k = 9) and 0.4929 (k = 10) (c). The FDR-adjusted P values for AMIE vs. the PCP consultation accepted differential comparison: 0.4461 (k = 1), 0.4461 (k = 2), 0.4461 (k = 3), 0.4461 (k = 4), 0.4461 (k = 5), 0.4461 (k = 6), 0.4461 (k = 7), 0.4461 (k = 8), 0.4461 (k = 9) and 0.4461 (k = 10) (d).
Extended Data Fig. 6
Extended Data Fig. 6. Consultation verbosity and efficiency of information acquisition.
a, Total patient actor words elicited by AMIE and the PCPs. b, Total words sent to patient actor from AMIE and the PCPs. c, Total number of turns in AMIE vs. the PCP consultations. For (a-c), Centrelines correspond to the median, with the box indicating 25th and 75th percentiles. The minimum and maximum are presented as the bottom and top whiskers, respectively, excluding the outliers which are defined as data points further than 1.5 times the inter-quartile range from the box. d, e: The top-3 auto-evaluation rated DDx accuracy of AMIE using the first T turns of each consultation, with respect to the ground-truth diagnosis (d) and the accepted differentials (e). Differences on these 159 cases are not significant (P > 0.05) when compared through two-sided bootstrap tests (n = 10,000) with FDR correction. Centrelines correspond to the average top-3 accuracy, with 95% confidence intervals shaded.

References

    1. Levine, D. History taking is a complex skill. Br. Med. J. 358, j3513 (2017). - PubMed
    1. Engel, G. L. & Morgan, W. L. Interviewing the Patient (W. B. Saunders, 1973).
    1. Fu, Y., Peng, H., Khot, T. & Lapata, M. Improving language model negotiation with self-play and in-context learning from AI feedback. Preprint at https://arxiv.org/abs/2305.10142 (2023).
    1. Sloan, D. A., Donnelly, M. B., Schwartz, R. W. & Strodel, W. E. The objective structured clinical examination. The new gold standard for evaluating postgraduate clinical performance. Ann. Surg.222, 735 (1995). - PMC - PubMed
    1. Carraccio, C. & Englander, R. The objective structured clinical examination: a step in the direction of competency-based evaluation. Arch. Pediatr. Adolesc. Med.154, 736–741 (2000). - PubMed

Publication types

LinkOut - more resources