Comparative Study
. 2025 May;641(8062):401-418.
doi: 10.1038/s41586-025-08816-3. Epub 2025 Apr 9.

Complete sequencing of ape genomes

DongAhn Yoo  1 Arang Rhie  2 Prajna Hebbar  3 Francesca Antonacci  4 Glennis A Logsdon  1   5 Steven J Solar  2 Dmitry Antipov  2 Brandon D Pickett  2 Yana Safonova  6 Francesco Montinaro  4   7 Yanting Luo  8 Joanna Malukiewicz  9   10 Jessica M Storer  11 Jiadong Lin  1 Abigail N Sequeira  12 Riley J Mangan  13   14   15 Glenn Hickey  3 Graciela Monfort Anez  16 Parithi Balachandran  17 Anton Bankevich  6 Christine R Beck  11   17   18 Arjun Biddanda  19 Matthew Borchers  16 Gerard G Bouffard  20 Emry Brannan  21 Shelise Y Brooks  20 Lucia Carbone  22   23 Laura Carrel  24 Agnes P Chan  25 Juyun Crawford  20 Mark Diekhans  3 Eric Engelbrecht  26 Cedric Feschotte  27 Giulio Formenti  28 Gage H Garcia  1 Luciana de Gennaro  4 David Gilbert  29 Richard E Green  30 Andrea Guarracino  31 Ishaan Gupta  32 Diana Haddad  33 Junmin Han  34 Robert S Harris  12 Gabrielle A Hartley  11 William T Harvey  1 Michael Hiller  35   36   37 Kendra Hoekzema  1 Marlys L Houck  38 Hyeonsoo Jeong  1 Kaivan Kamali  12 Manolis Kellis  13   14 Bryce Kille  39 Chul Lee  40 Youngho Lee  41 William Lees  26   42 Alexandra P Lewis  1 Qiuhui Li  43 Mark Loftus  44   45 Yong Hwee Eddie Loh  46 Hailey Loucks  3 Jian Ma  47 Yafei Mao  34   48   49 Juan F I Martinez  6 Patrick Masterson  33 Rajiv C McCoy  19 Barbara McGrath  12 Sean McKinney  16 Britta S Meyer  9 Karen H Miga  3 Saswat K Mohanty  12 Katherine M Munson  1 Karol Pal  12 Matt Pennell  50 Pavel A Pevzner  32 David Porubsky  1 Tamara Potapova  16 Francisca R Ringeling  51 Joana L Rocha  52 Oliver A Ryder  38 Samuel Sacco  30 Swati Saha  26 Takayo Sasaki  29 Michael C Schatz  43 Nicholas J Schork  25 Cole Shanks  3 Linnéa Smeds  12 Dongmin R Son  53 Cynthia Steiner  38 Alexander P Sweeten  2 Michael G Tassia  19 Françoise Thibaud-Nissen  33 Edmundo Torres-González  12 Mihir Trivedi  1 Wenjie Wei  54   55 Julie Wertz  1 Muyu Yang  47 Panpan Zhang  27 Shilong Zhang  34 Yang Zhang  47 Zhenmiao Zhang  32 Sarah A Zhao  13 Yixin Zhu  50 Erich D Jarvis  40   56 Jennifer L Gerton  16 Iker Rivas-González  57 Benedict Paten  3 Zachary A Szpiech  12 Christian D Huber  12 Tobias L Lenz  9 Miriam K Konkel  44   45 Soojin V Yi  53   58 Stefan Canzar  51 Corey T Watson  26 Peter H Sudmant  52   59 Erin Molloy  60 Erik Garrison  31 Craig B Lowe  8 Mario Ventura  4 Rachel J O'Neill  11   18   21 Sergey Koren  2 Kateryna D Makova  61 Adam M Phillippy  62 Evan E Eichler  63   64
Affiliations
Comparative Study

Complete sequencing of ape genomes

DongAhn Yoo et al. Nature. 2025 May.

Abstract

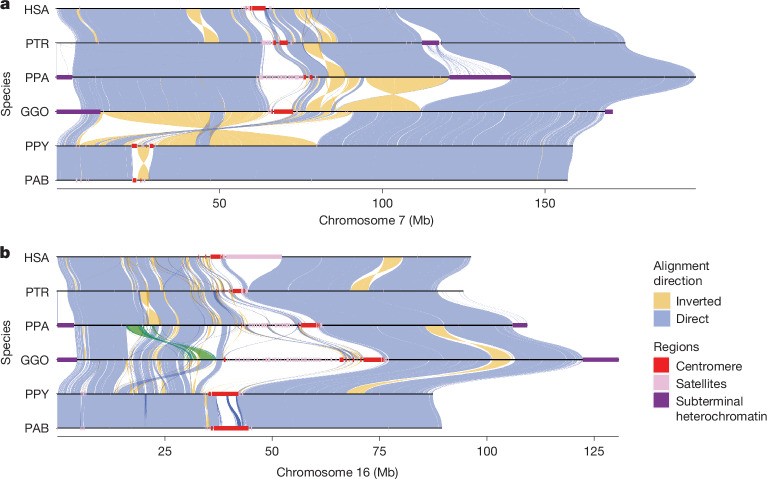
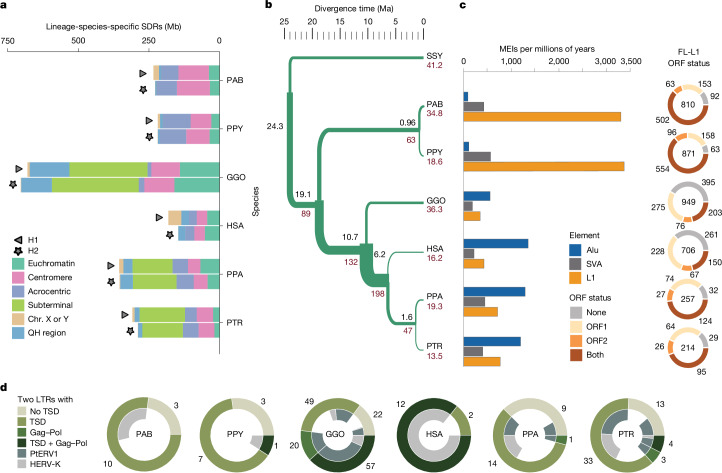
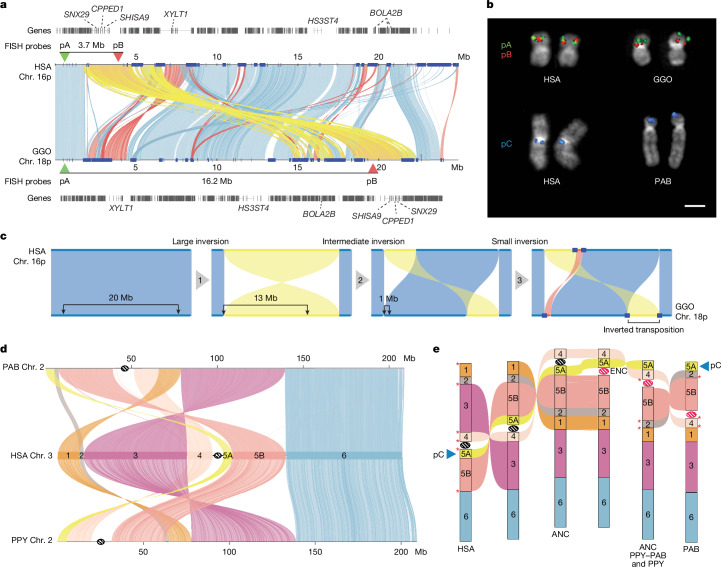
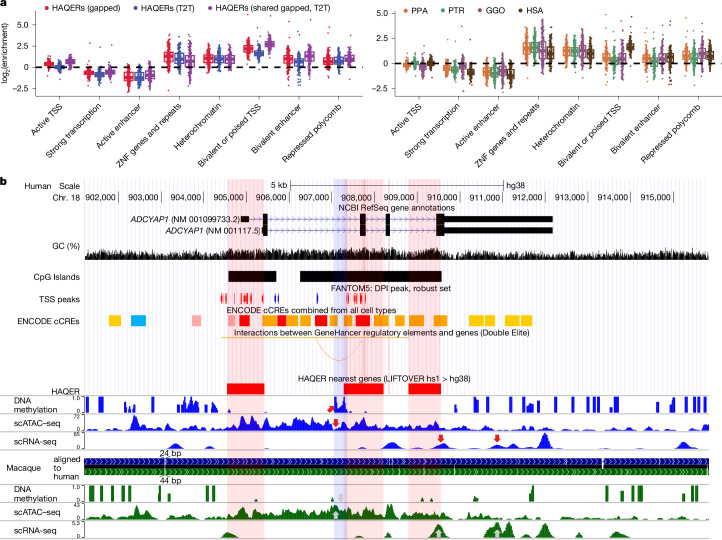
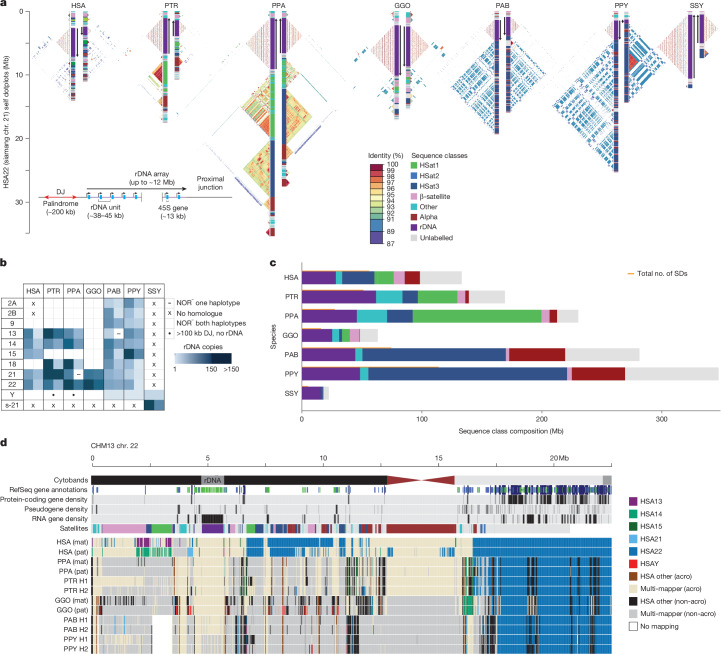
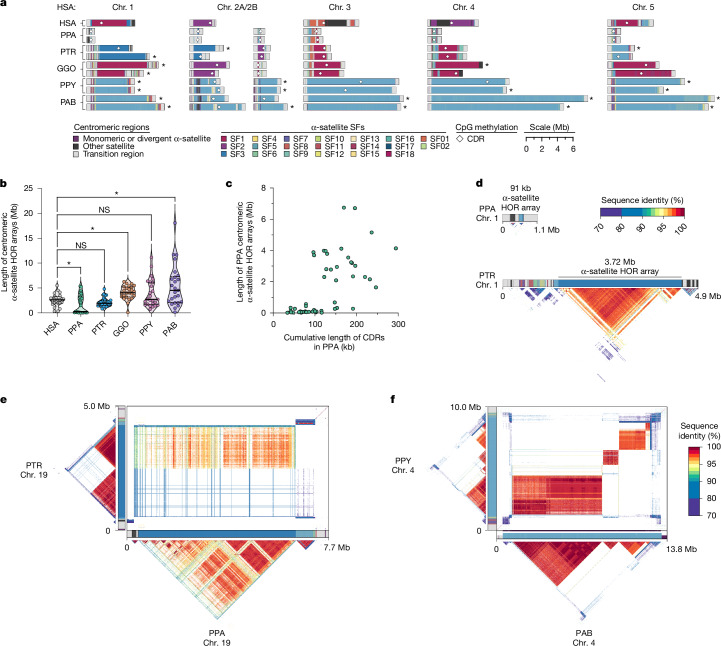
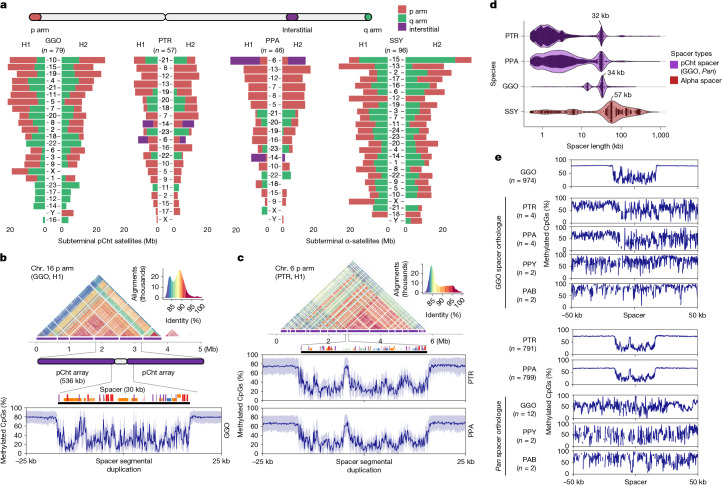
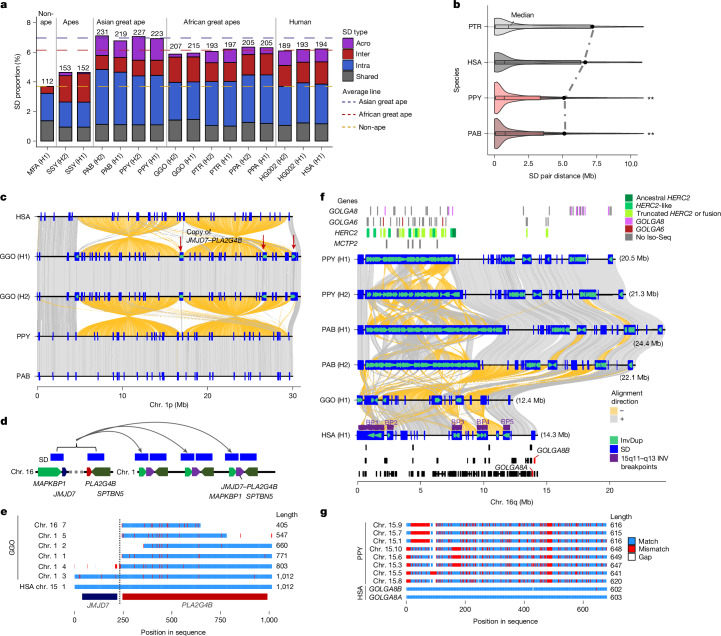
The most dynamic and repetitive regions of great ape genomes have traditionally been excluded from comparative studies1-3. Consequently, our understanding of the evolution of our species is incomplete. Here we present haplotype-resolved reference genomes and comparative analyses of six ape species: chimpanzee, bonobo, gorilla, Bornean orangutan, Sumatran orangutan and siamang. We achieve chromosome-level contiguity with substantial sequence accuracy (<1 error in 2.7 megabases) and completely sequence 215 gapless chromosomes telomere-to-telomere. We resolve challenging regions, such as the major histocompatibility complex and immunoglobulin loci, to provide in-depth evolutionary insights. Comparative analyses enabled investigations of the evolution and diversity of regions previously uncharacterized or incompletely studied without bias from mapping to the human reference genome. Such regions include newly minted gene families in lineage-specific segmental duplications, centromeric DNA, acrocentric chromosomes and subterminal heterochromatin. This resource serves as a comprehensive baseline for future evolutionary studies of humans and our closest living ape relatives.


Conflict of interest statement

Competing interests: E.E.E. is a scientific advisory board member of Variant Bio. C.T.W. is a co-founder and Chief Scientific Officer of Clareo Biosciences. W.L. is a co-founder and Chief Technology Officer of Clareo Biosciences. The other authors declare no competing interests.

Figures

Fig. 1
Fig. 1. Chromosomal-level assembly of complete genomes for great apes.
a,b, A comparative alignment of HSA7 (a) and HSA16 (b) compared with syntenic chromosomes from chimpanzee, bonobo, gorilla, Bornean orangutan and Sumatran orangutan. Each chromosome is compared with the chromosome below in this stacked representation using the tool SVbyEye (https://github.com/daewoooo/SVbyEye). Regions of collinearity and synteny (positive in blue) are contrasted with inverted regions (negative in yellow) and with regions beyond the sensitivity of minimap2 (homology gaps), including centromeres, subterminal and interstitial heterochromatin or other regions of satellite expansion. A single transposition (green in b) relocates about 4.8 Mb of gene-rich sequence in gorilla from HSA16p13.11 to HSA16p11.2 (see Fig. 3 for more detail).
Fig. 2
Fig. 2. Divergent regions and repeats.
a, The number of lineage-specific SDRs detected on two haplotypes (H1 and H2) and classified by different genomic content. QH region, heterochromatic q-banded satellite-containing region. b, Ape phylogeny with speciation times in millions of years (black) and effective population size (Ne) in thousands (red) for terminal and ancestral nodes. For Ne, values in inner branches refer to TRAILS estimates, whereas that of terminal nodes is predicted using MSMC2 considering the harmonic mean of the Ne after the last inferred split. c, Left, species-specific Alu, SVA and L1 mobile element insertion (MEI) counts normalized by millions of years (using speciation times from b). Right, species-specific full-length (FL) L1 ORF status. The inner number in each circle represents the absolute count of species-specific FL L1 elements. d, Species-specific ERV retrotransposons depict PtERV1 and HERV-K elements (inner ring) and long terminal repeats (LTRs) and potential protein-coding domains (outer ring). TSD, target-site duplication.
Fig. 3
Fig. 3. Inversions and evolutionary rearrangements in great apes.
a, Alignment plot of gorilla chromosome 18p and HSA16p shows a 4.8 Mb inverted transposition (yellow). SDs are shown with blue rectangles. b, Experimental validation of the gorilla chromosome 18 inverted transposition using FISH with probes pA (CH276-36H14) and pB (CH276-520C10), which overlap in human metaphase chromosomes. The transposition moves the red pB probe further away from the green pA probe in gorillas, resulting in two distinct signals. FISH on metaphase chromosomes using probe pC (RP11-481M14) confirmed the location of a new inversion to the terminal end of the short arm of PAB chromosome 2. Each FISH experiment was repeated three times, and ten metaphase spreads with the corresponding fluorochromes were captured for each experiment. Scale bar, 1 µm. c, An evolutionary model for the generation of the inverted transposition through a series of inversions mediated by SDs. d, Alignment plot of orangutan chromosome 2 homologues to HSA3 highlights a more complex organization than previously known by cytogenetics: a new inversion of block 5A is mapping at the terminal end of the short arm of chromosome 2 in both PAB and PPY. e, A model of serial inversions requires three inversions and one centromere repositioning event (ENC) to create PPY chromosome 2, and four inversions and one ENC for PAB. Red asterisks show the location of SDs mapping at the seven out of eight inversion breakpoints. ANC, ancestor.
Fig. 4
Fig. 4. AQERs.
a, Left, HAQER sets identified in gapped (GRCh38) and T2T assemblies show enrichments for bivalent gene regulatory elements across 127 cell types and tissues, with the strongest enrichment observed in the set of HAQERs shared between the two analyses. Right, the tendency for HAQERs to occur in bivalent regulatory elements (defined using human cells and tissues) is less strong in the sets of bonobo, chimpanzee and gorilla AQERs. n = 127 biologically independent samples for each chromatin state. Boxes show the interquartile range and median, with whiskers showing data points within 1.5 times the s.d. b, HAQERs in the vocal-learning-associated gene ADCYAP1, marked as containing alternative promoters near transcription start site (TSS) peaks of the FANTOM5 CAGE analysis, candidate cis-regulatory elements (cCREs) from ENCODE and enhancers (ATAC–seq peaks). For the latter, humans have a unique methylated region in layer 5 extratelencephalic projection neurons of the primary motor cortex. Tracks (blue for human, green for macaque) are modified from the UCSC Genome Browser above the HAQER annotations and the comparative epigenome browser below the HAQER annotations. For the NCBI RefSeq annotations, GCF_000001405.40-RS_2023_10 release (11 October 2024) was used. For CpG islands, islands <300 bp are in light green.
Fig. 5
Fig. 5. Organization and sequence composition of the ape acrocentric chromosomes.
a, Sequence identity heatmaps and satellite annotations for the NOR+ short arms of both HSA22 haplotypes across all the great apes and siamang chromosome 21 (the only NOR+ chromosome in siamang) drawn with ModDotPlot. The short-arm telomere is oriented at the top of the plot, with the entirety of the short arm drawn to scale up to but not including the centromeric α-satellite. Heatmap colours indicate self-similarity in the chromosome, and large blocks indicate tandem repeat arrays (rDNA and satellites) with their corresponding annotations given in between. Human is represented by the diploid HG002 genome. b, Estimated number of rDNA units per haplotype for each species. HSA chromosome numbers are given in the first column, with the exception of s-21 for siamang chromosome 21, which is NOR+ but has no single human homologue. c, Sum of satellite and rDNA sequences across all short arms for which one haplotype is NOR+ in each species. ‘Unlabelled’ indicates sequences without a satellite annotation, which mostly comprise SDs. The total number of SD bases is given for comparison, with some overlap between regions annotated as SDs and satellites. Colours for sequence classes are as for a. d, Top tracks, chromosome 22 in the T2T-CHM13v2.0 reference genome displaying various gene-annotation metrics and the satellite annotation. Bottom tracks, for each primate haplotype, including the human HG002 genome, the chromosome that best matches each 10 kb window of T2T-CHM13 chromosome 22 is colour coded, as determined by MashMap. On the right side of the centromere (towards the long arm), HSA22 is syntenic across all species; however, on the short arm, synteny rapidly degrades, with very few regions mapping uniquely to a single chromosome, a result reflective of extensive recombination on the short arms. Even the human HG002 genome does not consistently align to T2T-CHM13 chromosome 22 in the most distal (left-most) regions. acro, acrocentric; mat, maternal; pat, paternal.
Fig. 6
Fig. 6. Assembly of 237 NHP centromeres reveals variation in α-satellite HOR array size, structure and composition.
a, Sequence and structure of α-satellite HOR arrays from the human (T2T-CHM13), bonobo, chimpanzee, gorilla, Bornean orangutan and Sumatran orangutan chromosome 1–5 centromeres, with the α-satellite SF indicated for each centromere. The sequence and structure of all completely assembled centromeres is shown in Supplementary Fig. XIX.66. b, Variation in the length of the α-satellite HOR arrays for NHP centromeres. Bonobo centromeres have a bimodal length distribution, with 28 chromosomes showing minicentromeres (with α-satellite HOR arrays <700 kb long); two-tailed Mann–Whitney test, *P < 0.05; NS, not significant (compared to human, *P = 0.044, P = 0.103, *P = 0.0001, P = 0.287 and *P = 0.0099 for bonobo, chimpanzee, gorilla, Bornean and Sumatran orangutans, respectively). c, Correlation between the length of the bonobo active α-satellite HOR array and the length of the CDR for the same chromosome. d, Example showing that bonobo and chimpanzee chromosome 1 centromeres are divergent in size despite being from orthologous chromosomes. e, Sequence identity heatmap between the chromosome 17 centromeres from bonobo and chimpanzee show a common origin of sequence as well as the birth of new α-satellite HORs in the chimpanzee lineage. f, Sequence identity heatmap between chromosome 5 centromeres from the Bornean and Sumatran orangutans show highly similar sequence and structure, except for one pocket of α-satellite HORs that is only present in the Bornean orangutan. For df, data are for haplotype 1.
Fig. 7
Fig. 7. Subterminal heterochromatin analyses.
a, Overall quantification of subterminal pCht and α-satellites in the African great ape and siamang genomes for haplotypes 1 and 2. The number of regions containing the satellite is indicated below the species acronym. The pCht arrays of diploid genomes are quantified by megabases, for ones located in the p arm, the q arm and the interstitial region. b,c, Organization of the subterminal satellite in gorillas (b) and the Pan lineages (c). The top shows a StainedGlass alignment plot indicating pairwise identity between 2-kb-binned sequences, followed by the higher order structure of subterminal satellite units, as well as the composition of the hyperexpanded spacer sequence and the methylation status across the 25 kb upstream or downstream areas of the spacer midpoint. The average per cent of CpG methylation is indicated as a blue line, and the band of lighter blue represents the s.d. of the methylation. d, Size distribution of spacer sequences identified between subterminal satellite arrays. e, Methylation profile of the subterminal spacer SD sequences compared to the interstitial orthologue copy.
Fig. 8
Fig. 8. Ape SDs and new genes.
a, Comparative analysis of primate SDs comparing the proportion of acrocentric (Acro), interchromosomal (Inter), intrachromosomal (Intra) and shared interchromosomal and intrachromosomal SDs (Shared). The total SD megabases per genome is indicated above each histogram, with the coloured dashed lines showing the average Asian, African great ape and non-ape SD (MFA, Macaca fascicularis; see Supplementary Fig. XXI.71 for additional non-ape species comparison). b, A violin plot distribution of pairwise SD distance to the closest paralogue for which the median (black line) and mean (dashed line) are compared for different apes (see Supplementary Fig. XXI.72 for all species and haplotype comparisons; n = 17,703, 17,800, 19,979 and 21,066 of SD pairs for chimpanzees, humans and Bornean and Sumatran orangutans, respectively). The box indicates the interquartile range. An excess of interspersed duplications (one-sided Wilcoxon rank sum test; P < 2.2 × 10−16) was observed for chimpanzees and humans when compared to orangutans. c, Alignment view of chromosome 1 double-inversion for gorillas. Positive alignment direction is indicated in grey and negative as yellow. SDs and those with inverted orientations are indicated by blue rectangles and green arrowheads. The locations where the JMJD7–PLA2G4B gene copies were found are indicated by the red arrows. d, Duplication unit containing three genes, including JMJD7–PLA2G4B. e, Multiple sequence alignment of the translated JMJD7–PLA2G4B predicated protein-coding genes. Each sequence is represented by chromosome number and copy number index. Match, mismatch and gaps are indicated with respect to their position in the linear amino acid sequence by blue, red and white, respectively. Regions corresponding to each of JMJD7 or PLA2G4B are indicated by the track below. Data are for haplotype 1. f, Alignment view of chromosome 16q. The expansion of GOLGA6, GOLGA8, HERC2 and MCTP2 genes are presented in the top track. Recurrent inversions between species (yellow) are projected to the human genome with respect to genomic disorder breakpoints (BP1–BP5) at chromosome 15q. The track at the bottom indicates the gene track with GOLGA8 human orthologue in red. InvDup, inverted duplications. g, Multiple sequence alignment of the translated GOLGA8.
Extended Data Fig. 1
Extended Data Fig. 1. The siamang genome.
A schematic of the T2T siamang genome highlighting segmental duplications (Intra SDs; blue), inverted duplications (InvDup; green), centromeric, subterminal and interstitial α-satellites (red), and other satellites (pink). Note the large blocks of alpha-satellite defining the siamang subterminal heterochromatic caps.
Extended Data Fig. 2
Extended Data Fig. 2. IG and TR genome organization in apes.
a) Annotated haplotypes of IGH, IGK, IGL, TRA/D, TRB, and TRG loci across four primate species and one human haplotype (HSA.h1 or T2T-CHM13). Each haplotype is shown as a line in the genome diagram where the top part shows positions of shared V genes (blue), species-specific V genes (red), D genes (orange), and J genes (green) and the bottom part shows segmental duplications (SDs) that were computed for a haplotype pair of the same species and depicted as dark blue rectangles. Human SDs were computed with respect to the GRCh38.p14 reference. Alignments between pairs in haplotypes are shown as links colored according to their percent identity values: from blue (< 90%) through yellow (99.5%) to red (100%). The bar plot on the right from each genome diagram shows counts of shared and species-specific V genes in each haplotype. b) Barplots showing the mean percentage of base pairs for each IG/TR locus covered by SDs computed between haplotypes of the same species and collected across five ape species; n = 9 haplotypes including 8 haplotypes of nonhuman ape species and the human T2T haplotype. Here and in panel c, error bars represent the 95% confidence intervals. c) Barplots showing length differences (%) computed for all ape IG/TR loci with respect to the corresponding human T2T locus; n = 8 haplotypes of nonhuman ape species. d) Counts of species-specific V genes vs. fractions of locus covered by long (≥ 10 kbp) repeats computed for IG/TR loci across five great ape species. Pearson’s correlation and p-value (p = 6.95 × 10⁻⁵) are shown on the top of the plot.
Extended Data Fig. 3
Extended Data Fig. 3. Ape MHC organization.
a and b) show schematic representation of MHC locus organization for MHC-I and MHC-II genes, respectively, across the six ape haplotypes (PTR.h1/h2, PPA.h1/h2, GGO.h1/h2, PPY.h1/h2, PAB.h1/h2, SSY.h1/2) and human (HSA.h1). Only orthologs of functional human HLA genes are shown. Loci naming in apes follows human HLA gene names (HSA.h1) with the exception of Gogo-OKO that does not have a human homolog, and orthologs are represented in unique colors across haplotypes and species. Orthologous genes that lack a functional coding sequence are grayed out and their name marked with an asterisk. Two human HLA class I pseudogene (HLA-H, HLA-J) are shown, because functional orthologs of these genes were identified in some apes. c) Pairwise alignment of the 5.31 Mbp MHC region in the genome, with human gene annotations and MHC-I and MHC-II clusters. Below is the variation in phylogenetic tree topologies according to the position in the alignment. The x-axis is the relative coordinate for the MHC region and the y-axis shows topology categories for the trees constructed. The three prominent subregions with highly discordant topologies are shown through shaded boxes. Four subregions (1-4) used to calculate coalescence times are shown with dashed boxes. The phylogenetic tree includes the macaque genome (MFA) to better estimate the deep coalescence time observed at this locus. Numbers indicate time estimated in millions of years.

Update of

  • Complete sequencing of ape genomes.
    Yoo D, Rhie A, Hebbar P, Antonacci F, Logsdon GA, Solar SJ, Antipov D, Pickett BD, Safonova Y, Montinaro F, Luo Y, Malukiewicz J, Storer JM, Lin J, Sequeira AN, Mangan RJ, Hickey G, Anez GM, Balachandran P, Bankevich A, Beck CR, Biddanda A, Borchers M, Bouffard GG, Brannan E, Brooks SY, Carbone L, Carrel L, Chan AP, Crawford J, Diekhans M, Engelbrecht E, Feschotte C, Formenti G, Garcia GH, de Gennaro L, Gilbert D, Green RE, Guarracino A, Gupta I, Haddad D, Han J, Harris RS, Hartley GA, Harvey WT, Hiller M, Hoekzema K, Houck ML, Jeong H, Kamali K, Kellis M, Kille B, Lee C, Lee Y, Lees W, Lewis AP, Li Q, Loftus M, Loh YHE, Loucks H, Ma J, Mao Y, Martinez JFI, Masterson P, McCoy RC, McGrath B, McKinney S, Meyer BS, Miga KH, Mohanty SK, Munson KM, Pal K, Pennell M, Pevzner PA, Porubsky D, Potapova T, Ringeling FR, Roha JL, Ryder OA, Sacco S, Saha S, Sasaki T, Schatz MC, Schork NJ, Shanks C, Smeds L, Son DR, Steiner C, Sweeten AP, Tassia MG, Thibaud-Nissen F, Torres-González E, Trivedi M, Wei W, Wertz J, Yang M, Zhang P, Zhang S, Zhang Y, Zhang Z, Zhao SA, Zhu Y, Jarvis ED, Gerton JL, Rivas-González I, Paten B, Szpiech ZA, Huber CD, Lenz TL, Konkel MK, Yi SV, Canzar S, Watson CT, Sudma… See abstract for full author list ➔ Yoo D, et al. bioRxiv [Preprint]. 2024 Oct 5:2024.07.31.605654. doi: 10.1101/2024.07.31.605654. bioRxiv. 2024. Update in: Nature. 2025 May;641(8062):401-418. doi: 10.1038/s41586-025-08816-3. PMID: 39131277 Free PMC article. Updated. Preprint.

References

    1. International Human Genome Sequencing Consortium. Initial sequencing and analysis of the human genome. Nature409, 860–921 (2001). - PubMed
    1. Venter, J. C. et al. The sequence of the human genome. Science291, 1304–1351 (2001). - PubMed
    1. Blanchette, M., Green, E. D., Miller, W. & Haussler, D. Reconstructing large regions of an ancestral mammalian genome in silico. Genome Res.14, 2412–2423 (2004). - PMC - PubMed
    1. The Chimpanzee Sequencing and Analysis Consortium. Initial sequence of the chimpanzee genome and comparison with the human genome. Nature437, 69–87 (2005). - PubMed
    1. Gordon, D. et al. Long-read sequence assembly of the gorilla genome. Science352, aae0344 (2016). - PMC - PubMed

Publication types

Substances

LinkOut - more resources