. 2025 Jun;642(8067):519-526.
doi: 10.1038/s41586-025-08876-5. Epub 2025 Apr 9.

Swinging lever mechanism of myosin directly shown by time-resolved cryo-EM

Affiliations

Swinging lever mechanism of myosin directly shown by time-resolved cryo-EM

David P Klebl et al. Nature. 2025 Jun.

Abstract

Myosins produce force and movement in cells through interactions with F-actin1. Generation of movement is thought to arise through actin-catalysed conversion of myosin from an ATP-generated primed (pre-powerstroke) state to a post-powerstroke state, accompanied by myosin lever swing2,3. However, the initial, primed actomyosin state has never been observed, and the mechanism by which actin catalyses myosin ATPase activity is unclear. Here, to address these issues, we performed time-resolved cryogenic electron microscopy (cryo-EM)4 of a myosin-5 mutant having slow hydrolysis product release5,6. Primed actomyosin was predominantly captured 10 ms after mixing primed myosin with F-actin, whereas post-powerstroke actomyosin predominated at 120 ms, with no abundant intermediate states detected. For detailed interpretation, cryo-EM maps were fitted with pseudo-atomic models. Small but critical changes accompany the primed motor binding to actin through its lower 50-kDa subdomain, with the actin-binding cleft open and phosphate release prohibited. Amino-terminal actin interactions with myosin promote rotation of the upper 50-kDa subdomain, closing the actin-binding cleft, and enabling phosphate release. The formation of interactions between the upper 50-kDa subdomain and actin creates the strong-binding interface needed for effective force production. The myosin-5 lever swings through 93°, predominantly along the actin axis, with little twisting. The magnitude of lever swing matches the typical step length of myosin-5 along actin7. These time-resolved structures demonstrate the swinging lever mechanism, elucidate structural transitions of the power stroke, and resolve decades of conjecture on how myosins generate movement.


Conflict of interest statement

Competing interests: The authors declare no competing interests.

Figures

Fig. 1
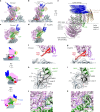
Fig. 1. Structure of the primed actomyosin-5 complex.
a,b, Cryo-EM density map of the primed actomyosin-5 complex, segmented and coloured by myosin subdomains and actin chains as indicated (with the central three actin subunits displayed). Actin subunits are shown in slate grey (−actin, nearer the filament pointed (−) end), blue-grey (+actin, nearer the barbed (+) end) and light grey; the nucleotide is shown in sky blue. The map is thresholded to show secondary structure (myosin 0.085, actin 0.2) and is shown in side view of F-actin (a) and in end-on view of F-actin, looking towards the pointed end (b). c, Backbone depiction of a pseudo-atomic model of primed actomyosin-5, fitted into the EM density map, viewed as in b. d, Magnified side view of the actomyosin interface; the main contacts are made by the myosin HLH motif and loop 3, as observed in strongly bound states. e, Additional contacts are made by loop 2 (EM density threshold 0.007). Relevant interacting residues are labelled and shown. f, The lever helix points along the actin axis towards the pointed end, at an angle of about 52° to the actin axis. g, Magnified view showing the N-terminal residues (D1 and E2) of the −actin subunit (slate grey), interacting with helix W (H637 and N641) of the L50 domain, and loop 2 (H631) (EM density threshold 0.007). A DeepEMhancer post-processed map is depicted in ad,f, and a RELION post-processed map is depicted in e,g.
Fig. 2
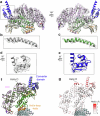
Fig. 2. Comparison of myosin structure in the primed actomyosin complex with unbound primed myosin.
a, Superposition of the primed actomyosin (coloured as in Fig. 1) and unbound primed myosin (forest green) aligned on the core primed actomyosin interface (HLH motif, residues 505–530). View towards actin pointed end. b, Corresponding root mean squared deviation (r.m.s.d.) of myosin residues between primed actomyosin and primed myosin, showing that the greatest movement occurs in helix D. c, The whole U50 is rocked back, around the actin axis, towards the converter domain, resulting in the HCM loop and loop 4 moving away from the actin surface. The activation loop also extends down, reaching out to the actin surface. d,e, Unbound primed myosin (d) and primed actomyosin (e) models focused on helix D, Y119, Y175 and nucleotide, overlaid with their respective cryo-EM maps, thresholded equivalently. f, Overlay of d,e showing movement of helix D following binding of myosin to actin causes rearrangement of the tyrosine residues Y119 and Y175, resulting in larger freedom of placement of ADP in the nucleotide-binding pocket. The Pi is anchored by interactions with P-loop (S165), helix F (K169) and switch 1 (N214 and S218). A primed actomyosin RELION post-processed map is depicted throughout.
Fig. 3
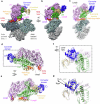
Fig. 3. Structural changes during the power stroke.
a,b, Primed actomyosin structure (as shown in Fig. 1a; a) and the corresponding view of the postPS actomyosin structure (b) with lever positions indicated by a black arrow. The lever swings about 93° between structures. c,d, In the end-on view, primed actomyosin is observed to have an open actin-binding cleft (c), whereas postPS actomyosin has a closed cleft (d). e, In the top view, vectors depict the movement of myosin residue Cα atoms between primed and postPS actomyosin states. The biggest motions are attributable to lever swing, U50 rotation and binding to actin, and movement of the N-terminal domain. Schematic representations are shown of primed actomyosin in side view (to the left of f), end-on view towards the barbed end of F-actin (left of h) and end-on view towards the pointed end of F-actin (left of j), with dashed boxes illustrating the area of the structure highlighted in f and g, h and i, and j and k, respectively. f,g, The HCM loop and loop 4 are distant from the actin surface in the primed state (f) but interact with actin in the postPS state (g). The EM density is segmented and coloured by myosin subdomain (contour level 0.008). h,i, N-terminal actin interactions with loop 2 and helix W are changed between primed (h) and postPS (i) states. j,k, Nucleotide-binding site in primed (j) and postPS (k) structures. The EM density is segmented and coloured by myosin subdomain (contour level primed, 0.0085; postPS, 0.18). The backdoor (salt bridge between R219 and E442) is opened through rotation of the U50 and switch 1 and P-loop moving away from switch 2 (see Supplementary Video 3 and EM density maps). A DeepEMhancer post-processed map is depicted in ad,f,g), and a RELION post-processed map is depicted in hk.
Fig. 4
Fig. 4. Models of myosin force generation and ATPase activation on F-actin.
ad, Force generation (upper row: end-on view; lower row: side view). eh, ATPase activation. a, Primed myosin initially binds weakly to actin through electrostatic interactions of loop 2 with actin subdomain 1. This brings the L50 of myosin near to the actin surface, enabling formation of the stereospecific primed actomyosin state. b, HLH binding enables the actin N-terminal residues 1–2 to interact with helix W and loop 2, resulting in the U50 being cocked back towards the converter domain, rotated around the F-actin axis. c, Rearrangement of N-terminal actin interactions with helix W and loop 2 results in loop 2 stabilization at its C-terminal end. This shortens loop 2, rotating the U50 and attracting the negatively charged strut to positively charged loop 2, promoting cleft closure. d, Cleft closure results in the strong-binding interface needed to sustain force and concomitantly results in twisting of the transducer, straightening of the relay helix and lever swing. e, In the unbound primed state, the backdoor is closed, prohibiting Pi release. f, Following binding of primed myosin to actin, cocking back of the U50 towards the converter creates strain in the nucleotide pocket, with the ADP drawn away from the well-coordinated Pi, prohibiting reversal of hydrolysis and promoting Pi release. g, As the U50 rotates, and the initial interactions between the U50 and the actin surface are formed, switch 1 and the P-loop are displaced relative to switch 2, the backdoor is opened, and Pi is squeezed out into the Pi release tunnel. h, In the postPS state, Pi has been released, the lever has swung and the backdoor is open. Pi re-entry into the nucleotide pocket is highly unfavourable.
Fig. 5
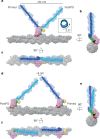
Fig. 5. Myosin-5 working stroke and walking on F-actin.
a, Overlay of primed and postPS actomyosin structures with full-length levers, coloured in dark blue and cyan, respectively, on actin in side view. A working stroke of approximately 34 nm is seen as well as little rotation of the lever, as highlighted. b,c, End-on (b) and top (c) views of the actin filament show a very small azimuthal displacement of the lever tips (7°). df, When a postPS and a primed myosin are positioned 13 actin subunits apart, the two lever ends are close, as observed in side (d), end-on (e) and top (f) views of the actin filament. Note that this actin filament has a rotation per subunit of −166.6°. Small changes in this value change the relationship of the lever ends in df.
Extended Data Fig. 1
Extended Data Fig. 1. Time dependence of the proportion of primed state actomyosin.
Proportion of the primed state vitrified at 10 ms or 120 ms after mixing myosin and F-actin. Shown is the mean as grey bars and replicates as black points, n = 3 biologically independent (discrete) experiments for the 10 ms and 120 ms time points respectively.
Extended Data Fig. 2
Extended Data Fig. 2. Molecular dynamics analysis of actin N-terminal interactions with myosin loop2, helixW and the activation loop.
a,b, Portion of the primed actomyosin density map and fitted structures, displaying the putative interactions between -actin’s N-terminal region and myosin (a) helixW/loop2 and (b) activation loop. ch, Time courses of the distance between atoms involved in interactions in primed actomyosin during three 100 ns molecular dynamics simulations (cyan, sea green, blue). Each interaction is identified at the top of its panel. ACE refers to the oxygen atom of the acetyl group of -actin D1. i,j, Same as a,b but showing the equivalent views for the postPS structure. kp, Same as ch but showing time courses of putative interactions in the postPS structure. For all time courses, the average % time that the interatomic distance is within bonding range (3.3 Å; horizontal dotted line in each time course) across the three replicates is shown in the top left of each plot, and within Extended Data Table 2. Note that the most significant change in distance between atoms involved in interactions is for E2(OE1)-N641(ND2) shown in panel e. This is because, within the simulations, E2 switched between interacting with N641(ND2) via its OE1 and its OE2 atom. N641 also switches side chain position to form metastable interactions with H637. Despite these alternative interactions, the interaction shown is populated the most (48 % of the time).
Extended Data Fig. 3
Extended Data Fig. 3. Atomic model of myosin-5a in the primed state.
a, The EM density map of unbound myosin-5 with the crystal structure (PDB ID 4zg4) fitted directly (grey) and after flexible fitting (with subdomains colored, U50 pink, L50 green, N-term gold, converter blue, HLH orange). b, Relay helix from PDB ID 4zg4 fitted into EM density map for unbound myosin-5 directly and c, after flexible fitting. d, Converter domain of PDB ID 4zg4 fitted into EM density map for unbound myosin-5 directly and e, after flexible fitting. f, Global superposition of the primed actomyosin-5 (coloured as in Fig. 1) and unbound primed myosin-5 (coloured olive green) shows a similar structure with no significant changes in domain architecture. g, r.m.s.d. of myosin residues between primed actomyosin and primed myosin.
Extended Data Fig. 4
Extended Data Fig. 4. RMSD between primed and postPS actomyosin structures.
ac, Primed actomyosin PDB coloured by RMSD between primed and postPS actomyosin shown in a, end-on view of F-actin, looking towards the pointed end with myosin bound to the top of the actin; b, side view; c, top view, looking down over the motor domain. df, The same views as ac respectively, but with vector arrows (in black) showing displacement in relative Cα positions between primed and postPS actomyosin motor domains.
Extended Data Fig. 5
Extended Data Fig. 5. PostPS actomyosin structure.
CryoEM density map of the postPS actomyosin-5 complex, segmented and coloured by myosin subdomains and actin chains as indicated (with central three actin subunits displayed). Map thresholded to show secondary structure (threshold 0.15). Shown in (a) side view of actin and in (b) in end-on view of F-actin, looking toward the pointed end. c, Backbone depiction of atomic model of postPS actomyosin-5, fitted into the EM density map, with view as in b. Actin subunits are shown in slate grey (−end), blue-grey (+end), and light grey. d, Magnified view of the U50, loop2, HCM loop and loop4 contacts to actin. Relevant interacting residues are labelled and shown with hydrophobic residues in yellow. e, Magnified view of the primed and postPS actomyosin states focused on the activation loop-actin N-terminal interaction interface to show formation of a salt bridge between K502 and E4 only in the postPS structure. f, PostPS nucleotide pocket fit to EM density (map threshold 0.0096). g, PostPS structure, focused on converter domain. The lever position is more consistent with that observed in previous actomyosin-5 rigor structures (purple pipes, PDB IDs: 7PLT, 7PLU, 7PLV, 7PLW, 7PLZ) than actomyosin-5 strong-ADP structures (turquoise pipes, PDB IDs: 7PM5, 7PM6, 7PM7, 7PM8, 7PM9). h, Nucleotide pocket of actomyosin structure 7PM5 fitted to our postPS EM density highlighting unfilled magnesium density with a dashed circle. i, Nucleotide pocket of actomyosin structure 7MP5 fitted to corresponding density EMDB ID: 13521 (map threshold 0.0197). DeepEMhancer post-processed map depicted in ad, g, and *RELION post-processed map in e,f,h,i.
Extended Data Fig. 6
Extended Data Fig. 6. Rigor actomyosin structure.
CryoEM density map of our rigor actomyosin-5 complex, segmented and coloured by myosin subdomains and actin chains as indicated (with central three actin subunits displayed). Map thresholded to show secondary structure (threshold 0.014). Shown in (a) side view of F-actin and (b) end-on view of F-actin, looking toward the pointed end. c, Backbone depiction of atomic model of rigor myosin-5 structure PDB ID 7PLV and actin from our postPS actomyosin-5 structure, rigidly fitted into the EM density map, with view as in b. Actin subunits are shown in slate grey (−end), blue-grey (+end), and light grey. d,e, Focused views of myosin-5 7PLV model in our rigor cryoEM density map segmented and coloured by myosin subdomains as in c (threshold 0.014). f, Magnified view of the rigor 7PLV converter domain fit to rigor cryoEM density map. g, Comparison of lever conformation between 7PLV rigor coloured as in d and postPS coloured grey, highlighting the 6° displacement of lever helix on ADP release (aligned on actin).
Extended Data Fig. 7
Extended Data Fig. 7. Actin structure.
Actin structure is preserved between (a) actin alone, (b) primed actomyosin, and (c) postPS actomyosin, except at the N-terminus where it becomes ordered when myosin binds. D-loop density also becomes more ordered when associated with myosin. The density observed for the N-terminal four residues of actin is absent in (d) vacant actin, and different between (e) primed actomyosin, and (f) postPS actomyosin. ACE denotes the acetyl group of D1.

References

    1. Hartman, M. A. & Spudich, J. A. The myosin superfamily at a glance. J. Cell Sci.125, 1627–1632 (2012). - PMC - PubMed
    1. Huxley, H. E. & Kress, M. Crossbridge behaviour during muscle contraction. J. Muscle Res. Cell Motil.6, 153–161 (1985). - PubMed
    1. Robert-Paganin, J., Pylypenko, O., Kikuti, C., Sweeney, H. L. & Houdusse, A. Force generation by myosin motors: a structural perspective. Chem. Rev.120, 5–35 (2020). - PubMed
    1. Klebl, D. P., White, H. D., Sobott, F. & Muench, S. P. On-grid and in-flow mixing for time-resolved cryo-EM. Acta Crystallogr. D77, 1233–1240 (2021). - PMC - PubMed
    1. Forgacs, E. et al. Switch 1 mutation S217A converts myosin V into a low duty ratio motor. J. Biol. Chem.284, 2138–2149 (2009). - PMC - PubMed