. 2025 Jun;31(6):2036-2043.
doi: 10.1038/s41591-025-03622-w. Epub 2025 Apr 9.

Plasma phospho-tau217 for Alzheimer's disease diagnosis in primary and secondary care using a fully automated platform

Affiliations

Plasma phospho-tau217 for Alzheimer's disease diagnosis in primary and secondary care using a fully automated platform

Sebastian Palmqvist et al. Nat Med. 2025 Jun.

Abstract

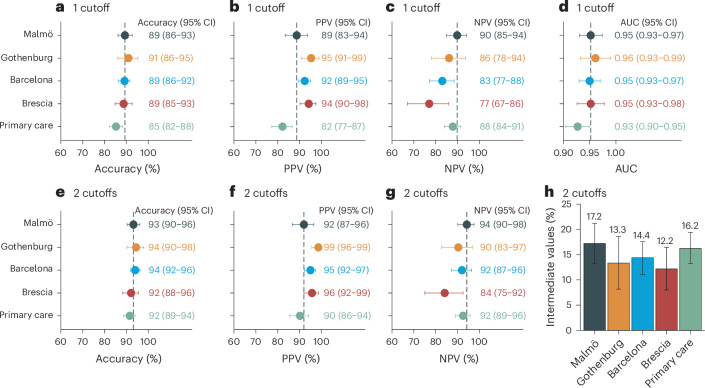
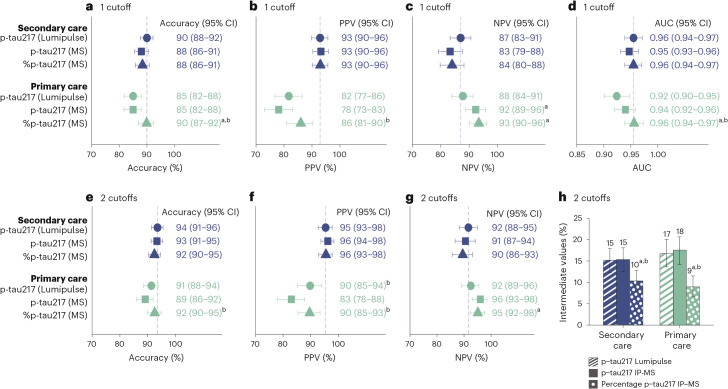
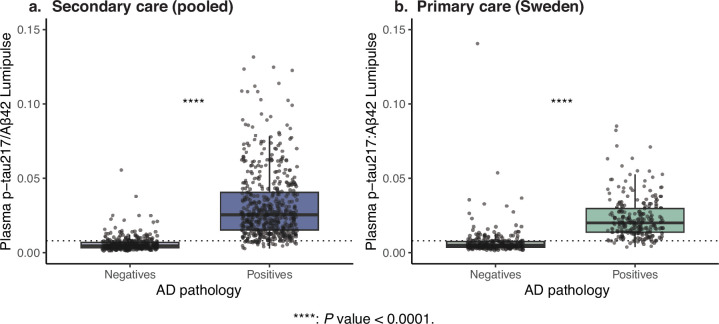
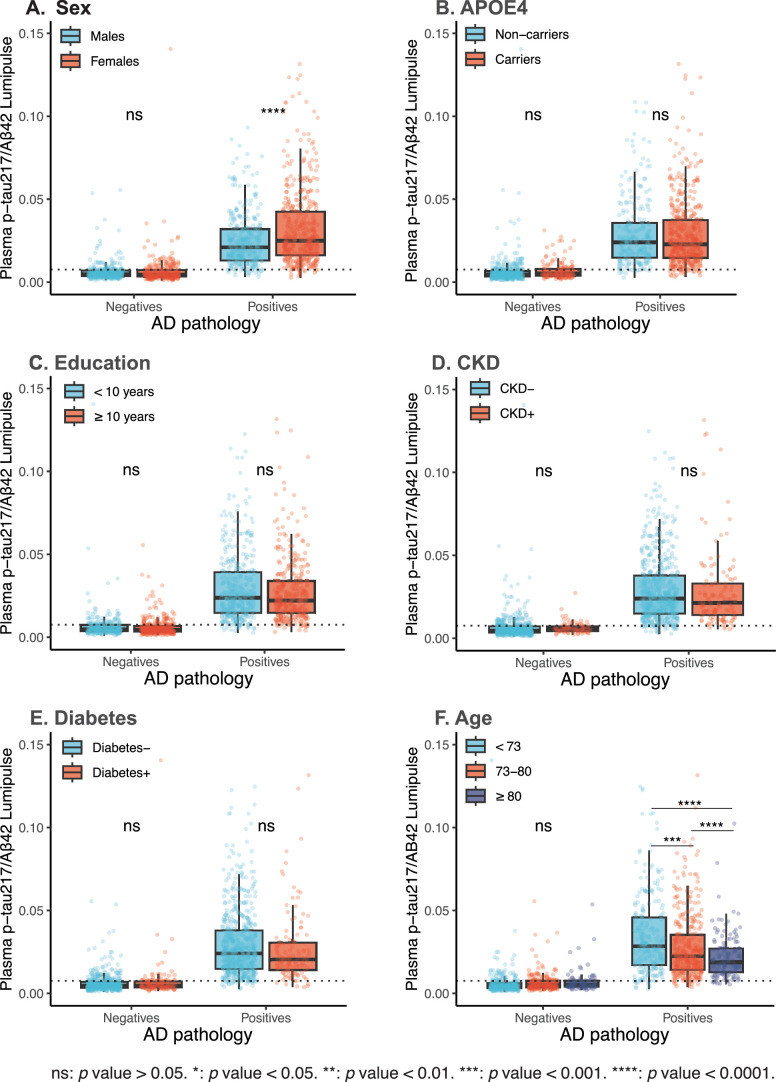
Global implementation of blood tests for Alzheimer's disease (AD) would be facilitated by easily scalable, cost-effective and accurate tests. In the present study, we evaluated plasma phospho-tau217 (p-tau217) using predefined biomarker cutoffs. The study included 1,767 participants with cognitive symptoms from 4 independent secondary care cohorts in Malmö (Sweden, n = 337), Gothenburg (Sweden, n = 165), Barcelona (Spain, n = 487) and Brescia (Italy, n = 230), and a primary care cohort in Sweden (n = 548). Plasma p-tau217 was primarily measured using the fully automated, commercially available, Lumipulse immunoassay. The primary outcome was AD pathology defined as abnormal cerebrospinal fluid Aβ42:p-tau181. Plasma p-tau217 detected AD pathology with areas under the receiver operating characteristic curves of 0.93-0.96. In secondary care, the accuracies were 89-91%, the positive predictive values 89-95% and the negative predictive values 77-90%. In primary care, the accuracy was 85%, the positive predictive values 82% and the negative predictive values 88%. Accuracy was lower in participants aged ≥80 years (83%), but was unaffected by chronic kidney disease, diabetes, sex, APOE genotype or cognitive stage. Using a two-cutoff approach, accuracies increased to 92-94% in secondary and primary care, excluding 12-17% with intermediate results. Using the plasma p-tau217:Aβ42 ratio did not improve accuracy but reduced intermediate test results (≤10%). Compared with a high-performing mass-spectrometry-based assay for percentage p-tau217, accuracies were comparable in secondary care. However, percentage p-tau217 had higher accuracy in primary care and was unaffected by age. In conclusion, this fully automated p-tau217 test demonstrates high accuracy for identifying AD pathology. A two-cutoff approach might be necessary to optimize performance across diverse settings and subpopulations.


Conflict of interest statement

Competing interests: S.P. acquired research support (for the institution) from Avid and ADDF through ki elements. In the past 2 years, he received consultancy or speaker fees from BioArtic, Biogen, Eisai, Eli Lilly, Novo Nordisk and Roche. N.M.-C. received consultancy/speaker from Biogen, Owkin and Merck. R.S. received speaker fees from Roche and Triolab. H.Z. served on scientific advisory boards and/or as a consultant for Abbvie, Acumen, Alector, Alzinova, ALZpath, Amylyx, Annexon, Apellis, Artery Therapeutics, AZTherapies, Cognito Therapeutics, CogRx, Denali, Eisai, Merry Life, Nervgen, Novo Nordisk, Optoceutics, Passage Bio, Pinteon Therapeutics, Prothena, Red Abbey Labs, reMYND, Roche, Samumed, Siemens Healthineers, Triplet Therapeutics and Wave, has given lectures in symposia sponsored by Alzecure, Biogen, Cellectricon, Fujirebio, Lilly, Novo Nordisk and Roche, and is a co-founder of Brain Biomarker Solutions in Gothenburg AB (BBS), which is a part of the GU Ventures Incubator Program (outside submitted work). R.O. received research funding or support from the ERC, ZonMw, NWO, National Institutes of Health, Alzheimer Association, Alzheimer Nederland, Stichting Dioraphte, Cure Alzheimer’s fund, Health Holland, ERA PerMed, Alzheimerfonden, Hjarnfonden, Avid Radiopharmaceuticals, Janssen Research & Development, Roche, Quanterix and Optina Diagnostics, has given lectures in symposia sponsored by GE Healthcare and is an advisory board member for Asceneuron and a steering committee member for Bristol Myers Squibb. All the aforementioned have been paid to the institutions. C.T. is supported by the Ministry of Health PRIN 2021 RePlast. A.P.‐P. served on advisory boards for Schwabe Farma Iberica. S.K. served on scientific advisory boards, and as a speaker and/or consultant for Roche, Eli Lilly, Geras Solutions, Optoceutics, Biogen, Eisai, Merry Life, Triolab, Novo Nordisk and BioArctic. A. Pilotto received travel grants from Abbvie, Bial, Lundbeck, Roche and Zambon pharmaceuticals, and personal compensation as a consultant or fees for lectures from Abbvie, Biogen and Lundbeck. A. Padovani received travel grants from Biougen, Lundbeck, Novonordisk, Roche pharmaceuticals, and personal compensation as a consultant or fees for lectures from Biogen, Lundbeck, Roche, Nutricia and General Healthcare (GE). K.B. served as a consultant and was on advisory boards for Acumen, ALZpath, AriBio, BioArctic, Biogen, Eisai, Lilly, Moleac Pte. Ltd, Novartis, Ono Pharma, Prothena, Roche Diagnostics and Siemens Healthineers, served at data monitoring committees for Julius Clinical and Novartis, has given lectures, produced educational materials and participated in educational programs for AC Immune, Biogen, Celdara Medical, Eisai and Roche Diagnostics, and is a co-founder of BBS, which is a part of the GU Ventures Incubator Program, outside the work presented in this paper. N.J.A. received consultancy or speaker fees from BioArtic, Biogen, Lilly, Quanterix and Alamar Biosciences. R.S. received a speaker’s fee from Roche. M.S.-C. received, in the past 36 months, consultancy or speaker’s fees (paid to the institution) from Almirall, Eli Lilly, Novo Nordisk and Roche Diagnostics. He received consultancy fees or served on advisory boards (paid to the institution) of Eli Lilly, Grifols, Novo Nordisk and Roche Diagnostics. He was granted a project and is a site investigator of a clinical trial (funded to the institution) by Roche Diagnostics. In-kind support for research (to the institution) was received from ADx Neurosciences, Alamar Biosciences, ALZpath, Avid Radiopharmaceuticals, Eli Lilly, Fujirebio, Janssen Research & Development, Meso Scale Discovery and Roche Diagnostics. M.S.-C. did not receive any personal compensation from these organizations or any other for-profit organization. O.H. is an employee of Eli Lilly and Lund University and previously acquired research support (for Lund University) from AVID Radiopharmaceuticals, Biogen, C2N Diagnostics, Eli Lilly, Eisai, Fujirebio, GE Healthcare and Roche. In the past 2 years, he received consultancy or speaker’s fees from ALZpath, BioArctic, Biogen, Bristol Meyer Squibb, Eisai, Eli Lilly, Fujirebio, Merck, Novartis, Novo Nordisk, Roche, Sanofi and Siemens. All C2N coauthors are salaried employees or consultants with cash and/or equity compensation from C2N Diagnostics. C2N Diagnostics performed the MS analyses blinded to any biomarker or clinical data and had no role in the statistical analysis or results. The other authors declare no competing interests.

Figures

Fig. 1
Fig. 1. Performance of plasma p-tau217 (Lumipulse) for discriminating AD pathology-positive versus AD pathology-negative participants in five independent cohorts.
ac,eg, The single cutoff was set at >0.27 pg ml−1 (accuracy (a), PPV (b) and NPV (c)) and the two cutoffs at <0.22 and >0.34 pg ml−1 (accuracy (e), PPV (f) and NPV (g)). Comparisons between primary and pooled secondary care are shown in Supplementary Table 1. d, Note that the AUC values are independent of cutoffs. h, Participants who fell between the two cutoffs were classified as intermediate. Vertical dashed lines mark the performance in the Malmö cohort where the cutoffs were established. Data are presented as the observed percentage and the error bars as the 95% CI derived from the bootstrap distribution. AD pathology was defined as CSF Aβ42:p-tau181 < 11.94 or positive visual read on amyloid PET if lumbar puncture was not performed (nmissing = 87 in primary care). The AD pathology prevalence was n = 153+ or 84− in Malmö, 93+ or 72− in Gothenburg, 321+ or 166− in Barcelona, 164+ or 66− in Brescia and 244+ or 305− in primary care (Sweden). Accuracy indicates percentage of correctly classified participants.
Fig. 2
Fig. 2. Effects of demographic factors and comorbidities on plasma p-tau217 (Lumipulse) performance.
ac, Accuracy using a single cutoff (a), two cutoffs (b) and AUC values (c). d, Participants with results between the two cutoffs classified as intermediate. The number of participants in each group, stratified by AD pathology, is indicated in a. Data are presented as the observed percentage and the error bars as the 95% CI derived from the bootstrap distribution. The analysis combined data from the five different cohorts (n = 1,767). The same analyses restricted to the primary care cohort can be found in Extended Data Fig. 3. AD pathology was defined as CSF Aβ42:p-tau181 < 11.94 or positive visual read on amyloid PET if lumbar puncture was not performed (n = 87). To assess whether the observed difference in the statistics is significantly different from zero, we performed a bootstrap hypothesis test. The P value (two sided) was calculated as the proportion of bootstrap resamples (n = 2,000) where the absolute null-distributed statistic was greater than or equal to the observed difference. Differences between AUCs were assessed using DeLong statistics. Results were not corrected for multiple comparisons. Significant P values in the order as presented in the plot: 0.046, 0.003 (a); 0.035, 0.026 (c); 0.034, <0.001, <0.001 (d). aSignificantly higher than group 1, P < 0.05. bSignificantly higher than group 2, P < 0.05. cSignificantly higher than group 3, P < 0.05.
Fig. 3
Fig. 3. Performance of plasma p-tau217 (Lumipulse) across cognitive stages.
ac, Using pooled data from all five cohorts (n = 1767), performance shown for participants with SCD (n = 250) (a), MCI (n = 858) (b) and dementia (n = 658) (c). Results are shown using a single cutoff (blue) or two cutoffs (red). Note that AUC values are independent of cutoffs. d, Participants who fell between the two cutoffs classified as intermediate. Data are presented as the observed percentage and the error bars as the 95% CI derived from the bootstrap distribution. AD pathology was defined as CSF Aβ42:p-tau181 < 11.94 or positive visual read on amyloid PET if lumbar puncture was not performed. To assess whether the observed difference in the statistics is significantly different from zero, we performed a bootstrap hypothesis test. The P value (two sided) was calculated as the proportion of bootstrap resamples (n = 2,000) where the absolute null-distributed statistic was greater than or equal to the observed difference. Differences between AUCs were assessed using DeLong statistics. Results were not corrected for multiple comparisons. Significant P values in the order as presented in the plot: 0.040, 0.001, 0.038 (a); <0.001, 0.046 (b); <0.001, 0.017, 0.024, 0.016 (c). aSignificantly higher than the SCD group, P < 0.05. bSignificantly higher than the MCI group, P < 0.05. cSignificantly higher than the dementia group, P < 0.05.
Fig. 4
Fig. 4. Comparison between plasma p-tau217 and p-tau217:Aβ42 (Lumipulse) for discriminating AD pathology-positive versus AD pathology-negative participants.
ac,eh, Pooled data from the secondary care cohorts (n = 911) and the primary care cohort (n = 502) examined. In the single cutoff approach (ac). The cutoffs were >0.27 pg ml−1 for p-tau217 and >0.008 pg ml−1 for p-tau217:Aβ42. In the two-cutoff approach, the cutoffs for p-tau217 were <0.22 pg ml−1 and >0.34 pg ml−1 and <0.007 pg ml−1 and >0.009 pg ml−1 for p-tau217:Aβ42 (eh). d, Note that the AUC values are independent of cutoffs. Cutoffs were established in the Malmö secondary care cohort (n = 337). Data are presented as the observed percentage and the error bars as the 95% CI derived from the bootstrap distribution. AD pathology was defined as CSF Aβ42:p-tau181 < 11.94 or positive visual read on amyloid PET if lumbar puncture was not performed. To assess whether the observed difference in the statistics is significantly different from zero, we performed a bootstrap hypothesis test. The P value (two sided) was calculated as the proportion of bootstrap resamples (n = 2,000) where the absolute null-distributed statistic was greater than or equal to the observed difference. Differences between AUCs were assessed using DeLong statistics. Results were not corrected for multiple comparisons. Significant P values in the order as presented in the plot: <0.001 (b); <0.001, 0.001 (c); 0.014 (e); <0.001, <0.001 (f); 0.007, 0.010 (g); <0.001, < 0.001 (h). *Significant difference between the two biomarkers (P < 0.05).
Fig. 5
Fig. 5. Comparisons between plasma Lumipulse p-tau217 and MS-based p-tau217 and %p-tau217 for discriminating AD pathology-positive versus AD pathology-negative participants.
Data from the pooled secondary care cohorts (n = 619) and the primary care cohort (n = 513) were examined. The secondary care cohorts consisted of participants from the Malmö (n = 337), Gothenburg (n = 164) or Brescia (n = 118) cohort with MS-based data available. Cutoffs were set in the Malmö secondary care cohort (n = 337). ac, In the single cutoff approach, the cutoffs were >0.27 pg ml−1 for Lumipulse p-tau217, >2.27 pg ml−1 for MS-based p-tau217 and >4.27 pg ml−1 for MS-based %p-tau217. eh, In the two-cutoff approach, the cutoffs for Lumipulse p-tau217 were <0.22 pg ml−1 and >0.34 pg ml−1, <1.59 pg ml−1 and >2.92 pg ml−1 for MS-based p-tau217 and <3.55 pg ml−1 and >5.08 pg ml−1 for MS-based %p-tau217. Data are presented as the observed percentage and the error bars as the 95% CI derived from the bootstrap distribution. AD pathology was defined as CSF Aβ42:p-tau181 < 11.94 or positive visual read on amyloid PET if lumbar puncture was not performed. To assess whether the observed difference in the statistics is significantly different from zero, we performed a bootstrap hypothesis test. The P value (two sided) was calculated as the proportion of bootstrap resamples (n = 2,000) where the absolute null-distributed statistic was greater than or equal to the observed difference. Differences between AUCs were assessed using DeLong statistics. Results were not corrected for multiple comparisons. Significant P values in the order as presented in the plot: 0.003, <0.001 (a); <0.001 (b); 0.020, 0.004, <0.001 (c); 0.006, 0.025 (d); 0.020 (e); 0.008, 0.006 (f); 0.014 (g); 0.003, <0.001, <0.001, <0.001 (h). aSignificantly better than Lumipulse p-tau217, P < 0.05. bSignificantly better than MS-based p-tau217, P < 0.05.
Extended Data Fig. 1
Extended Data Fig. 1. Boxplots of plasma p-tau217 (Lumipulse) concentrations in the different cohorts with AD pathology as grouping variable.
All p-tau217 levels differed significantly (P < 0.0001) between AD pathology-positive and AD pathology-negative participants in all cohorts, namely, Malmö (n = 337) (a), Gothenburg (n = 165) (b), Barcelona (n = 487) (c), Brescia (n = 230) (d), and in primary care (Sweden) (n = 548) (e). Horizontal dashed lines represent the single cutoff at 90% specificity established in (a) Secondary care Malmö. The dots represent individual participants. The central band of the boxplot represents the group median, the box limits correspond to the first and third quartiles, and the whiskers represent the minimum/maximum value or the 1.5 interquartile range (IQR) from the box, whichever is smaller. AD status was defined as CSF Aβ42/p-tau181 < 11.94 or positive amyloid PET visual read for those who did not undergo lumbar puncture. Group mean levels were compared with Student’s t-test. Abbreviations: AD, Alzheimer’s disease; IQR, interquartile range.
Extended Data Fig. 2
Extended Data Fig. 2. Plasma p-tau217 (Lumipulse) and the effect of demographic characteristics and comorbidities.
Boxplots of plasma p-tau217 (Lumipulse) concentrations stratified by AD status and the following variables: (a) sex, (b) APOE ε4 carriership, (c) education, (d), chronic kidney disease, (e) presence of diabetes, and (f) age. The analyses were performed pooling the data of the five cohorts (n = 1767). Dashed lines represent the single cutoff at 90% specificity established in the Malmö secondary care cohort. The dots represent individual participants. The central band of the boxplot represents the group median, the box limits correspond to the first and third quartiles, and the whiskers represent the minimum/maximum value or the 1.5 interquartile range (IQR) from the box, whichever is smaller. AD status was defined as CSF Aβ42/p-tau181 < 11.94 or positive amyloid PET visual read for those who did not undergo lumbar puncture. Group mean levels were compared with Student’s t-test. Abbreviations: AD, Alzheimer’s disease; CKD, chronic kidney disease; IQR, interquartile range.
Extended Data Fig. 3
Extended Data Fig. 3. Effects of demographic characteristics and comorbidities on plasma p-tau217 performance in primary care.
This figure presents the accuracy and predictive values of plasma p-tau217 (Lumipulse) across various subgroups to assess the impact of demographic characteristics and comorbidities in primary care only (n = 548). Results are shown using a single cutoff (a) and using two cutoffs (c). Note that the AUC is independent of cutoffs (b). Participants who fell between the two cutoffs were classified in the intermediate group (d). Data are presented as the observed percentage, and the error bars as the 95% CI derived from the bootstrap distribution. AD pathology was defined as CSF Aβ42/p-tau181 < 11.94 or positive visual read on amyloid PET if lumbar puncture was not performed. The AD pathology prevalence is depicted for each cohort per subgroup in the figure (b). To assess whether the observed difference in the statistics is significantly different from zero, we performed a bootstrap hypothesis test. The P value (two-sided) was calculated as the proportion of bootstrap resamples (n = 2000) where the absolute null-distributed statistic was greater than or equal to the observed difference. Differences between AUCs were assessed with DeLong statistics. Results were not corrected for multiple comparisons. Significant P values in the order as presented in the plot: 0.022; 0.002; 0.007. Abbreviations: Accuracy; percent correctly classified participants; CI, confidence interval; CKD, chronic kidney disease; NPV, negative predictive value; PPV, positive predictive value.
Extended Data Fig. 4
Extended Data Fig. 4. Boxplots of plasma p-tau217/Aβ42 (Lumipulse) concentrations with AD pathology as grouping variable.
Boxplots of plasma p-tau217/Aβ42 (Lumipulse) concentrations in the (a) pooled secondary care cohort (n = 911) and (b) primary care cohort (n = 502) with AD pathology as grouping variable. Plasma p-tau217/Aβ42 differed significantly ( P < 0.001) between AD positive and AD negative participants in both populations. Dashed lines represent the single cutoff at 90% specificity established in the Malmö secondary care cohort. The dots represent individual participants. The central band of the boxplot represents the group median, the box limits correspond to the first and third quartiles, and the whiskers represent the minimum/maximum value or the 1.5 interquartile range (IQR) from the box, whichever is smaller. AD pathology was defined as CSF Aβ42/p-tau181 < 11.94 or positive amyloid PET visual read for those who did not undergo lumbar puncture. Group mean levels were compared with Student’s t-test. N = 10 outliers are not shown to improve visualization, but individuals were used in the analyses. One outlier (0.156) was AD pathology-negative. The remaining 9 outliers corresponded to AD pathology-positive participants, with the following plasma p-tau217/Aβ42 levels: 0.223, 0.256, 0.260, 0.273, 0.287, 0.509, 0.671, 0.761, 0.872. All outliers had MCI or dementia. Abbreviations: AD, Alzheimer’s disease; CKD, chronic kidney disease; IQR, interquartile range.
Extended Data Fig. 5
Extended Data Fig. 5. Plasma p-tau217/Aβ42 (Lumipulse) and the effect of demographic characteristics and comorbidities.
Boxplots of plasma p-tau217/Aβ42 concentrations stratified by AD pathology and the following variables: (a) sex, (b) APOE ε4 carriership, (c) education, (d), chronic kidney dysfunction, (e) presence of diabetes, and (f) age. The analyses were performed pooling the plasma p-tau217/Aβ42 data of the five cohorts (n = 1413). Dashed lines represent the single cutoff at 90% specificity established in the Malmö secondary care cohort. The dots represent individual participants. The central band of the boxplot represents the group median, the box limits correspond to the first and third quartiles, and the whiskers represent the minimum/maximum value or the 1.5 interquartile range (IQR) from the box, whichever is smaller. AD pathology was defined as CSF Aβ42/p-tau181 < 11.94 or positive amyloid PET visual read for those who did not undergo lumbar puncture. Group mean levels were compared with Student’s t-test. N = 10 outliers are not shown to improve visualization, but individuals were used in the analyses. One outlier (0.156) was AD pathology-negative. The remaining 9 outliers corresponded to AD pathology-positive participants, with the following plasma p-tau217/Aβ42 levels: 0.223, 0.256, 0.260, 0.273, 0.287, 0.509, 0.671, 0.761, 0.872. All outliers had MCI or dementia. Abbreviations: AD, Alzheimer’s disease; CKD, chronic kidney disease; IQR, interquartile range.
Extended Data Fig. 6
Extended Data Fig. 6. Boxplots of mass spectrometry-based plasma p-tau217 and %p-tau217 with AD pathology as grouping variable.
Pooled secondary care cohort data (a, c, n = 619) and primary care data (b, d, n = 513) with AD pathology as grouping variable to assess differences in MS-based p-tau217 (a and b) and %p-tau217 (c and d). Plasma levels differed significantly (P < 0.0001) between AD pathology-positive and AD pathology-negative participants in both populations. Dashed lines represent the single cutoff at 90% specificity established in the Malmö secondary care cohort. The dots represent individual participants. The central band of the boxplot represents the group median, the box limits correspond to the first and third quartiles, and the whiskers represent the minimum/maximum value or the 1.5 interquartile range (IQR) from the box, whichever is smaller. AD pathology was defined as CSF Aβ42/p-tau181 < 11.94 or positive amyloid PET visual read for those who did not undergo lumbar puncture. Group mean levels were compared with Student’s t-test. Abbreviations: AD, Alzheimer’s disease; MS, mass spectrometry; IQR, interquartile range.
Extended Data Fig. 7
Extended Data Fig. 7. Mass spectrometry-based plasma p-tau217 and the effect of demographic characteristics and comorbidities.
Concentrations stratified by AD pathology and the following variables: (a) sex, (b) APOE ε4 carriership, (c) education, (d), chronic kidney dysfunction, (e) presence of diabetes, and (f) age. The analyses were performed pooling the data of the four cohorts with MS data available (n = 1132). Dashed lines represent the single cutoff at 90% specificity established in the Malmö secondary care cohort. The dots represent individual participants. The central band of the boxplot represents the group median, the box limits correspond to the first and third quartiles, and the whiskers represent the minimum/maximum value or the 1.5 interquartile range (IQR) from the box, whichever is smaller. AD pathology was defined as CSF Aβ42/p-tau181 < 11.94 or positive amyloid PET visual read for those who did not undergo lumbar puncture. Group mean levels were compared with Student’s t-test. Abbreviations: AD, Alzheimer’s disease; CKD, chronic kidney disease; MS, mass spectrometry; IQR, interquartile range.
Extended Data Fig. 8
Extended Data Fig. 8. Mass spectrometry-based plasma %p-tau217 and the effect of demographic characteristics and comorbidities.
Plasma %p-tau217 stratified by AD pathology and the following variables: (a) sex, (b) APOE ε4 carriership, (c) education, (d), chronic kidney dysfunction, (e) presence of diabetes, and (f) age. The analyses were performed pooling the data of the four cohorts with MS data available (n = 1132). Dashed lines represent the single cutoff at 90% specificity established in the Malmö secondary care cohort. The dots represent individual participants. The central band of the boxplot represents the group median, the box limits correspond tothe first and third quartiles, and the whiskers represent the minimum/maximum value or the 1.5 interquartile range (IQR) from the box, whichever is smaller. AD pathology was defined as CSF Aβ42/p-tau181 < 11.94 or positive amyloid PET visual read for those who did not undergo lumbar puncture. Group mean levels were compared with Student’s t-test. Abbreviations: AD, Alzheimer’s disease; CKD, chronic kidney disease; MS, mass spectrometry; IQR, interquartile range.
Extended Data Fig. 9
Extended Data Fig. 9. Comparison of assay performances between different age groups.
This figure presents the accuracy and predictive values of plasma p-tau217 (Lumipulse) and p-tau217 (MS) and %p-tau217 (MS) across three age groups to examine the impact of demographic characteristics and comorbidities. The analysis combined data from four different cohorts with MS data available (n = 1132). Results are shown using a single cutoff. The dots represent the actual percentage, and the error bars the 95% CI derived from the bootstrap distribution. AD pathology was defined as CSF Aβ42/p-tau181 < 11.94 or positive visual read on amyloid PET if lumbar puncture was not performed. To assess whether the observed difference in the statistics is significantly different from zero, we performed a bootstrap hypothesis test. The Pvalue (two-sided) was calculated as the proportion of bootstrap resamples (n = 2000) where the absolute null-distributed statistic was greater than or equal to the observed difference. Differences between AUCs were assessed with DeLong statistics. Results were not corrected for multiple comparisons. The comparisons between age groups per biomarker are shown in the figure (P values in the order as presented in the plot: 0.012; <0.001; 0.013). %p-tau217 (MS) had significantly higher AUCs than p-tau217 (MS) when comparing the age categories 73-80 (P = 0.033) and ≥80 (P = 0.013). No differences were observed between the biomarkers within the different age categories. Abbreviations: Accuracy, percent correctly classified participants; CI, confidence interval; MS: mass spectrometry; NPV, negative predictive value; PPV, positive predictive value.
Extended Data Fig. 10
Extended Data Fig. 10. Performances of plasma p-tau217 (Lumipulse) vs. mass spectrometry-based plasma p-tau217 and %p-tau217 across disease stages.
This figure presents the accuracy and predictive values of plasma p-tau217 (Lumipulse) and plasma p-tau217 (MS) and %p-tau217 (MS) across the disease stages SCD (a), MCI (b) and dementia (c). Results are shown using a single cutoff (blue, a-c) and two cutoffs (red, SCD (d), MCI (e) and dementia (f). Note that AUC values are independent of cutoffs (g). Participants who fall between the two cutoffs were classified in the intermediate group (h). The dots or bars represent the actual percentage, and the error bars the 95% CI. The analysis combined data from four different cohorts with MS data available (n = 1132). AD pathology was defined as CSF Aβ42/p-tau181 < 11.94 or positive visual read on amyloid PET if lumbar puncture was not performed. To assess whether the observed difference in the statistics is significantly different from zero, we performed a bootstrap hypothesis test. The P value (two-sided) was calculated as the proportion of bootstrap resamples (n = 2000) where the absolute null-distributed statistic was greater than or equal to the observed difference. Differences between AUCs were assessed with DeLong statistics. Results were not corrected for multiple comparisons. Significant P values in the order as presented in the plot: (b) 0.043; 0.046, (d) 0.033; 0.024, (g) 0.003; 0.009; 0.006, (h) 0.027; <0.001; <0.001; 0.005; <0.001. Abbreviations: CI, confidence interval; MS: mass spectrometry; MCI, mild cognitive impairment; NPV, negative predictive value; PPV, positive predictive value; SCD, subjective cognitive decline.

References

    1. Hansson, O., Blennow, K., Zetterberg, H. & Dage, J. Blood biomarkers for Alzheimer’s disease in clinical practice and trials. Nat. Aging3, 506–519 (2023). - PMC - PubMed
    1. Ashton, N. J. et al. Diagnostic accuracy of a plasma phosphorylated tau 217 immunoassay for Alzheimer disease pathology. JAMA Neurol.81, 255–263 (2024). - PMC - PubMed
    1. Ashton, N. J. et al. Plasma and CSF biomarkers in a memory clinic: head-to-head comparison of phosphorylated tau immunoassays. Alzheimers Dement.19, 1913–1924 (2023). - PMC - PubMed
    1. Barthélemy, N. R. et al. Highly accurate blood test for Alzheimer’s disease is similar or superior to clinical cerebrospinal fluid tests. Nat. Med.30, 1085–1095 (2024). - PMC - PubMed
    1. Janelidze, S. et al. Head-to-head comparison of 10 plasma phospho-tau assays in prodromal Alzheimer’s disease. Brain10.1093/brain/awac333 (2022). - PMC - PubMed

MeSH terms