. 2025 Apr;640(8058):497-505.
doi: 10.1038/s41586-025-08805-6. Epub 2025 Apr 9.

Connectomics of predicted Sst transcriptomic types in mouse visual cortex

Affiliations

Connectomics of predicted Sst transcriptomic types in mouse visual cortex

Clare R Gamlin et al. Nature. 2025 Apr.

Abstract

Neural circuit function is shaped both by the cell types that comprise the circuit and the connections between them1. Neural cell types have previously been defined by morphology2,3, electrophysiology4, transcriptomic expression5,6, connectivity7-9 or a combination of such modalities10-12. The Patch-seq technique enables the characterization of morphology, electrophysiology and transcriptomic properties from individual cells13-15. These properties were integrated to define 28 inhibitory, morpho-electric-transcriptomic (MET) cell types in mouse visual cortex16, which do not include synaptic connectivity. Conversely, large-scale electron microscopy (EM) enables morphological reconstruction and a near-complete description of a neuron's local synaptic connectivity, but does not include transcriptomic or electrophysiological information. Here, we leveraged morphological information from Patch-seq to predict the transcriptomically defined cell subclass and/or MET-type of inhibitory neurons within a large-scale EM dataset. We further analysed Martinotti cells-a somatostatin (Sst)-positive17 morphological cell type18,19-which were classified successfully into Sst MET-types with distinct axon myelination and synaptic output connectivity patterns. We demonstrate that morphological features can be used to link cell types across experimental modalities, enabling further comparison of connectivity to gene expression and electrophysiology. We observe unique connectivity rules for predicted Sst cell types.


Conflict of interest statement

Competing interests: N.K., K. Lee, T.M. and H.S.S. disclose financial interests in Zetta AI LLC. The remaining authors declare no competing interests.

Figures

Fig. 1
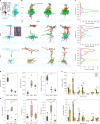
Fig. 1. Comparison of EM and Patch-seq pipelines and morphologies.
a, Subset of morphologies available from large-scale millimetre-squared EM dataset volume. Each cell is in a different colour. b, Schematic representation of the Patch-seq and EM pipelines for generating morphological reconstructions and comparison of features across pipelines. Ephys, electrophysiology; swc, file format of skeletonized neuronal reconstructions. c, Confusion matrix of RFC MET-type predictions showing the frequency with which the RFC correctly predicted the MET-type of Patch-seq cells (normalized by row). The RFC was trained on morphological features of inhibitory Patch-seq data (n = 477). We used this classifier to predict MET-type or subclass identity of EM cells (n = 173). d, Top, example Patch-seq morphology and average axon/dendrite histograms of MET-types. Bottom, example EM cells morphology and average axon/dendrite histograms grouped by predicted MET-type (MET-8, n = 3; MET-4, n = 6; MET-6, n = 5). Illustration in a adapted from refs. ,, Springer Nature Limited.
Fig. 2
Fig. 2. Output synapses and myelination of MET-types.
a, Example cell from each predicted MET-type showing output synapses (cyan dots) and myelination (magenta). Insets, myelination of a predicted MET-8 cell and myelinated axon in EM. b, Same example cells (plus further examples) from each predicted MET-type with output synapses colour-coded by synapse target (as identified by a classifier trained on somatic features). c, Average histogram of synapses onto targets by predicted MET-type. d, Quantification of number and size of output synapses by MET-type. e, Quantification of myelination features by MET-type. f, Quantification of the total number and percentage of output synapses onto each target cell type by MET-type. Bars indicate significant differences (P < 0.05 Kruskall–Wallis for group and Conover post hoc with Bonferroni correction, *P < 0.05, **P < 0.01; MET-8, n = 3; MET-4, n = 6; MET-6, n = 5). Scale bars, 10 μm (first inset), 1 μm (second inset) (a), 100 μm (b).
Fig. 3
Fig. 3. Exploring pairwise connectivity of MET-types and postsynaptic targets.
a, Average histogram of percentage of each cell type that receives synapses as a function of radial (xz) distance between presynaptic EM cell and postsynaptic target. All distributions were compared pairwise by a Kolmogorov–Smirnov test with a false discovery rate correction. *P < 0.05 for all comparisons of that distribution to others. b, Percentage of connections that contain a single versus multiple synapses (shown up to five) for each target cell type across predicted MET-types (for example, predicted MET-6 cells form more multi-synaptic contacts onto L5 ET targets than onto other cell types). c, Example cell from each predicted MET-type showing soma locations of postsynaptic targets. Somas are colour-coded to indicate the number of synapses that cell receives from the presynaptic cell (soma in cyan). All examples use the same scale. d, Histograms of inter-synaptic distances onto target types (distances calculated per postsynaptic target). MET-8, -4 and -6 (n = 3, 6 and 5, respectively).
Fig. 4
Fig. 4. Integrated view of MET-types including modalities from Patch-seq and EM.
a, First column, average percentage of synapses onto each postsynaptic target group. Second column, schematic summarizing the connectivity motifs observed from EM data. Third column, example cells from the EM dataset. Fourth column, average action potential (AP) traces per MET-type. Fifth column, transcriptomic cell types that comprise previously defined MET-types. b, This integrated view of MET-types now allows us to generate hypotheses such as the role of highly expressed genes in a given transcriptomic type on connectivity patterns. c, Dot plot showing the fraction of cells within the MET-type (circle size) and expression level (red to blue scale bar) of the genes that are differentially expressed across the transcriptomic types in MET-8, 4 and 6 (n = 18, 15 and 18, respectively) and present in at least 50% of one MET-type. Genes listed are the top five upregulated or downregulated genes by pairwise comparison (minus duplicates). aData previously published. Credits: plots in a reproduced with permission from ref. , Cell Press.
Extended Data Fig. 1
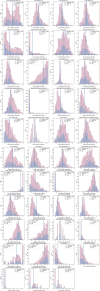
Extended Data Fig. 1. Patch-seq versus EM feature Z-score comparison.
Z-score distributions for Patch-seq (pink) versus EM (blue) data and the EM distribution mean (blue line) for all morphological features calculated (organized in decreasing Gini index score). We find that only one feature for which the EM mean is greater than 1 standard deviation away from the Patch-seq mean (axon_depth_pc_04). Patch-seq cell (n = 477); EM (n = 173).
Extended Data Fig. 2
Extended Data Fig. 2. Comparison of EM to Patch-seq features, classifier performance, and predicted MET-subclass relative to connectivity-defined subclass.
a) Features of all inhibitory Patch-seq (PS) (n = 477) versus all inhibitory EM neurons (columnar sample + curated MCs n = 173). Boxplot whiskers indicate the range (max/min) of the data. Features are presented by decreasing Gini index as used by the classifier to predict MET-type identity. b) Cumulative histogram for reliability metric. Patch-seq cells which are correctly predicted with their known MET-type are labeled as “Correct MET prediction” and Patch-seq cells which the classifier incorrectly identifies are labeled as “Incorrect MET prediction”. An inset is provided to clearly show where the reliability threshold is defined. c) Confusion matrix for connectivity-defined subclass (labels from Schneider-Mizell.) versus predicted MET subclass for EM cells from the columnar sample (n = 163) (frequencies are normalized within subclass). Connectivity-defined targeting labels: Perisomatic targeting cells (PTC) target soma or proximal dendrites, distal dendrite targeting cells (DTC) primarily target apical and/or distal dendrites, sparsely targeting cells (STC) have relatively sparse multisynaptic connections, and inhibitory targeting cells (ITC) target other inhibitory neurons. These subclass definitions correspond to “coarse classical or molecular subclasses…but there is not a one-to-one match”. Here they provide a useful benchmark for molecular subclass predictions derived from the Patch-seq classifier. For perspective on the Sst MET-type mapping of column neurons, morphologies are presented by predicted MET-type in Extended Data Fig. 4.
Extended Data Fig. 3
Extended Data Fig. 3. Comparison of features of Sst Patch-seq versus EM Martinotti.
Features plotted in order of decreasing gini index of features of Sst Patch-seq (n = 236) versus EM Martinotti cells (curated EM n = 16) features. Boxplot whiskers indicate the range (max/min) of the data. We see for all but one EM cell for one feature (axon_depth_pc_3) the values from EM fall within the range observed for Patch-seq data. We expect these values to not be the same as the Patch-seq data contains all Sst MET-types, whereas the curated EM cells are only a subset of Martinotti cells.
Extended Data Fig. 4
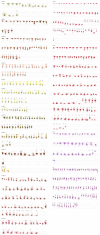
Extended Data Fig. 4. Morphology of Patch-seq and EM cells grouped by subclass or Sst MET-type.
Morphology of Patch-seq (before vertical line) and EM cells (after vertical line, including from the columnar sample and curated MCs) grouped by subclass or Sst MET-type. Abbreviations above cells indicate target cell type (described in Extended Data Fig. 2). Perisomatic targeting cells (PTC), distal dendrite targeting cells (DTC), sparsely targeting cells (STC), and inhibitory targeting cells (ITC). The number indicates the frequency with which that cell was predicted to that MET-type. For Sst MET-types, at least one EM cell is predicted to belong to 11 of 13 Sst MET-types. Sst MET-types: Sst MET-1, -2, -5, and -7 contain only a few EM neurons, but visual inspection demonstrates that morphologies are quite similar between Patch-seq cells and EM; these neurons are largely distal targeting cells (DTCs), consistent with the Sst subclass prediction. Sst MET-3 EM column neurons (n = 15) are found in L2/3 and L4 and largely have DTC connectivity profiles (11/15 cells). These cells have one longer, descending dendrite, and a “fanning” axonal profile that widens in L1 and L2/3. Sst MET-4 EM column and curated neurons (n = 11) have somas in L5, and dominant L1 axon. All column cells (6/6 cells) are also DTCs. Sst MET-6 EM column and curated neurons (n = 9) have somas in deep L5 and a “T-shaped” axonal profile. Six of seven column neurons are DTCs. Sst MET-8 column and curated neurons (n = 12) have somas in L4 and upper L5 and dominant L4 axon. Five out of ten column neurons have an Sst-consistent, DTC label. All of these neurons, like the Patch-seq neurons in this type, have axon in L1. Neurons that map to other connection types lack axon in L1. Sst MET-9 column and curated neurons (n = 6) have somas in upper L5 or L6 and large dendritic trees. Four of the five column neurons are DTCs. Sst MET-10 column neurons (n = 4) have somas in upper L5 or L6 and large dendritic trees with dominant axon in L5 and/or L6. Half of the cells are DTCs with axons that extend to superficial layers, but not necessarily to L1. Sst MET-12 column neurons (n = 12) have somas in L6. Most cells have large dendritic trees and diverse axonal phenotypes. EM DTCs that map to this type lack L1-projections and are thus non-Martinotti cells (3/12). EM PTCs also frequently map to Sst MET-types that are dominated by non-Martinotti neurons (5/12 cells are PTCs). Lamp5 subclass: Patch-seq Lamp5 neurons most characteristically have small dendrites and a wide, dense, horizontally extending axon in L1. All L1 EM cells (9/9) have small dendrites and the sparse targeting cell (STC) profile that is suggested to correspond to Lamp5/neurogliaform cells (NGCs). Lamp5 neurons found in deeper layers also have dense axon overlapping with their dendrites, but it’s distributed across layers. Only 7/21 deep Lamp5 cells are STCs. Pvalb subclass: Patch-seq Pvalb neurons have typical Pvalb/basket cell morphologies with stellate dendrites and abundant local axon in each cell’s soma layer. Most cells extend axon across multiple layers, but avoid L1. Thirty of 37 EM column cells are proximal targeting cells (PTCs). Scng subclass: Patch-seq Scng neurons have widely branching bitufted or multipolar dendrites and axons. EM column cells that map to this type (n = 4) each have a different connectivity type. Vip subclass: Patch-seq Vip neurons frequently have bipolar primary dendrites and axon with a narrow horizontal and long vertical extent. Twenty out of 22 EM column cells that map to Vip have an inhibitory cell targeting type (ITCs), which is consistent with Vip neurons. Figure adapted with permission from ref. , Cell Press.
Extended Data Fig. 5
Extended Data Fig. 5. Comparison of classifiers performance versus Patch-seq or manual analysis and additional details of synaptic connections by MET-type.
a) Confusion matrix showing correct versus predicted labels for Patch-seq cells from the random forest classifier (n = 477). This is data shown in Fig. 1c, but is shown here collapsed along subclass. The classifier largely correctly predicts a cell’s subclass for Lamp5, Pvalb, Sst and Vip cells. The frequency of a correct prediction appears in each square along the diagonal. b) Confusion matrix showing differences between manual (expert annotator) versus predicted subclass calls from Elabbady et al. (n = 2454 cells). The largest disagreement results from the human annotator referencing layer drawings from different z-planes throughout the dataset which features a larger L2/3 and more restricted L4, whereas the classifier used labels derived from a columnar sample which resulted in more cells being called L2/3 that the classifier predicted at L4. Overall we observe a large degree of alignment between manual and predicted labels. c) Average connection size: the sum of the size (voxel) of all synapses onto an individual postsynaptic target. The connection size of MET-8 cells is significantly larger than MET-6 cells (K-W test p < 0.05; post hoc **p < 0.01). MET- 8, 4, 6 (n = 3, 6, 5). d) Overall synaptic density: Total number of output synapses divided by total axon length. MET-8 cells have significantly higher output synapse density compared to MET-4 and MET-6 cells (K-W test p < 0.05; post hoc **p < 0.01). e) Plot of the p-values comparing the actual and Poisson distribution of synapses from individual MCs onto target cell classes. We highlight the connections where the null hypothesis (the distributions were Poisson distributed) could not be rejected (grey).
Extended Data Fig. 6
Extended Data Fig. 6. Visualization of myelin and output synapses for predicted MET-types.
Output synapses and myelination patterns of all EM MCs grouped by predicted MET-type. The reliability metric (% out of 500 runs) that the cell was predicted into the MET-type displayed below.
Extended Data Fig. 7
Extended Data Fig. 7. Visualization of output synapses by target cell type for predicted MET-types.
Output synapses colour-coded by postsynaptic cell subclass of all EM MCs grouped by predicted MET-type. * denotes cells with dominant L5 ET targeting in contrast to the rest of the MET-4 cells.

References

    1. Zeng, H. & Sanes, J. R. Neuronal cell-type classification: challenges, opportunities and the path forward. Nat. Rev. Neurosci.18, 530–546 (2017). - PubMed
    1. Cajal, S. R. Y., Azoulay, D. L., Swanson, N. & Swanson, L. W. Histology Of The Nervous System: Of Man And Vertebrates (Oxford Univ. Press, 1995).
    1. De Carlos, J. A. & Borrell, J. A historical reflection of the contributions of Cajal and Golgi to the foundations of neuroscience. Brain Res. Rev.55, 8–16 (2007). - PubMed
    1. Hubel, D. H. & Wiesel, T. N. Receptive fields of single neurones in the cat’s striate cortex. J. Physiol.148, 574–591 (1959). - PMC - PubMed
    1. Zeisel, A. et al. Cell types in the mouse cortex and hippocampus revealed by single-cell RNA-seq. Science347, 1138–1142 (2015). - PubMed

LinkOut - more resources