

The association between pan-immune-inflammation value with mortality in critically ill patients with sepsis-associated acute kidney injury
- PMID: 40205347
- PMCID: PMC11980289
- DOI: 10.1186/s12879-025-10880-z
The association between pan-immune-inflammation value with mortality in critically ill patients with sepsis-associated acute kidney injury
Abstract
Background: Sepsis-associated acute kidney injury (SA-AKI) significantly impacts global health. Early identification of SA-AKI patients at inflammatory and immune risk, followed by timely interventions, is critical for improving outcomes. The pan-immune-inflammation value (PIV) reflects systemic inflammation and immune status. However, its prognostic value in SA-AKI remains unexplored.
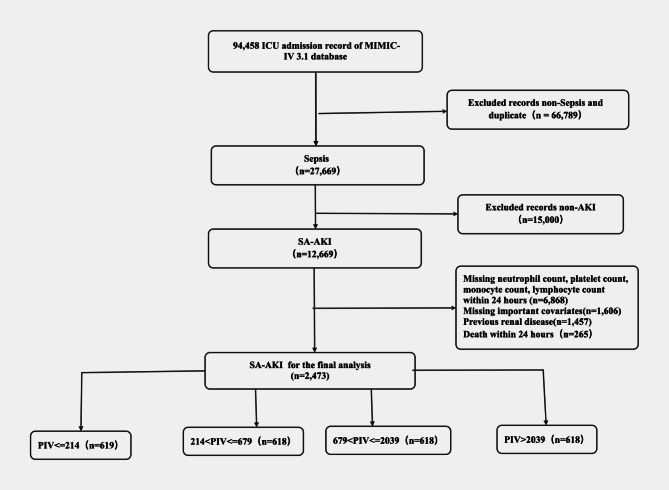
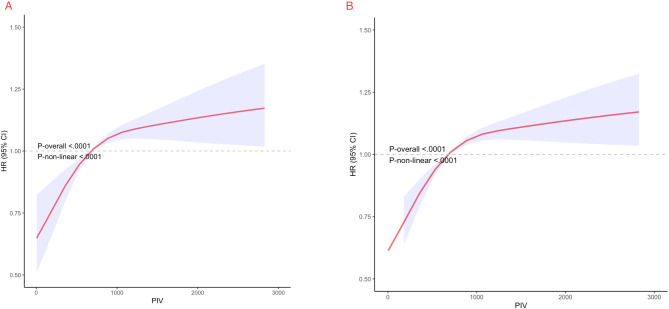
Methods: This retrospective cohort study analyzed SA-AKI patients in the MIMIC-IV database. Cox regression assessed the association between PIV and mortality, while restricted cubic spline (RCS) regression explored the relationship between PIV and 30-day and 365-day mortality.
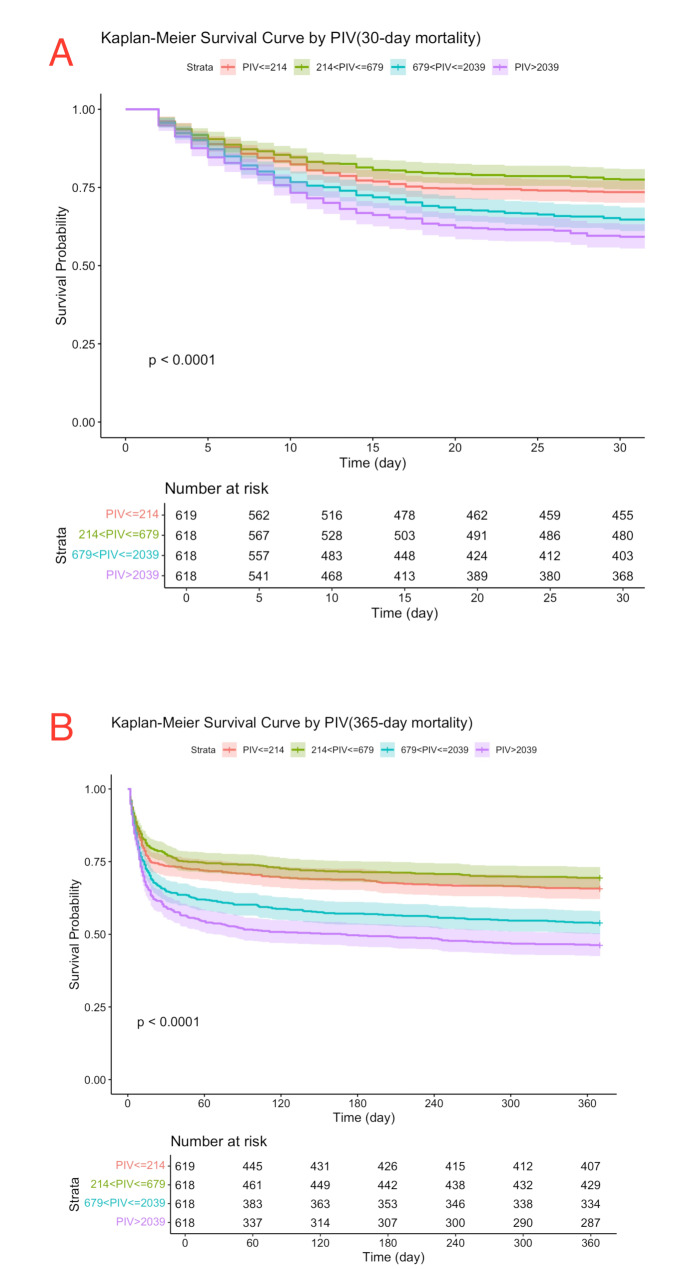
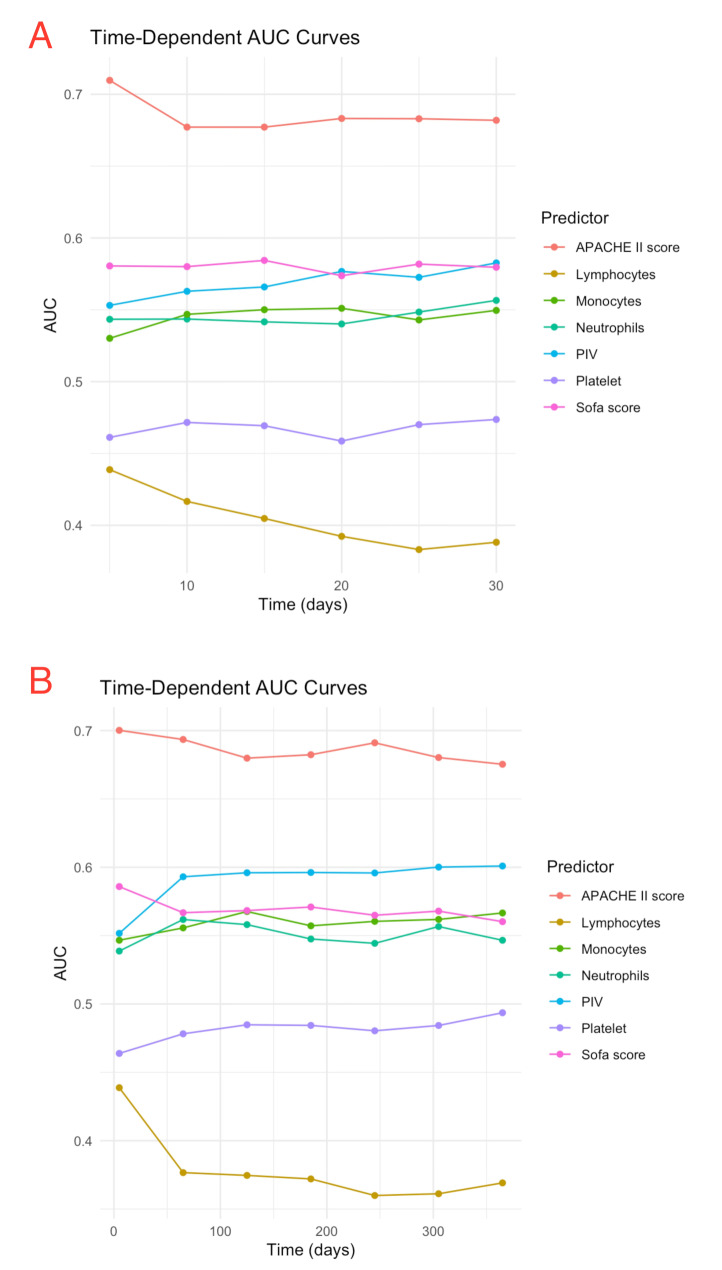
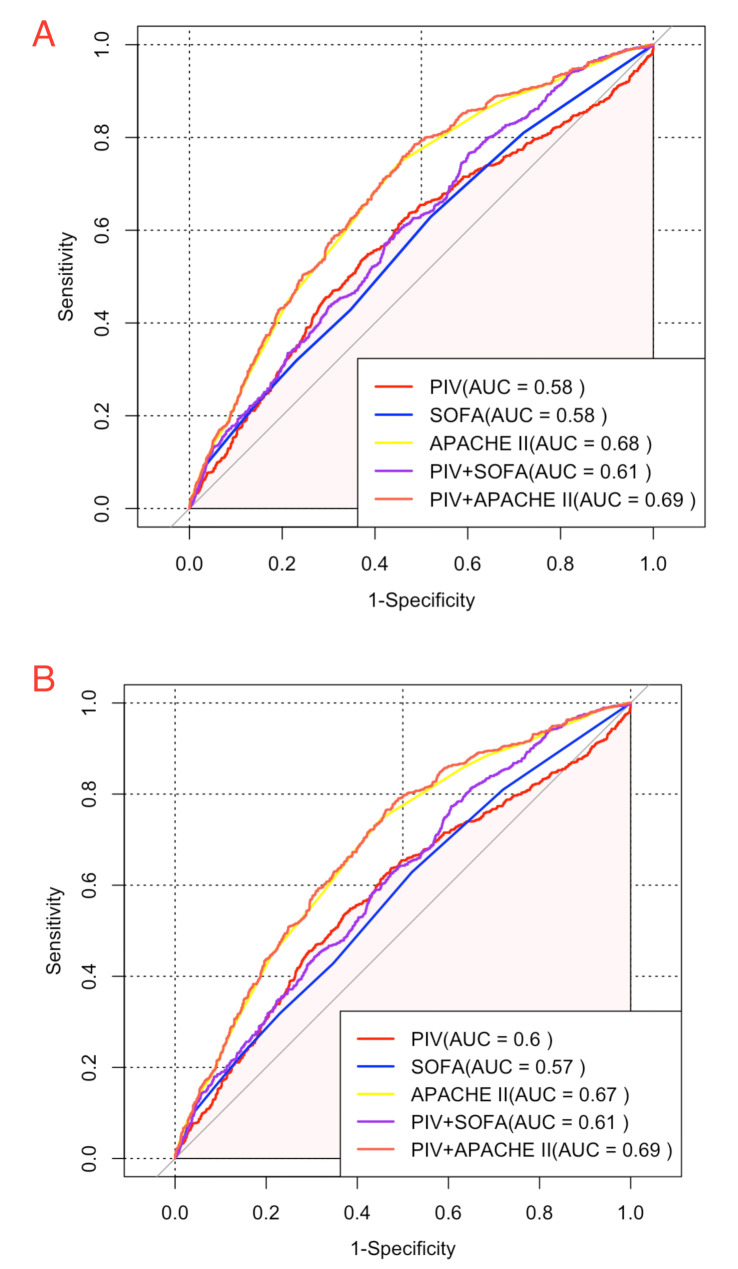
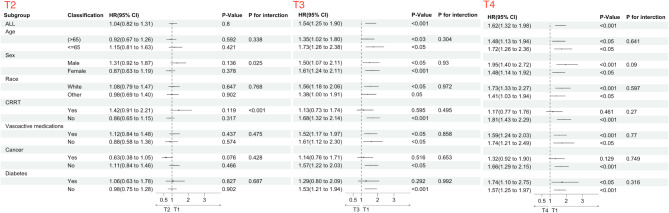
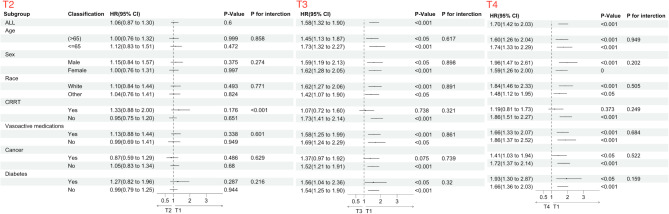
Results: A total of 2,473 SA-AKI patients in our study were categorized into PIV quartiles: T1 (≤ 214), T2 (214-679), T3 (679-2,039), and T4 (> 2,039). PIV showed a nonlinear association with mortality. Higher PIV quartiles were linked to increased mortality, with 30-day rates of 26%, 22%, 35%, and 41% (P < 0.001) and 365-day mortality rates of 34%, 31%, 46%, and 54% (P < 0.001). Adjusted hazard ratios (HR) for 30-day mortality across quartiles were 1.00 (reference), 1.04(0.82, 1.31), 1.54 (1.25, 1.9), and 1.62 (1.32, 1.98), respectively. For 365-day mortality, the HR and 95% CI were 1.00 (reference), 1.06 (0.87, 1.30), 1.58 (1.32, 1.90), and 1.70 (1.42, 2.03). After adding PIV to SOFA score, the integrated discrimination improvement (IDI) for 30-day mortality was 0.005, and the net reclassification improvement (NRI) was 0.103. For 365-day mortality, the IDI was 0.009, and the NRI was 0.124. Regarding the APACHE II score, the IDI for 30-day mortality was 0.003, and the NRI was 0.081. For 365-day mortality, the IDI was 0.006, and the NRI was 0.107.
Conclusion: Elevated PIV independently predicts both short- and long-term adverse outcomes in SA-AKI patients. Incorporating PIV into established critical illness prediction models, such as SOFA and APACHE II, enhances their prognostic accuracy.
Keywords: Acute kidney injury; Mortality; Pan-immune-inflammation value; Sepsis.
© 2025. The Author(s).
Conflict of interest statement
Declarations. Ethics approval and consent to participate: The MIMIC database was approved by the Institutional Review Boards (IRBs) of the Massachusetts Institute of Technology and Beth Israel Deaconess Medical Center. This study adhered to the ethical principles of the Declaration of Helsinki and was approved by both institutions. As patient data was de-identified, individual informed consent was not required. Consent for publication: Not applicable. Competing interests: The authors declare no competing interests. Clinical trial number: Not applicable.
Figures
Similar articles
-
Association of PIV value with early mortality in ICU patients with sepsis-associated acute kidney injury from the MIMIC IV database.Sci Rep. 2025 Apr 2;15(1):11212. doi: 10.1038/s41598-025-96320-z. Sci Rep. 2025. PMID: 40175479 Free PMC article.
-
The relationship between estimated pulse wave velocity and 28-day mortality in patients with sA-AKI: a retrospective cohort analysis of the MIMIC-IV database.Ren Fail. 2025 Dec;47(1):2507162. doi: 10.1080/0886022X.2025.2507162. Epub 2025 Jun 10. Ren Fail. 2025. PMID: 40494821 Free PMC article.
-
Association between lactate to albumin ratio and mortality among sepsis associated acute kidney injury patients.BMC Infect Dis. 2025 Mar 26;25(1):414. doi: 10.1186/s12879-025-10838-1. BMC Infect Dis. 2025. PMID: 40140783 Free PMC article.
-
Early recovery status and outcomes after sepsis-associated acute kidney injury in critically ill patients.Zhong Nan Da Xue Xue Bao Yi Xue Ban. 2022 May 28;47(5):535-545. doi: 10.11817/j.issn.1672-7347.2022.210368. Zhong Nan Da Xue Xue Bao Yi Xue Ban. 2022. PMID: 35753723 Free PMC article.
-
The association between stress hyperglycemia ratio and clinical outcomes in patients with sepsis-associated acute kidney injury: a secondary analysis of the MIMIC-IV database.BMC Infect Dis. 2024 Nov 8;24(1):1263. doi: 10.1186/s12879-024-10179-5. BMC Infect Dis. 2024. PMID: 39516751 Free PMC article.
References
-
- White KC, Serpa-Neto A, Hurford R, et al. Sepsis-associated acute kidney injury in the intensive care unit: incidence, patient characteristics, timing, trajectory, treatment, and associated outcomes. A multicenter, observational study. Intensive Care Med. 2023;49(9):1079–89. 10.1007/s00134-023-07138-0 - PMC - PubMed
-
- Kellum JA, Romagnani P, Ashuntantang G, Ronco C, Zarbock A, Anders HJ. Acute kidney injury. Nat Rev Dis Primers Jul. 2021;15(1):52. 10.1038/s41572-021-00284-z - PubMed
-
- Sun S, Chen R, Dou X, et al. Immunoregulatory mechanism of acute kidney injury in sepsis: a narrative review. Biomed Pharmacother Mar. 2023;159:114202. 10.1016/j.biopha.2022.114202 - PubMed
MeSH terms
LinkOut - more resources
Full Text Sources
Medical
