. 2025 Apr 9;13(1):18.
doi: 10.1186/s40170-025-00385-3.

Ketomimetic nutrients remodel the glycocalyx and trigger a metabolic defense in breast cancer cells

Affiliations

Ketomimetic nutrients remodel the glycocalyx and trigger a metabolic defense in breast cancer cells

Mohini Kamra et al. Cancer Metab. .

Abstract

Background: While the triggers for the metastatic transformation of breast cancer (BC) cells remain unknown, recent evidence suggests that intrinsic cellular metabolism could be a crucial driver of migratory disposition and chemoresistance. Aiming to decipher the molecular mechanisms involved in BC cell metabolic maneuvering, we study how a ketomimetic (ketone body-rich, low glucose) nutrient medium can engineer the glycocalyx and metabolic signature of BC cells, to further maneuver their response to therapy.

Methods: Doxorubicin (DOX) has been used as a model chemotherapeutic in this study. Bioorthogonal imaging was used to assess the degree of sialylation of the glycocalyx along with measurements of drug-induced cytotoxicity and drug internalization. Single cell label-free metabolic imaging has been performed, coupled with measurement of cellular proliferative and migratory abilities, and MS-based metabolomic screens. Transcriptomic analysis of crucial enzymes was performed using total RNA extraction and rt-qPCR.

Results: We found an inverse correlation of glycocalyx sialylation with drug-induced cytotoxicity and drug internalization, where ketomimetic media enhanced sialylation and protected BC cells from DOX. These hypersialylated cells proliferated slower and migrated faster as compared to their counterparts receiving a high glucose media, while exhibiting a preference for glycolysis. These cells also showed pronounced lipid droplet accumulation coupled with an inversion in their metabolomic profile. Enzymatic removal of sialic acid moieties at the glycocalyx revealed for the first time, a direct role of sialic acids as defense guards, blocking DOX entry at the cellular membrane to curtail internalization. Interestingly, the non-cancerous mammary epithelial cells exhibited opposite trends and this differential pattern in cancer vs. normal cells was traced to its biochemical roots, i.e. the expression levels of key enzymes involved in sialylation and fatty acid synthesis.

Conclusions: Our findings revealed that a ketomimetic medium enhances chemoresistance and invasive disposition of BC cells via two main oncogenic pathways: hypersialylation and lipid synthesis. We propose that the crosstalk between these pathways, juxtaposed at the synthesis of the glycan precursor UDP-GlcNAc, furthers advancement of a metastatic phenotype in BC cells under ketomimetic conditions. Non-cancerous cells lack this dual defense machinery and end up being sensitized to DOX under ketomimetic conditions.

Keywords: Breast cancer metabolism; Glycocalyx engineering; Hypersialylation; Ketogenic diet; Ketomimetic; Lipid metabolism.


Conflict of interest statement

Declarations. Ethics approval and consent to participate: Not applicable. Consent for publication: Not applicable. Competing interests: The authors declare no competing interests.

Figures
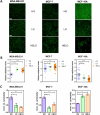
Fig. 1
Fig. 1
BC cell sialylation and susceptibility to chemotherapy is nutrient dependent and internally inversely related. A Representative confocal microscopy images of MDA-MB-231, MCF-7 and MCF-10A cells obtained using azide-alkyne click-chemistry following metabolic labeling of membrane sialic acids in the respective nutrient media: high glucose (HG), low glucose (LG) and HBLG (3-hydroxybutyrate-containing, low glucose). Green: AF488; scale bar: 100 µm. All images were collected at identical conditions and are displayed with the same LUT. B Relative sialylation levels in each cell line normalized to HG control as quantified using AF 488 intensity/perimeter of membrane in an image of labeled cells. For each cell type, images from two separate experiments (N = 2) were used with 10–15 different FOVs collected for each experiment. A custom pipeline created in Cell profiler was used for quantification based on generation of membrane mask using an image of the cells with CellBrite Membrane stain. Scatter plots shown here with black horizontal lines representing means, and error bars representing the standard error of mean (SEM), p-values were calculated using a two-tailed unpaired t-test in GraphPad Prism. C Normalized relative cytotoxicity of DOX (1µM) in MDA-MB-231, MCF-7 and MCF-10A cells in the respective nutrient media plotted using mean values where error bars represent SEM and p-values were computed using a two-tailed unpaired t-test in GraphPad Prism. *, **, *** indicate p < 0.05, p < 0.01, and p < 0.001, respectively
Fig. 2
Fig. 2
Alterations in NADH metabolic index of cells cultured in different media during the first hour of DOX treatment. A Upper three panels: representative intensity contrast images of MDA-MB-231 cells under HG, LG, and HBLG medium at 0 min are shown on the left and FLIM images (α1/α2) are shown towards the right in the order 0 – 60 min. Scale bar, 10 µm. Similarly, representative images of MCF-10A cells in HBLG are shown in the lower panel. B Histogram showing normalized NADH metabolic index histograms obtained from MCF-10A, MCF-7, and MDA-MB-231 in normal, LG, and HBLG medium over time. C Dot plots showing averaged NADH metabolic index obtained from MCF-10A, MCF-7, and MDA-MB-231 in normal, LG, and HBLG medium over time. Circular symbols are median values and error bars represent standard deviations over all pixels from a set of three different FOV’s per condition
Fig. 3
Fig. 3
Glucose consumption and migratory propensity of cells in different nutrient media. A Glucose consumption patterns of MDA-MB-231, MCF-7 and MCF-10A cells in the respective nutrient media: high glucose (HG), low glucose (LG) and HBLG (hydroxybutyrate containing low glucose). Changes in the amount of glucose consumed by the cells after four days of culture are plotted with data from n = 3 and N = 2 being pooled together. GraphPad Prism was used for plotting the data with colored bars representing means and error bars representing SEM, two-tailed unpaired t-tests were performed for column-wise statistical analysis. B Cellular proliferation profiles of the three cell lines in the respective nutrient media. Symbols denote mean values and error bars denote SEM from N = 2 and n = 2. C Cellular migration profile of MDA-MB-231 cells in response to changes in nutrient media quantified using images of crystal violet stained cells that have migrated across transwell membrane. Images from two separate experiments (N = 2) were used with 8–10 different FOVs collected for each experiment. The percentage (%) occupied area was measured using ImageJ software; bar graph displays mean values with error bars denoting SEM. Representative images are shown in the right panel, scale bar = 50 µm. Significance was assessed using a two-tailed unpaired t-test in GraphPad Prism where ns, **, *** indicate p > 0.05, p < 0.01, and p < 0.001, respectively
Fig. 4
Fig. 4
Sialylation and lipid accumulation in ketomimetic media contribute to DOX chemoprotection. A Confocal fluorescence imaging of MDA-MB-231 cells obtained after DOX internalization with and without sialidase treatment in the respective nutrient media: high glucose (HG), low glucose (LG) and HBLG (hydroxybutyrate containing low glucose). Red: DOX; scale bar: 100 µm. B Confocal fluorescence imaging of MCF-7 cells obtained after DOX internalization with and without sialidase treatment in the respective nutrient media. Red: DOX; scale bar: 100 µm. C, D Representative confocal microscopy images of MDA-MB-231 (C) and MCF-7 (D) cells obtained using BODIPY staining for detection of lipid droplets in the respective nutrient media. DRAQ5 was used as a nuclear counterstain. Green: BODIPY 505, Blue: DRAQ5; scale bar: 100 µm. Fluorescence quantification is shown on the right side of each panel. All images were collected at identical conditions and are displayed with the same LUT. The DOX or BODIPY signal per cell was quantified as IDOX-Iblank/cell # or IBodipy-Iblank/cell #, respectively and fold changes were computed relative to no sialidase and HG as controls, respectively. For each cell type, images from at least three separate experiments (N = 3) were used with 10–15 different FOVs collected for each experiment. For all graphs, symbols represent means and error bars denote SEM. Statistical analysis for significance was performed using a two-tailed unpaired t-test in GraphPad Prism where **, *** indicate p < 0.01, and p < 0.001, respectively
Fig. 5
Fig. 5
MALDI-MSI based metabolomic profiling of MDA-MB-231 cells in the different nutrient media: HG, LG and HBLG. A Principal Component Analysis of MALDI-MSI metabolomic data. B Metabolites were arranged in increasing order of loading in PC1, to obtain a metabolite-enrichment based separation. On the color scale bar, L and H denote lowest and highest values respectively, of a particular metabolite across the three different nutrient media. C Relative abundance of certain key metabolites displayed as a dendrogram-based heatmap
Fig. 6
Fig. 6
Schematic representation of proposed mechanism highlighting metabolic pathways participating in chemoresistance and invasion in response to ketomimetic nutrient medium. Bold blue arrows indicate the increased turn-over of the specific metabolic pathways. Thin black arrows represent basal-level reaction activity

Update of

References

    1. Lei S, Zheng R, Zhang S, Wang S, Chen R, Sun K, et al. Global patterns of breast cancer incidence and mortality: A population-based cancer registry data analysis from 2000 to 2020. Cancer Commun (Lond). 2021;41(11):1183–94. - PMC - PubMed
    1. Jin X, Mu P. Targeting Breast Cancer Metastasis. Breast Cancer (Auckl). 2015;9(Suppl 1):23–34. - PMC - PubMed
    1. Wang L, Zhang S, Wang X. The Metabolic Mechanisms of Breast Cancer Metastasis. Front Oncol. 2021;10: 602416. - PMC - PubMed
    1. Tilghman RW, Blais EM, Cowan CR, Sherman NE, Grigera PR, Jeffery ED, et al. Matrix Rigidity Regulates Cancer Cell Growth by Modulating Cellular Metabolism and Protein Synthesis. PLoS ONE. 2012;7(5): e37231. - PMC - PubMed
    1. Warburg O, Wind F, Negelein E. THE METABOLISM OF TUMORS IN THE BODY. J Gen Physiol. 1927;8(6):519–30. - PMC - PubMed

LinkOut - more resources