. 2025 Apr;31(4):e70338.
doi: 10.1111/cns.70338.

Elucidating the Role of Trem2 in Lipid Metabolism and Neuroinflammation

Affiliations

Elucidating the Role of Trem2 in Lipid Metabolism and Neuroinflammation

Chenhui Zhao et al. CNS Neurosci Ther. 2025 Apr.

Abstract

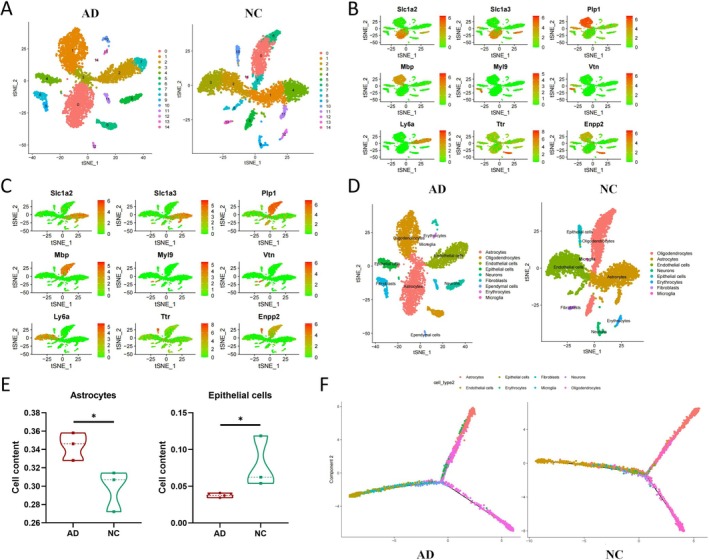
Background: Alzheimer's disease (AD) is a neurodegenerative disorder characterized by cognitive impairment and neuroinflammation. Astrocytes play a key role in the neuroinflammatory environment of AD, especially through lipid metabolism regulation. However, the mechanisms by which astrocytes, particularly through the triggering receptor expressed on myeloid cells 2 (Trem2) receptor, contribute to lipid dysregulation and neuroinflammation in AD remain inadequately understood.

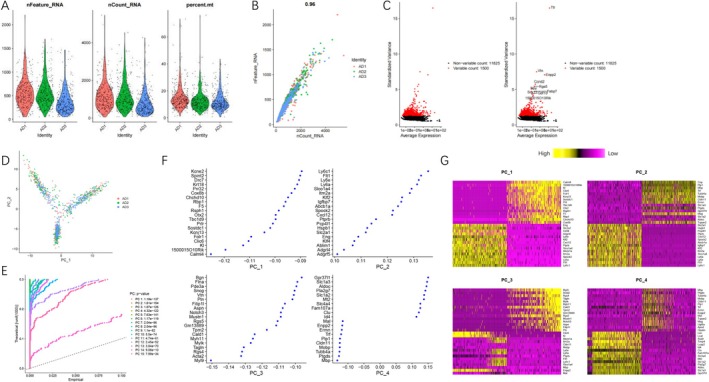
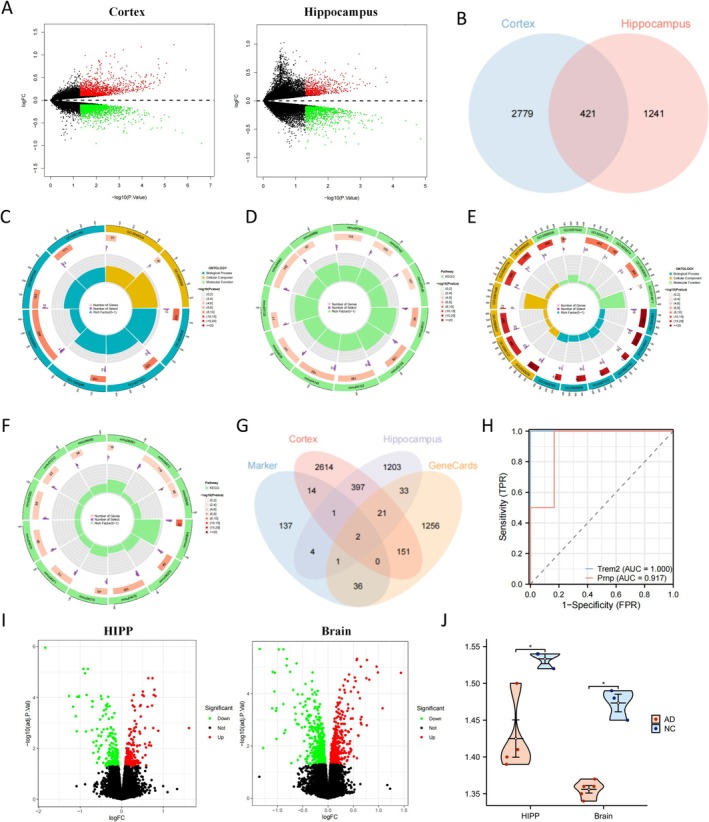
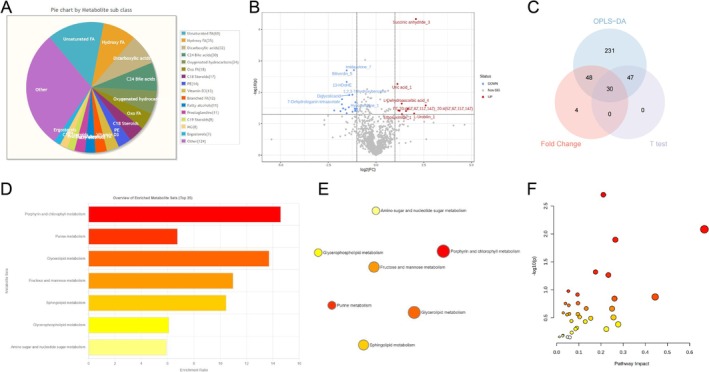
Methods: We employed an AD mouse model and integrated single-cell RNA sequencing (scRNA-seq), transcriptomics, and high-throughput metabolomics to analyze lipid metabolism and inflammatory profiles in astrocytes. Differential gene expression was further validated with the GEO database, and in vitro and in vivo experiments were conducted to assess the impact of Trem2 modulation on astrocytic inflammation and lipid composition.

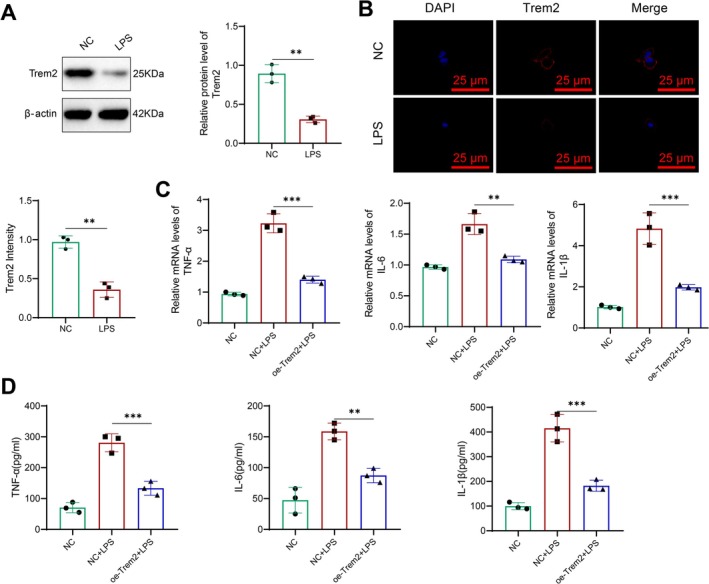
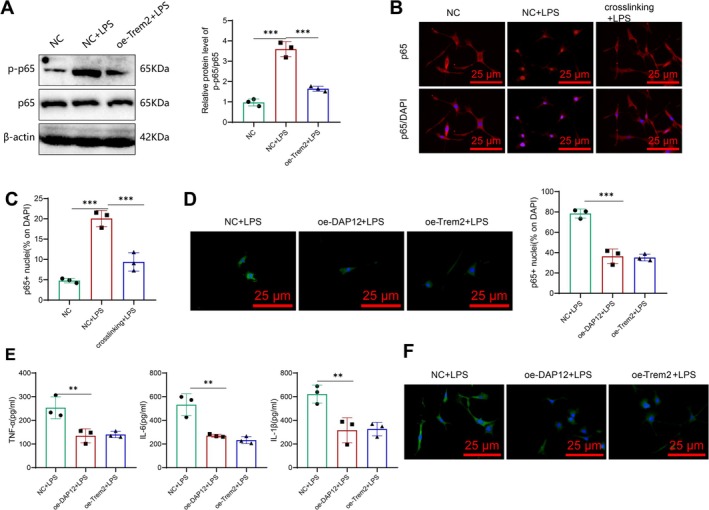
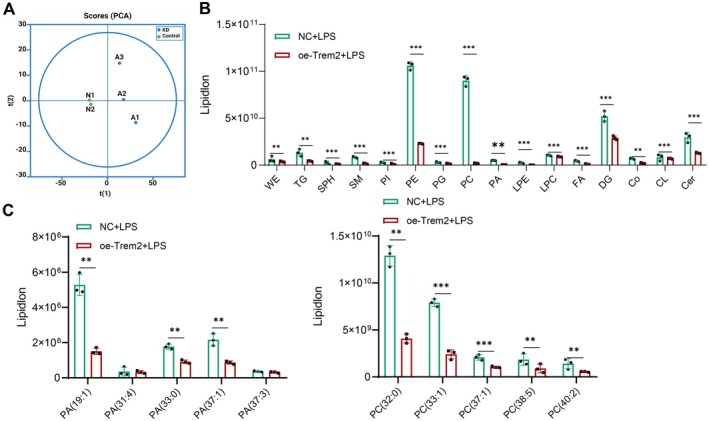
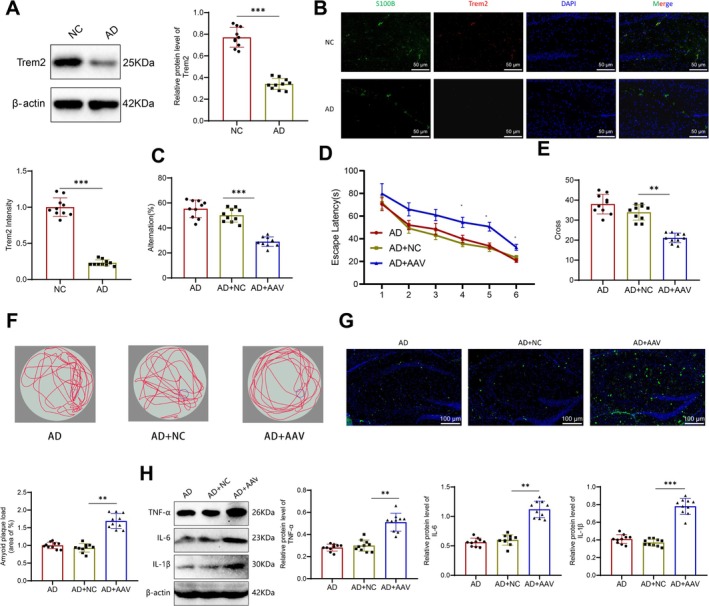
Results: Our findings demonstrate that Trem2 modulates lipid metabolism in astrocytes, affecting fatty acid and phospholipid pathways. In the AD model, Trem2 expression was suppressed, enhancing nuclear factor-κB (NF-κB) signaling and promoting the secretion of pro-inflammatory factors such as tumor necrosis factor-α (TNF-α) and interleukin-6 (IL-6). Trem2 overexpression reduced astrocytic inflammation and altered lipid composition, attenuating neuroinflammation both in vitro and in vivo. These results underscore Trem2's regulatory role in lipid metabolism and its significant impact on neuroinflammation in AD.

Conclusions: This study identifies Trem2 as a pivotal regulator of astrocytic lipid metabolism and neuroinflammation in AD, providing potential molecular targets for early intervention and therapeutic strategies aimed at mitigating AD progression.

Keywords: Alzheimer's disease; Trem2; astrocytes; lipid metabolism; neuroinflammation.


Conflict of interest statement

The authors declare no conflicts of interest.

Figures

FIGURE 1
FIGURE 1
Quality control and PCA dimension reduction of scRNA‐seq data in the AD group. (A) Violin plots showing the distribution of the number of genes (nFeature_RNA), mRNA molecules (nCount_RNA), and mitochondrial gene percentage (percent.mt) in each cell of the AD group scRNA‐seq data (N = 3); (B) Scatter plot showing the correlation between nCount_RNA and nFeature_RNA in the filtered data (N = 3); (C) Variance analysis to identify the top 1500 highly variable genes in the samples (red dots), with the top 10 genes listed on the right; (D) PCA analysis results for cells from different sample sources; (E) p‐Values of the first 15 principal components (PCs) obtained from PCA analysis; and (F, G) heatmaps showing the expression levels of feature genes in PC_1 and PC_4 identified from PCA analysis.
FIGURE 2
FIGURE 2
Identification of key cell types associated with AD through scRNA‐seq data analysis. (A) Visualization of TSNE clustering results showing the aggregation and distribution of cells from AD group samples (N = 3) and NC group samples (N = 3) where each color represents a cluster; (B) scatter plot showing the cell clustering of the top‐ranked marker genes in each cluster of the AD group samples; (C) scatter plot showing the cell clustering of the top‐ranked marker genes in each cluster of the NC group samples; (D) visualization of cell annotation results based on TSNE clustering, where each color represents a cell type; (E) T‐test results comparing the cell composition between AD group (N = 3) and NC group (N = 3), indicating differences in the occurrence of two cell types. *Represents comparison with p‐value < 0.05; (F) construction of cell trajectories based on cell type and clustering for pseudo‐time analysis (pseudo‐time progresses from left to right, increasing sequentially).
FIGURE 3
FIGURE 3
Identification of key genes involved in AD pathogenesis through transcriptome sequencing analysis. (A) volcano plot showing the differential gene expression analysis results between the AD group (N = 3) and NC group (N = 3) for the cerebral cortex and hippocampus tissues, with red indicating upregulated genes and green indicating downregulated genes; (B) Venn diagram showing the intersection of differentially expressed genes between the cerebral cortex and hippocampus tissues; (C) circle plot showing the GO functional enrichment analysis results for the intersection of differentially expressed genes; each module represents an enriched pathway; (D) circle plot showing the KEGG pathway enrichment analysis results for the intersection of differentially expressed genes; each module represents a KEGG pathway; (E) circle plot showing the GO functional enrichment analysis results for the marker genes of astrocytes derived from scRNA‐seq data; (F) circle plot showing the KEGG pathway enrichment analysis results for the marker genes of astrocytes; (G) Venn diagram showing the intersection of differentially expressed genes, marker genes, and lipid metabolic related genes between the cerebral cortex and hippocampus tissues; (H) diagnostic ROC curve for AD occurrence based on the expression of Trem2 and Prnp genes using transcriptome sequencing data; (I) Volcano plots depicting the differential expression analysis results of hippocampal tissue (HIPP) and whole brain tissue from the AD‐related dataset GSE165111 obtained from the GEO database; and (J) comparative intergroup analysis of Trem2 expression levels in the AD‐related dataset GSE165111, with * indicating comparisons between groups where p < 0.05.
FIGURE 4
FIGURE 4
Analysis of metabolomic data to explore the relationship between lipid metabolism and AD. (A) Pie chart showing the composition of lipid‐related “Sub class” metabolites; (B) volcano plot showing the differential metabolites analyzed based on fold change and T‐test; (C) Venn diagram showing the intersection of differential metabolites obtained by OPLS‐DA analysis with VIP > 1, fold change analysis |logFC| > 2, and T‐test p < 0.05; (D) bar plot showing the functional enrichment analysis results of differential metabolites in the MetaboAnalyst database; (E) network plot showing the functional enrichment analysis results of differential metabolites in the MetaboAnalyst database; (F) comprehensive metabolic pathway analysis of differential metabolites combined with astrocytes in the MetaboAnalyst database. Each group of samples has N = 15.
FIGURE 5
FIGURE 5
Relationship between Trem2 and LPS‐induced neuroinflammation. (A) Western blot analysis of Trem2 protein expression in astrocytes after LPS stimulation; (B) immunofluorescence staining and fluorescence intensity analysis of Trem2 in astrocytes after LPS stimulation; (C) RT‐qPCR analysis of TNF‐α, IL‐6, and IL‐1β expression changes in astrocytes overexpressing Trem2; and (D) ELISA measurement of TNF‐α, IL‐6, and IL‐1β levels. **p < 0.01, ***p < 0.001, respectively, with N = 3 in all experiments. NC (normal control): cells from non‐treated, normal astrocytes; LPS (lipopolysaccharide): astrocytes stimulated with LPS to induce inflammation as a model of neuroinflammation; Oe‐Trem2 (overexpressed Trem2): astrocytes that were transfected with Trem2 to study its effect in modulating the LPS‐induced inflammatory response.
FIGURE 6
FIGURE 6
Trem2 modulates the production of inflammatory factors by regulating NF‐κB activation. (A) Expression and activation levels of the key downstream signaling pathway NF‐κB subunit p65 were detected by western blot after TLR4 activation; (B) representative images of immunofluorescent staining of nuclear p65 subunit localization after Trem2 antibody cross‐linking; (C) quantitative results of nuclear p65 subunit localization; (D) representative images and quantitative results of fluorescent staining of nuclear p65 subunit localization after Trem2 or DAP12 transfection; (E) ELISA measured levels of TNF‐α, IL‐6, and IL‐1β; and (F) immunofluorescent staining was performed to observe morphological changes in transfected cells. **p < 0.01, ***p < 0.001, respectively. N = 3.
FIGURE 7
FIGURE 7
Lipidomics study of the effect of Trem2 on lipid metabolism in astrocytes. (A) PCA score plot of non‐targeted lipidomic data. (B) Lipid species with differences (p < 0.05, VIP > 1) between the NC group and oe‐Trem2 group after LPS stimulation. (C) Differences in the levels of certain lipid subclasses, such as PC and PA. **p < 0.01, ***p < 0.001, respectively. N = 3.
FIGURE 8
FIGURE 8
In vivo experiments validate the impact of Trem2 on neuroinflammation and AD development. (A) western blot was performed to measure the protein expression level of Trem2 in the mouse hippocampal region. (B) Immunofluorescent staining and analysis of the fluorescent intensity of S100B (green) and Trem2 (red) co‐staining in the mouse hippocampal region. (C) Spontaneous alternation rate of mice in the Y‐maze task. (D) Latency in the water maze task. (E) Number of platform crossings in the water maze task. (F) Movement traces of mice in the water maze task. (G) Quantification and representative imagesof plaque count in the mouse hippocampal DG region using thioflavin‐S staining. (H) Western blot was performed to measure the expression levels of inflammatory factors TNF‐α, IL‐6, and IL‐1β in the mouse hippocampal region. **p < 0.01, ***p < 0.001, respectively. N = 10.

Similar articles

Cited by

References

    1. de la Rosa A., Olaso‐Gonzalez G., Arc‐Chagnaud C., et al., “Physical Exercise in the Prevention and Treatment of Alzheimer's Disease,” Journal of Sport and Health Science 9, no. 5 (2020): 394–404, 10.1016/j.jshs.2020.01.004. - DOI - PMC - PubMed
    1. Weller J. and Budson A., “Current Understanding of Alzheimer's Disease Diagnosis and Treatment,” F1000Research 7 (2018): F1000 Faculty Rev‐1161, 10.12688/f1000research.14506.1. - DOI - PMC - PubMed
    1. Bondi M. W., Edmonds E. C., and Salmon D. P., “Alzheimer's Disease: Past, Present, and Future,” Journal of the International Neuropsychological Society 23, no. 9–10 (2017): 818–831, 10.1017/S135561771700100X. - DOI - PMC - PubMed
    1. Ali M. and Cascella M., “ICU Delirium,” in StatPearls (StatPearls Publishing, 2024). - PubMed
    1. Lei P., Ayton S., and Bush A. I., “The Essential Elements of Alzheimer's Disease,” Journal of Biological Chemistry 296 (2021): 100105, 10.1074/jbc.REV120.008207. - DOI - PMC - PubMed