. 2025 Mar 18:32:101674.
doi: 10.1016/j.mtbio.2025.101674. eCollection 2025 Jun.

Modeling a mesenchymal cell state by bioprinting for the molecular analysis of dormancy in melanoma

Affiliations

Modeling a mesenchymal cell state by bioprinting for the molecular analysis of dormancy in melanoma

Sonja K Schmidt et al. Mater Today Bio. .

Abstract

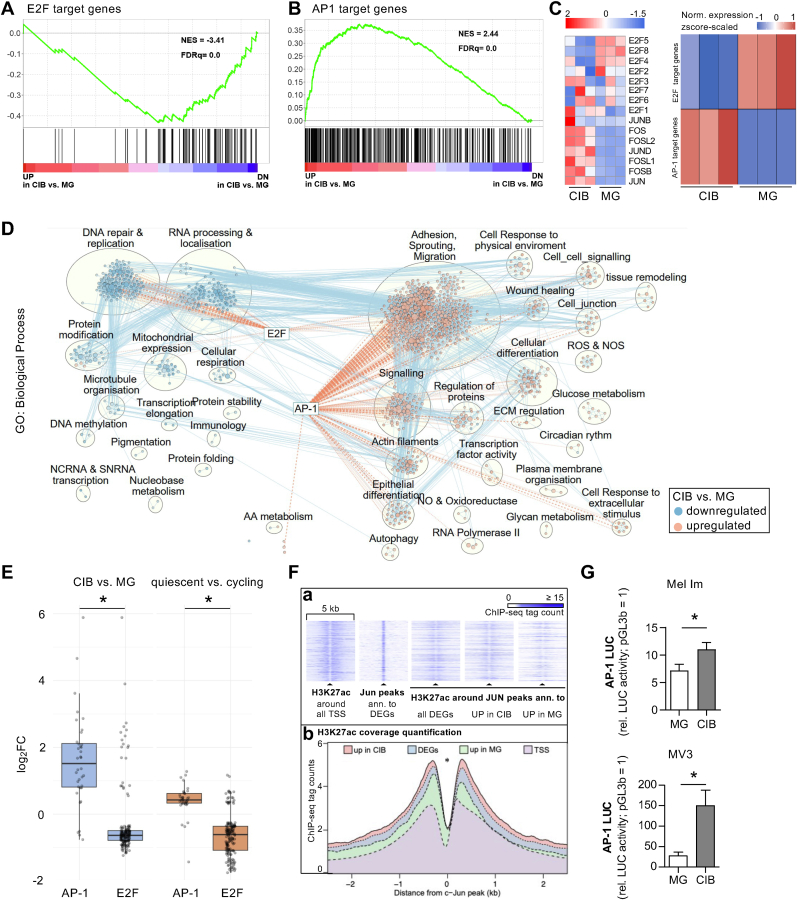
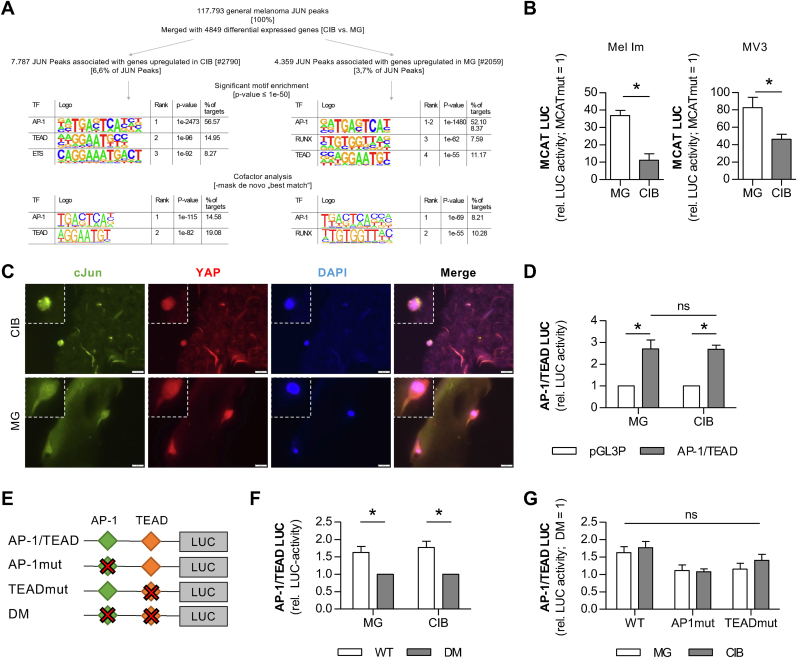
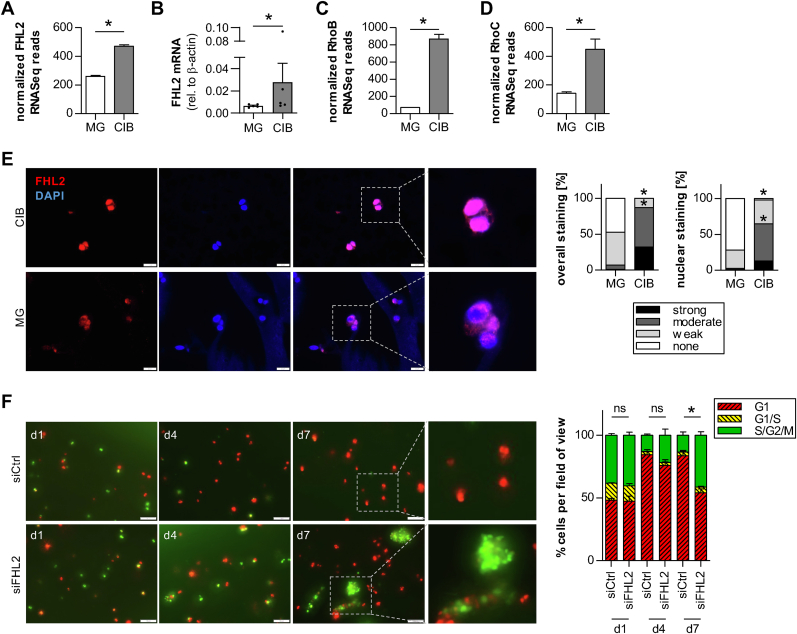
Malignant melanoma is a highly aggressive tumor originating from the pigment producing cells, the melanocytes. It accounts for the majority of skin cancer related deaths worldwide. This is often due to the development of therapy resistance or tumor dormancy, eventually resulting in tumor relapse by yet undefined mechanisms. Tumor dormancy is thought to be mediated by the cellular microenvironment and models taking this factor into account are urgently needed. We 3D bioprinted melanoma cells in the hydrogels Cellink Bioink (CIB) or Matrigel (MG), each as a substitute of the extracellular matrix, and, thereby, induced a quiescent or a proliferative phenotype of the melanoma cell lines, respectively. RNA-Seq with subsequent comprehensive bioinformatical and molecular analyses assigned CIB-cultured cells to a predominantly mesenchymal and Matrigel-cultured cells to a more mitotic phenotype, emphasizing the CIB model as a suitable platform for the investigation of dormancy under consideration of the microenvironment. Melanoma cells in CIB 3D culture reflect a quiescent and migratory active cell state e.g. by revealing significant downregulation of genes associated with replication and cell cycle progression in this setting. Using this model system, we identified the mechanosensory gene FHL2 as one early sensor of changes in the ECM and suggest a FHL2-p21/AP-1 axis contributing to the dormant phenotype of melanoma cells in CIB.

Keywords: 3D cell culture; Bioinformatics; Cancer; Mechanosensation; Quiescence.


Conflict of interest statement

The authors declare no conflict of interest.

Figures

Image 1
Graphical abstract
Fig. 1
Fig. 1
Comparison of melanoma cell lines cultured in Cellink Bioink (CIB) or Matrigel (MG). A) Microscopic images of MV3 FUCCI cultured in CIB or MG, respectively, on day 1, 4 and 7 after printing. Scale bar = 100 μm. B) Quantification of the FUCCI cell cycle indicator in MV3 cultured in CIB or Matrigel, respectively, on day 1,4 and 7 after printing shows the accumulation of cells in G1 phase in CIB. ∗p < 0.05 (Two-Way-ANOVA followed by Bonferroni post-test). C) Principal Component Analysis (PCA) of Mel Im RNA-Seq samples. D) Volcano plot of differentially expressed genes (DEGs) in CIB- compared to MG-cultured Mel Im cells. 2059 genes are significantly downregulated in CIB (log-fold change (LFC) < 0; padj < 0.1). Genes with a LFC <1.5 are colored in blue. 2790 genes are significantly upregulated in CIB (LFC >0; padj < 0.1). Genes with a LFC >1.5 are colored in red. Gene Set Enrichment Analysis (GSEA) of DEGs in CIB versus MG using the gene sets of E) GO: Biological ProcessF) GO: Molecular FunctionG) GO: Cellular Component. The enrichments are illustrated by either negative (downregulated in CIB vs. MG) or positive (upregulated in CIB vs. MG) normalized enrichment scores (NES) and the enriched gene sets were summarized by function. Each bar describes a gene set and the color describes the functional affiliation of the gene sets. H) The DEGs resulting from RNA-Seq of quiescent or cycling melanoma cells by La et al. and the DEGs comparing Mel Im cultivated in CIB- or MG show an overlap of 565 genes [33]. 483 genes (∼85 %) of the common DEGs show the same direction of regulation. I) Overrepresentation analysis with Metascape v 3.5.20240901 [23] of the common upregulated DEGs in CIB/quiescent and MG/cycling. The sizes of the dots indicate the gene set size and the color represents the statistical significance of the overrepresentation illustrated on the x-axis [-log10(P-value)].
Fig. 2
Fig. 2
CIB culture induces a stable mesenchymal phenotype of Mel Im. Assignment of DEGs comparing CIB- and MG-cultured cells with published scRNA-Seq data of malignant melanoma [34]. The cell state annotated marker genes described by Pozniak et al. were used to match the CIB specific gene signature composed of upregulated genes (LFC >1.5) with the validated cell clusters in human melanoma tumor biopsy samples. A) Significantly upregulated genes in CIB cultivated cells showed an enrichment in the neural crest like and mesenchymal defined cell clusters and B) significantly upregulated genes under MG culture conditions illustrate an enrichment in the mitotic cell cluster. C) Expression status of the respective marker genes of the mitotic, neural crest like and mesenchymal cell type clusters [34] in CIB- and MG-cultured melanoma cells based on the scaled normalized RNA-Seq count data. D) CDKN1A RNA-Seq read counts (normalized to library size) in CIB- and MG-cultured Mel Im cells. E) CDKN1A (p21) mRNA expression analysis of Mel Im cultured in CIB or MG by qRT-PCR. F) Immunohistochemical staining for p21 on fixed and paraffin-embedded sections of CIB- or MG-cultured Mel Im. Scale bar = 100 μm. G) Representative images and quantification of Mel Im FUCCI after siPool mediated knockdown of p21 in CIB culture. Scale bar = 100 μm. H) KLF4 RNA-Seq read counts (normalized to library size) in CIB- and MG-cultured Mel Im cells. I) KLF4 mRNA expression analysis of Mel Im cultured in CIB or MG by qRT-PCR. J) Immunohistochemical staining for KLF4 on fixed and paraffin-embedded sections of CIB- or MG-cultured Mel Im. Scale bar = 100 μm. K) Representative images and quantification of Mel Im FUCCI after siPool mediated knockdown of KLF4 in CIB culture. Scale bar = 100 μm ∗p ≤ 0.05 (D,E,H,I: Student's t-test.G,K: Two-way ANOVA followed by Bonferroni post-test).
Fig. 3
Fig. 3
Role of the transcription factors AP1 and E2F in the microenvironmentally induced phenotype switch. Gene set enrichment analysis (GSEA) enrichment plots of A) E2F1 (TFTs) and B) AP-1 transcription factor targets among the differentially expressed genes in CIB compared to MG cultivated Mel Im. NES: normalized enrichment score; FDR: false discovery rate. C) Heatmap of selected E2F and AP-1 transcription factor family members, their expression status and the normalized expression scaled z-score of all predicted E2F and AP-1 target genes in CIB and MG culture conditions. D) RNA-Seq data network analysis of differentially expressed genes in CIB vs. MG culture by cytoscape utilizing the gene set GO: Biological Process. Networks with semantic annotations were summarized by AutoAnnotate and the presence of respective affected E2F or AP-1 target genes are illustrated by dotted lines. The blue coloring represents a downregulation and the red coloring an upregulation of the respective gene set cluster in CIB-cultured cells. E) Boxplot of potential E2F and AP-1 TFTs differentially expressed in CIB- vs. MG-cultured cells and quiescent vs dormant melanoma cells [33]. ∗padj< 0.0001 (ANOVA test followed by Tukey's Honest Significant Difference (HSD) post-hoc test) (CIB vs. MG: padj < 2E-16; Quiescent vs. Cycling: padj < 9.1E-10). F) (a) Heat maps and histograms of ChIP-Seq tag counts of the histone acetylation status (H3K27ac) in a 5-kb wide range around the TSS or JUN peaks, respectively. The annotated JUN peaks in transcriptionally active regions were assigned to all differentially expressed genes, to upregulated genes in CIB and to upregulated genes in MG-cultured Mel Im. TSS: transcription start site; ann.: annotated; DEGs: differentially regulated genes; UP: upregulated. (b) Quantification of (a)∗p < 2.2E -16 (Wilcoxon test, paired, two-sided). G) Luciferase assay of Mel Im or MV3 cultured in CIB or MG, respectively, shows increased activity of AP-1 in CIB culture. ∗p < 0.05 (Student's t-test).
Fig. 4
Fig. 4
Role of the mechanosensory TEAD transcription factor family in the quiescent phenotype induced in CIB. A) Homer motif analysis in JUN-bound regions, which were derived from 5 different melanoma cell lines and associated with upregulated genes in CIB and MG, respectively. Motif enrichment was calculated with HOMER software, applying cumulative hypergeometric distribution adjusted for multiple testing with the Benjamini-Hochberg method. Potential cofactor binding was determined by masking the de novo best match. B) MCAT-Luciferase assays (reporter vector containing four MCAT-elements as binding sites for TEAD) of Mel Im (n = 3) or MV3 (n = 5) cultured in CIB or MG, respectively, show increased activity of TEADs in Matrigel. C) Immunofluorescent staining for c-Jun and the TEAD cofactor YAP on fixed and paraffin-embedded sections of CIB- or MG-cultured Mel Im. Scale bar = 20 μm. D) Luciferase assays with a plasmid carrying both an AP-1 and a TEAD binding site were conducted in Mel Im cultured in CIB or MG and revealed equal LUC-activity compared to the pGL3Promotor (pGL3P) empty vector in both conditions. E) Schematic overview of the binding-site (BS) mutants generated by side-directed mutagenesis of the AP-1/TEAD LUC-construct. AP-1/TEAD carries both intact BS, while in AP-1mut the AP-1, in the TEADmut the TEAD BS, and in the double mutant (DM) both BS were destroyed. F) AP-1/TEAD luciferase assays in Mel Im cultured in CIB or MG compared to the double mutant (DM). G) Luciferase assays comparing the normalized activity of AP-1/TEAD, AP-1mut, or TEADmut promotors in Mel Im cultured in CIB or MG. ∗p < 0.05 (B: Student's t-test,D,F,G: Two-Way-ANOVA followed by Bonferroni post-test).
Fig. 5
Fig. 5
Role of the mechanosensory gene FHL2 in the CIB-induced quiescent phenotype. A) FHL2 RNA-Seq reads in Mel Im cultured in CIB or MG. B) FHL2 mRNA expression analysis of Mel Im cultured in CIB or MG by qRT-PCR; n = 5. C) RhoB RNA-Seq reads in Mel Im cultured in CIB or MG. D) RhoC RNA-Seq reads in Mel Im cultured in CIB or MG. E) Immunofluorescent staining for FHL2 on fixed and paraffin-embedded sections of CIB- or MG-cultured Mel Im reveals increased overall and nuclear staining of FHL2 in CIB. Scale bar = 20 μm. F) Representative images and quantification of Mel Im FUCCI after siPool mediated knockdown of FHL2 in CIB culture versus control. Outer right images show 2.5x magnifications of the marked sections from day 7. Scale bar = 100 μm ∗p < 0.05 (A,C,D: Student's t-test;B: Wilcoxon matched-pairs signed rank test;E,F: Two-Way-ANOVA followed by Bonferroni post-test).

References

    1. Weidenfeld K., Barkan D. EMT and stemness in tumor dormancy and outgrowth: are they intertwined processes? Front. Oncol. 2018;8 doi: 10.3389/FONC.2018.00381. - DOI - PMC - PubMed
    1. Luzzi K.J., MacDonald I.C., Schmidt E.E., Kerkvliet N., Morris V.L., Chambers A.F., Groom A.C. Multistep nature of metastatic inefficiency: dormancy of solitary cells after successful extravasation and limited survival of early micrometastases. Am. J. Pathol. 1998;153:865–873. doi: 10.1016/S0002-9440(10)65628-3. - DOI - PMC - PubMed
    1. Schmidt S.K., Schmid R., Arkudas A., Kengelbach-Weigand A., Bosserhoff A.K. Tumor cells develop defined cellular phenotypes after 3D-bioprinting in different bioinks. Cells. 2019;8:1295. doi: 10.3390/CELLS8101295. 8 (2019) 1295. - DOI - PMC - PubMed
    1. Schmid R., Schmidt S.K., Hazur J., Detsch R., Maurer E., Boccaccini A.R., Hauptstein J., Teßmar J., Blunk T., Schrüfer S., Schubert D.W., Horch R.E., Bosserhoff A.K., Arkudas A., Kengelbach-Weigand A. Comparison of hydrogels for the development of well-defined 3D cancer models of breast cancer and melanoma. Cancers. 2020;12:2320. doi: 10.3390/CANCERS12082320. 12 (2020) 2320. - DOI - PMC - PubMed
    1. Schmid R., Schmidt S.K., Detsch R., Horder H., Blunk T., Schrüfer S., Schubert D.W., Fischer L., Thievessen I., Heltmann-Meyer S., Steiner D., Schneidereit D., Friedrich O., Grüneboom A., Amouei H., Wajant H., Horch R.E., Bosserhoff A.K., Arkudas A., Kengelbach-Weigand A. A new printable alginate/hyaluronic acid/gelatin hydrogel suitable for biofabrication of in vitro and in vivo metastatic melanoma models. Adv. Funct. Mater. 2022;32 doi: 10.1002/ADFM.202107993. - DOI

LinkOut - more resources