. 2025 Mar 26:13:1449607.
doi: 10.3389/fpubh.2025.1449607. eCollection 2025.

Global trends in refractive disorders from 1990 to 2021: insights from the global burden of disease study and predictive modeling

Affiliations

Global trends in refractive disorders from 1990 to 2021: insights from the global burden of disease study and predictive modeling

Lihong Huang et al. Front Public Health. .

Abstract

Purpose: This study aims to provide global, regional, and national estimates of the refractive disorders-related burden between 1990 and 2021, stratified by subtypes.

Design: A retrospective analysis was conducted using aggregated data.

Methods: Utilizing data from the Global Burden of Diseases, Injuries, and Risk Factors Study 2021 (GBD 2021), this population-based study analyzed the burden of refractive disorders from 1990 to 2021. Estimated annual percentage changes (EAPCs) were calculated to quantify temporal trends in age-standardized rates of refractive disorder prevalence and disability-adjusted life-years (DALYs), stratified by age, sex, region, and country. The associations between EAPCs in age-standardized rates and socio-demographic index (SDI) were also examined. Using comprehensive data, we conducted predictive analyses with the Age-Period-Cohort (APC) and Autoregressive Integrated Moving Average (ARIMA) models to forecast disease prevalence and Disability-Adjusted Life Years (DALYs) for informing future public health strategies.

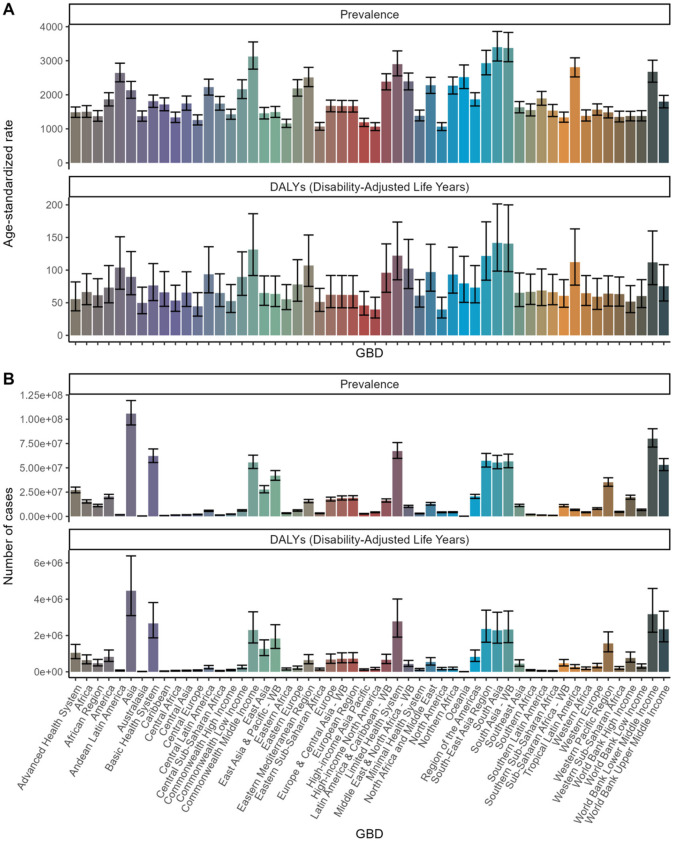
Results: Globally, the age-standardized rates of refractive disorders per 100,000 population decreased in all age groups from 1990 to 2021. Specifically, prevalence rates declined from 2,053.56 (95% uncertainty interval [UI]: 1,835.31-2,275.8) to 1919.66 (95% UI: 1,715.24-2,135.28, EAPC: -0.24), while DALYs reduced from 88.04 (95% UI: 62.19-125.15) to 79.11 (95% UI: 54.94-114.14, EAPC: -0.36). These reductions were primarily driven by a decline in refractive disorders. Notably, both the prevalence and DALYs associated with refractive disorders decreased significantly in the 60 to 64 age group. In low and low-middle SDI countries, there was a significant reduction in both prevalence and DALYs, while high and middle-high SDI countries experienced an increase in these metrics. Benin exhibited the largest increase in prevalence and burden, while India had the most significant decrease. There are notable discrepancies between countries and regions compared to GBD estimates, indicating potential underestimations of refractive disorder prevalence and burden. The APC model details age-specific trends and cohort effects, while the ARIMA model offers strong predictions from historical data. Both models underscore fluctuating disease burdens, stressing the importance of adaptive health policies to meet future healthcare needs.

Conclusion: Over the past three decades, global efforts have significantly alleviated the burden of refractive errors. However, substantial disparities persist across different types of impairment, age groups, and countries' Socio-Demographic Index (SDI). With the conclusion of the COVID-19 pandemic, it is crucial to expand eye care services, particularly in enhancing screening coverage and quality control. This study underscores the importance of addressing diverse population needs and fostering regional cooperation to improve eye health outcomes, providing a comprehensive strategy for future public health initiatives.

Keywords: age-related; disability-adjusted life years; global burden of disease study; prevalence; refraction disorder.


Conflict of interest statement

The authors declare that the research was conducted in the absence of any commercial or financial relationships that could be construed as a potential conflict of interest.

Figures

Figure 1
Figure 1
Age Trends for 2021 to forecast future trends in disease prevalence and Disability-Adjusted Life Years (DALYs). (A) Age-standardized rate. (B) Number of cases.
Figure 2
Figure 2
Age trends from 1990 to 2021 to forecast future trends in disease prevalence and Disability-Adjusted Life Years (DALYs). (A) Age-standardized rate. (B) Number of cases.
Figure 3
Figure 3
Sex Trends for 2021 to forecast future trends in disease prevalence and Disability-Adjusted Life Years (DALYs). (A) Age-standardized rate. (B) Number of cases.
Figure 4
Figure 4
Sex trends from 1990 to 2021 to forecast future trends in disease prevalence and Disability-Adjusted Life Years (DALYs). (A) Age-standardized rate. (B) Number of cases.
Figure 5
Figure 5
Country Trends for 2021: age standardized prevalence and DALY rates. Age-standardized (A, B) prevalence (C, D) DALY rates (per 100 000) by location, both sexes combined, 2019.
Figure 6
Figure 6
Country trends from 1990 to 2021: age standardized prevalence and DALY rates. Age-standardized (A, B) prevalence (C, D) DALY rates (per 100 000) by location, both sexes combined, 2019. DALY disability-adjusted life years.
Figure 7
Figure 7
Global Burden of Disease (GBD) Analysis: Prevalence and DALYs across Health Systems and Regions. (A) Age-standardized rate. (B) Number of cases.
Figure 8
Figure 8
Trends in Global Burden of Disease (GBD): Cluster analysis, estimated annual percent change data combining incidence and deaths. (Regions exhibiting significant increases (depicted in blue) may require urgent intervention and resource allocation. Regions with marked decreases (depicted in red) might provide insights into successful health strategies that could be replicated in other areas. Regions with minor changes (depicted in black and green) indicate stability but might still necessitate attention to prevent future increases.).
Figure 9
Figure 9
SDI Trends for 2021: Health burden of refraction disorders in SDI regions in 2019. Gender-specific burden in terms of age-standardized DALY rates. (A) Age-standardized prevalence of refractive disorders across SDI regions. (B) Number of cases of refractive disorders across SDI regions.
Figure 10
Figure 10
SDI trends from 1990 to 2021: Health burden of refraction disorders in SDI regions in 2019. Gender-specific burden in terms of age-standardized DALY rates. (A) Trends in age-standardized prevalence of refractive disorders across SDI regions. (B) Trends in number of cases of refractive disorders across SDI regions.
Figure 11
Figure 11
APC: Linear regression analysis of the sex-specific age-standardized incidence rate for refraction disorders from 2030 to 2040. (A) Prevalence rate. (B) DALYs rate.
Figure 12
Figure 12
Arima: Linear regression analysis of the sex-specific age-standardized incidence rate for refraction disorders from 2030 to 2040. (A) Prevalence rate. (B) DALYs rate.

Similar articles

Cited by

References

    1. Hashemi H, Pakzad R, Yekta A, Aghamirsalim M, Pakbin M, Ramin S, et al. . Global and regional prevalence of age-related cataract: a comprehensive systematic review and meta-analysis. Eye. (2020) 34:1357–70. 10.1038/s41433-020-0806-3 - DOI - PMC - PubMed
    1. Zhou X, Liu T, Wu A, Cheng B, Chen M, Wang K. Prevalence of myopia among senior students in Fenghua, Eastern China, before and during the COVID-19 pandemic. Front Public Health. (2023) 11:1180800. 10.3389/fpubh.2023.1180800 - DOI - PMC - PubMed
    1. Naidoo KS, Jaggernath J. Uncorrected refractive errors. Indian J Ophthalmol. (2012) 60:432–7. 10.4103/0301-4738.100543 - DOI - PMC - PubMed
    1. Renaud J, Bedard E. Depression in the elderly with visual impairment and its association with quality of life. Clin Interv Aging. (2013) 8:931–43. 10.2147/CIA.S27717 - DOI - PMC - PubMed
    1. Court H, McLean G, Guthrie B, Mercer SW, Smith DJ. Visual impairment is associated with physical and mental comorbidities in older adults: a cross-sectional study. BMC Med. (2014) 12:1–8. 10.1186/s12916-014-0181-7 - DOI - PMC - PubMed

LinkOut - more resources