Review
. 2025 Mar 3;12(5):nwaf082.
doi: 10.1093/nsr/nwaf082. eCollection 2025 May.

Earth's magnetic field and its relationship to the origin of life, evolution and planetary habitability

Affiliations
Review

Earth's magnetic field and its relationship to the origin of life, evolution and planetary habitability

John A Tarduno et al. Natl Sci Rev. .

Abstract

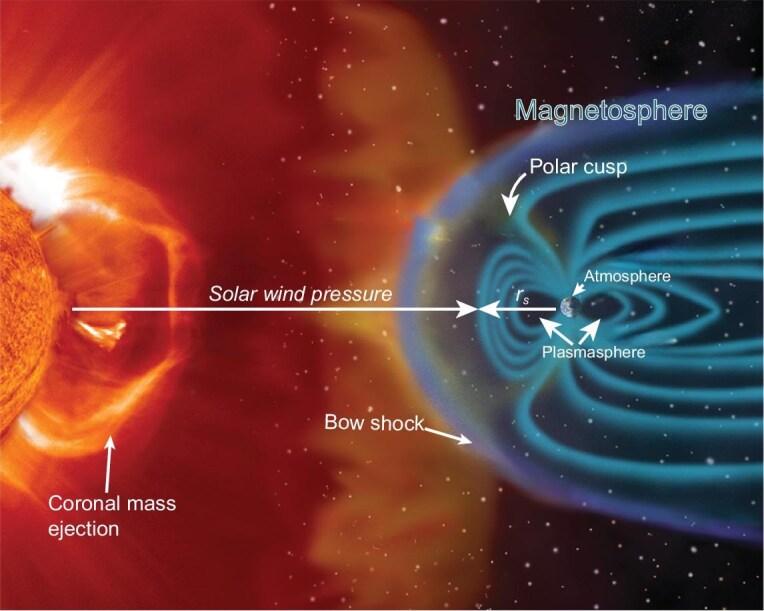
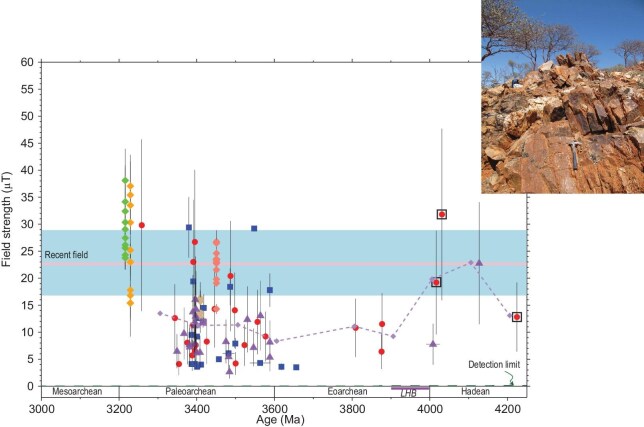
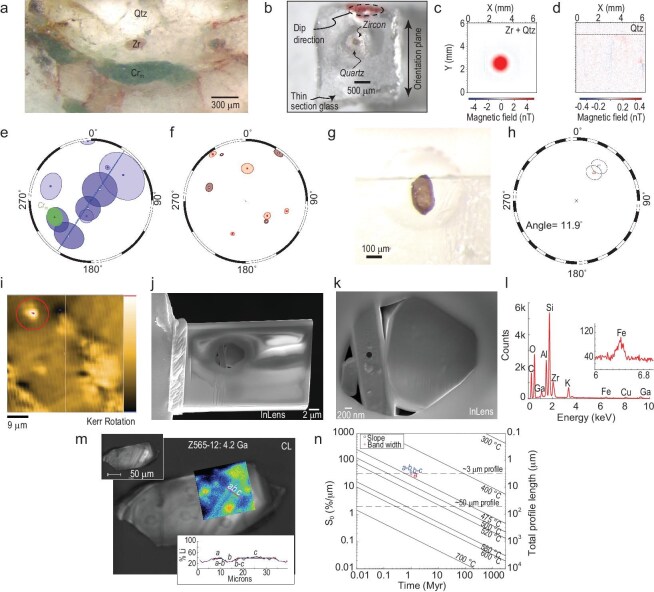
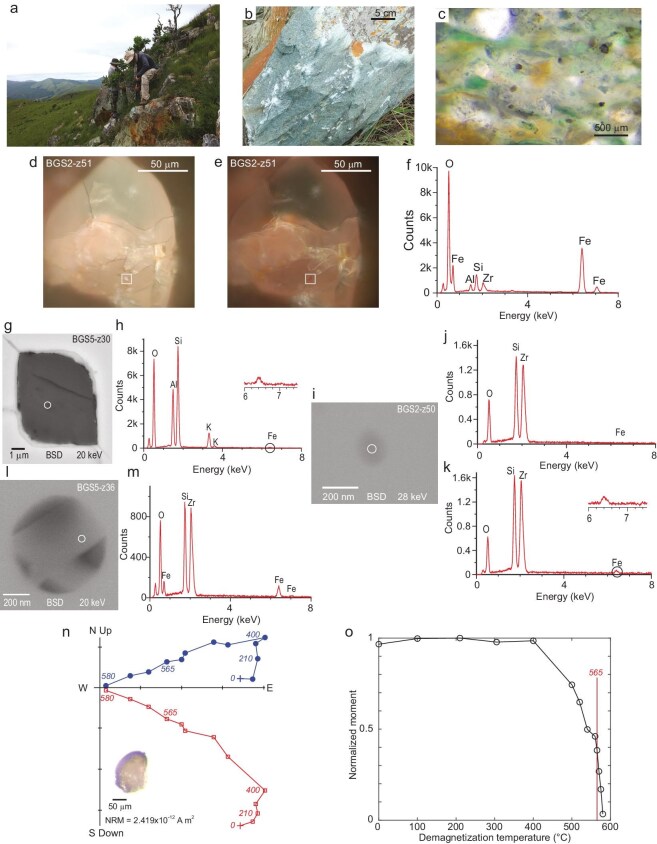
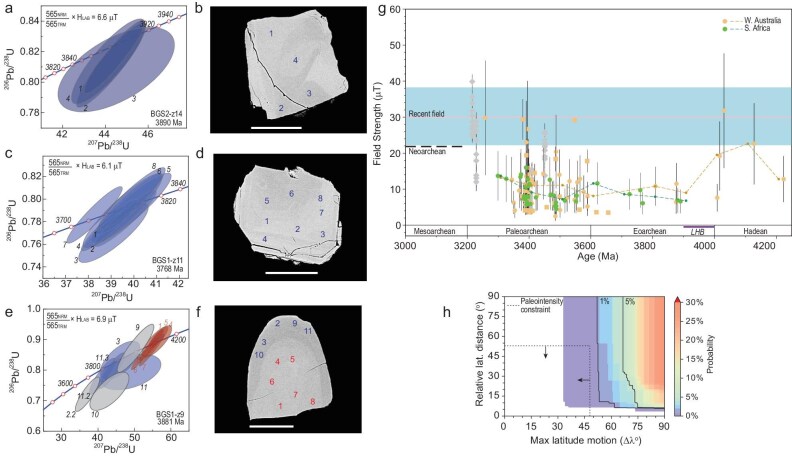
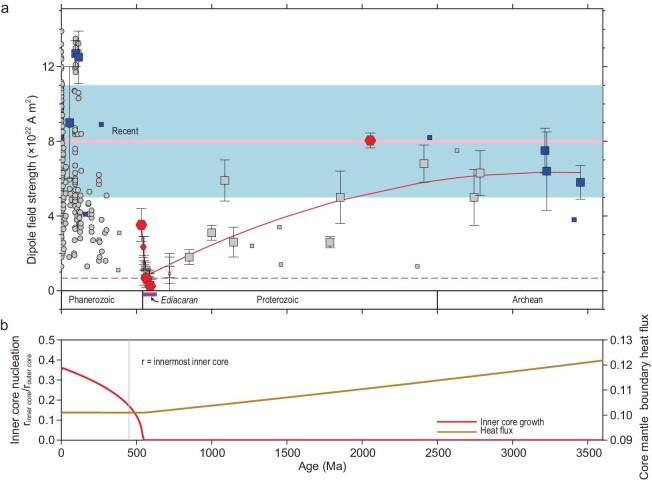
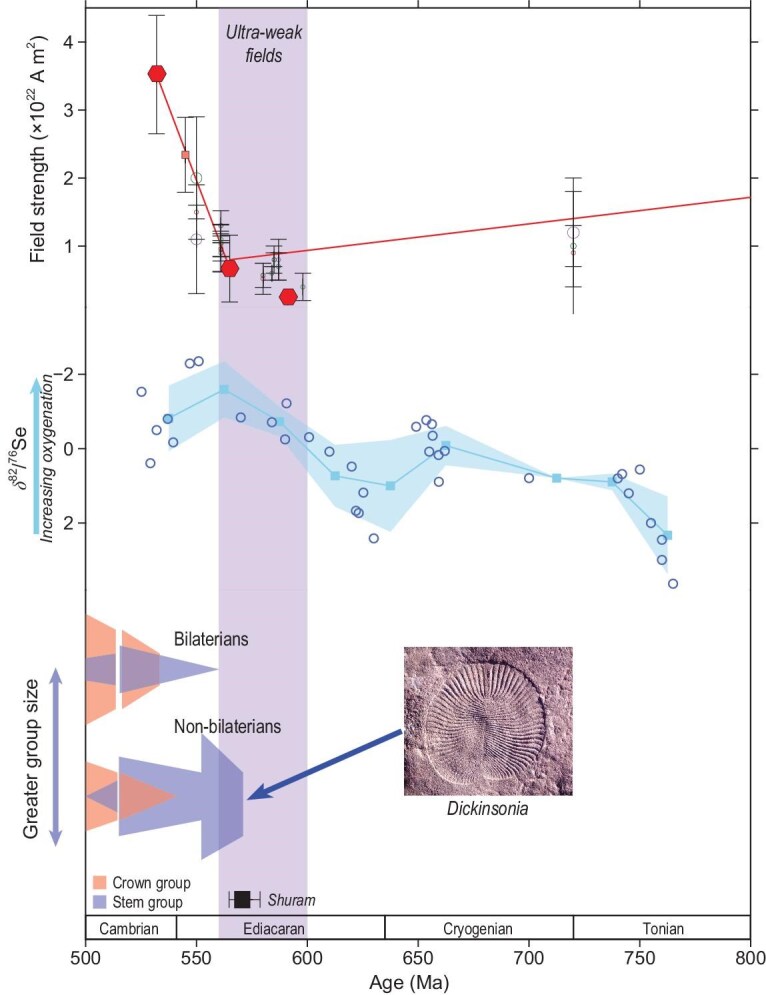
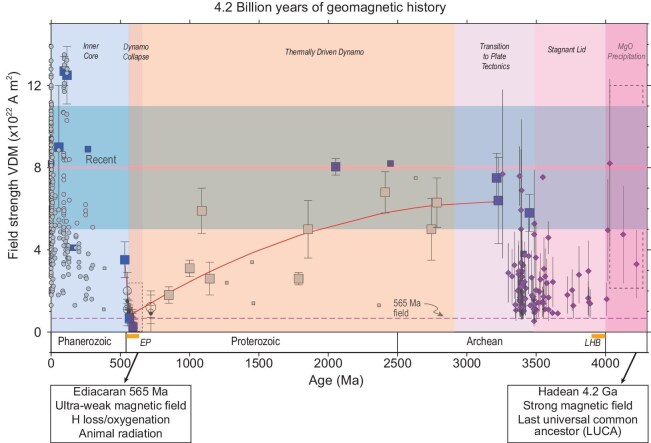
Earth's magnetic field history can provide insight into why life was able to originate and evolve on our planet, and how habitability has been maintained. The magnetism of minute magnetic inclusions in zircons indicates that the geomagnetic field is at least 4.2 billion years old, corresponding with genetic estimates for the age of the last universal common ancestor. The early establishment of the field would have provided shielding from solar and cosmic radiation, fostering environments for life to develop. The field was also likely important for preserving Earth's water, essential for life as we know it. Between 3.9 and ca. 3.4 billion years ago, zircon magnetism suggests latitudinal stasis of different ancestral terrains, and stagnant lid tectonics. These data also indicate that the solid Earth was stable with respect to the spin axis, consistent with the absence of plate tectonic driving forces. Moreover, these data point to the existence of low-latitude continental nuclei with equable climate locales that could have supported early life. Near the end of the Precambrian (0.591 to 0.565 billion years ago), the dynamo nearly collapsed, but growth of the inner core during earliest Cambrian times renewed the magnetic field and shielding, helping to prevent drying of the planet. Before this renewal, the ultra-weak magnetic shielding may have had an unexpected effect on evolution. The extremely weak field could have allowed enhanced hydrogen escape to space, leading to increased oxygenation of the atmosphere and oceans. In this way, Earth's magnetic field may have assisted the radiation of the macroscopic and mobile animals of the Ediacara fauna. Whether the Ediacara fauna are genetically related to modern life is a matter of debate, but if so, magnetospheric control on atmospheric composition may have led to an acceleration in evolution that ultimately resulted in the emergence of intelligent life.

Keywords: Ediacaran animal evolution; geomagnetic field; habitability; magnetosphere; origin of life.


Figures

Figure 1.
Figure 1.
Key features of the solar-terrestrial interaction. The solar wind is a constant stream composed of protons, electrons and alpha particles, and its interaction with Earth’s magnetic field shapes the magnetosphere. The region where solar wind pressure is balanced by the geomagnetic field is the magnetopause. Image credit: ESA/NASA - SOHO/LASCO/EIT.
Figure 2.
Figure 2.
Hadean to Paleoarchean paleointensity history from zircon magnetism of the Jack Hills, Western Australia. Zircon paleointensity: blue triangles, full Thellier determinations; red circles, formula imageC Thellier estimates from Tarduno et al. [17]; purple triangles, formula imageC Thellier estimates from Tarduno et al. [35] together with single-crystal paleointensity results from extant rocks (large diamonds). Paleointensity uncertainties shown are 1formula image. Boxes are data with formula imageLi constraints, indicating that the samples have not been reheated since formation to reset the magnetization of their included magnetite particles. Dashed line with small diamonds shows the sliding window average (see Tarduno et al. [35]). Detection limit represents the hypothetical induced magnetic field strength in the absence of a core dynamo. Pink line is the recent field referenced to the equator with 800 kyr variation (blue). Inset shows the Jack Hills Discovery Site (Western Australia) where zircon host rock samples were collected. Photo from J. Tarduno. Graph from Tarduno et al. [35], licensed under CC BY-NC-ND 4.0.
Figure 3.
Figure 3.
Jack Hills zircon magnetism tests demonstrating primary magnetic signals. (a) Photomicrograph of a sample from the Jack Hills with zircon (Zr), the chrome mica (Crformula image) fuchsite and quartz (Qtz) highlighted. (b) Illustration of the technique to obtain an oriented zircon from the Jack Hills metaconglomerate host rock. Each oriented zircon has some surrounding quartz. Subsequent measurement of only the zircon (c) with a scanning SQUID magnetometer (AIST, Japan) shows a clear signal, whereas the surrounding quartz (d) has no signal, demonstrating that oriented zircons can be used for a microconglomerate test. (e,f) Microconglomerate test results. The magnetizations isolated at temperatures less than the peak metamorphism (e) are not random, but follow a great circle path close to the direction obtained from the fuchsite, interpreted to represent the field during peak heating at 2.65 Ga [46]. The recording of this expected secondary magnetization represents a positive inverse microconglomerate test [46]. Magnetizations isolated at higher unblocking temperatures (f) cannot be distinguished from a random distribution and represent a positive microconglomerate test, and a positive type-1 primary magnetization test described here. (g) Jack Hills zircon natural remanent magnetizations have been reproduced by measurements of the same zircon at the University of Rochester using the WSG ultra-sensitive SQUID magnetometer and the scanning SQUID microscope at AIST Japan [35]. (i) NanoMOKE3 image of the surface of a Jack Hills zircon showing the magnetic signal highlighted by a red circle. (j) Focused ion-beam slice through the magnetic signal of (i), revealing a buried melt inclusion that is composed of distinct crystals (k) (scanning electron backscatter image), including feldspars and quartz. (l) Electron dispersive spectroscopy reveals iron signals in the feldspars. Images and data from Tarduno et al. [35]. (m) Scanning electron microscope backscatter image of a 4.2 Ga Jack Hills zircon, with secondary-ion mass spectrometry (SIMS) formula imageLi map (data collected with a Cameca IMS 7f by M. Fayek, University of Manitoba) overlay (blue-red colors). The formula imageLi bands in the zircon (cf. the cathodoluminescence (CL), upper right inset) are preserved, and their thicknesses measured (lower right inset). (n) Comparison of formula imageLi bands of (m) using the method of Trail et al. [49] to estimate limits of reheating. These data indicate that reheating has been limited to temperatures associated with peak metamorphism that has affected the Jack Hills (formula imageC) since the 4.2 Ga crystallization of the zircon. Panels from Tarduno et al. [35], licensed under CC BY-NC-ND 4.0.
Figure 4.
Figure 4.
Field setting thin section and scanning electron microscope images of zircons and their magnetite inclusions. (a) Sampling Green Sandstone, Barberton Mountains, South Africa (photo from J. Tarduno). (b) Green Sandstone Bed (photo from J. Tarduno). (c) Thin section of Green Sandstone showing abundant zircons. (d) Reflected light microscope image (100formula image) of zircon with the magnetite inclusion highlighted (box). (e) Image showing extinction of the magnetite grain (formula image polarization). (f) Energy dispersive spectroscopy (EDS) of magnetite inclusion highlighted in (d–e). (g) Feldspar inclusion with the EDS analysis spot highlighted that shows Fe (h) and the potential for magnetic inclusions. (i) Buried inclusion with the EDS analysis spot highlighted (circle). (j) EDS analysis of (i) at 20 keV without a clear Fe signature. (k) EDS analysis of (i) at 28 keV; the greater depth penetration showing a Fe signature demonstrates that the Fe oxide inclusion is at depth (formula imagem). (l) Melt inclusion with the EDS analysis spot highlighted (circle). (m) EDS analysis shows that crystals within the melt inclusion are iron oxide and potential remanence carriers. (n) Orthogonal vector plot of thermal demagnetization of zircon shown as inset. Temperatures shown are in degrees Celsius. (o) Normalized remanent moment versus thermal demagnetization temperature of Barberton Green Sandstone zircon, with formula imageC temperature highlighted. Near complete demagnetization by formula imageC indicates a magnetite carrier, whereas the orthogonal vector plot (n) and thermal decay characteristics support use of formula imageC as an ideal temperature for the Thellier estimate of the field strength. Panels (b) and (d–o) from Tarduno et al. [36], licensed under CC BY 4.0.
Figure 5.
Figure 5.
Geochronology paleointensity and implications for surface tectonics derived from Barberton Green Sandstone zircons. (a) U-Pb SHRIMP geochronology (analyses of W. Davis and N. Rayner GSC) for the zircon shown in backscatter scanning electron microscope image (b) with analysis locations numbered, yielding an Eoarchean age. (c) U-Pb SHRIMP geochronology for the zircon shown in backscatter scanning electron microscope image (d) with analysis locations numbered, yielding an Eoarchean age. (e) U-Pb SHRIMP geochronology for the zircon shown in backscatter scanning electron microscope image (f) with analysis locations numbered. The core yields a Hadean age, whereas the thick rim yields an Eoarchean age, suggesting that this zircon can retain magnetization only of Eoarchean age. (g) Paleointensity versus time comparing data from the Barberton Green Sandstone (green) with data from the Jack Hills (yellow). Here the recent field is referenced to the paleolatitude of Mesoarchean data [16]. The near constant values between 3.9 and ca. 3.4 Ga suggest latitudinal stasis. (h) The probability of two ‘plates’ having the relative latitude and absolute latitude motion characteristics shown in (g) based on plate tectonics of the last 600 million years (dashed lines and arrows) is less than 1%. Figure panels from Tarduno et al. [36], licensed under CC BY 4.0.
Figure 6.
Figure 6.
Paleointensity history. (a) Magnetic field strength versus age; updated summary from Bono et al. [18], Zhou et al. [77], Huang et al. [78] and Zhou et al. [100]. Filled symbols are Thellier paleointensity results. Blue and red symbols are single-crystal results with the red symbols data since 2019. Large symbols are time-averaged data. Open symbols are Cryogenian-Ediacaran non-thermal data (see Fig. 8). Fit to data (red lines) from 3450 to 565 Ma from Bono et al. [18] and fit from 565 to 532 Ma from Zhou et al. [77]. Circles are virtual dipole moment data. (b) Inner core radius and core-mantle boundary (CMB) heat flux. Dashed line shows when the radius of the inner core (formula image) is 0.5 of that today. Plots from Zhou et al. [77], licensed under CC BY 4.0.
Figure 7.
Figure 7.
Rock magnetic (magnetic hysteresis data), scanning electron microscopy and paleointensity data for 2054 Ma (Paleoproterozoic) feldspars versus 591 Ma (Ediacaran) feldspars. Data for 2054 Ma crystals are from pyroxenites of the Bushveld Complex and are as follows: (a) magnetic hysteresis loop, (b) first-order reversal curve, (c) energy dispersive spectroscopy with the inset showing the magnetic particle. Data for 591 Ma crystals (d–f) from the Passo da Fabiana gabbro; plots follow the conventions in (a–c). (g) Paleointensity data for the 2054 Ma feldspar; crystal measured is shown in the inset. Natural remanent magnetization (NRM) lost versus thermoremanent magnetization (TRM) gained (circles) with partial thermoremanent magnetization checks shown by triangles. Best fit line shown; gray circles are data used in the fit. Orthogonal vector plot of field off steps shown in the inset; red/blue portions used in the paleointensity fit. Here formula image is the applied field, formula image is the calculated ancient value. (h) Paleointensity data for the 591 Ma feldspar following the conventions in (g). Despite nearly identical recording properties, the Ediacaran crystal yields a paleointensity formula image times weaker than the Paleoproterozoic feldspar. Figure panels from Huang et al. [78], licensed under CC BY 4.0.
Figure 8.
Figure 8.
Late Precambrian-Cambrian field strength oxygenation and animal evolution. Top: Tonian to Cambrian field strength (see Fig. 6) with trend lines from Bono et al. [18] and Zhou et al. [77]. Red symbols are Thellier single-crystal time-averaged data; ultra-low values define an ultra-low time-averaged field interval (UL-TAFI). Also shown are results from whole-rock data from Shcherbakova et al. [89], Thallner et al. [90,92,93] and Lloyd et al. [91] with the following symbols: open circles are results from non-Thellier methods and their sizes are weighted by the number of cooling units; green microwave method; purple Shaw method; black Wilson method; brown open circles Thellier thermal results. Middle: oxygenation from selenium isotopes after Pogge von Strandmann et al. [143], sliding window and 1formula image uncertainty from Huang et al. [78]. Bottom: animal evolution after Zhuravlev and Wood [121], Darroch et al. [122], Muscente et al. [123] and Wood et al. [124]. The Shuram isotopic excursion is also shown for reference with ages from Rooney et al. [172]. Figure modified from Huang et al. [78], licensed under CC BY 4.0.
Figure 9.
Figure 9.
Paleointensity as a tracer of key developments of Earth’s interior, surface and magnetosphere bearing on the origin and evolution of life and habitability. Paleointensity history from extant rocks (see Fig. 6) with constraints from zircon paleomagnetism (Tarduno et al. [17,35,36]). The duality of the role of the magnetic field is highlighted. In the Hadean Eon, shielding may have assisted life and emergence of the last universal common ancestor (LUCA) that genetic analyses place at 4.2 Ga (Moody et al. [70]) whereas in the Ediacaran Period, the weak field through H escape may have facilitated oxygenation and radiation of large macroscopic animals [78].

Similar articles

References

    1. Uffen R. Influence of the Earth’s core on the origin and evolution of life. Nature 1963; 198: 143–4.10.1038/198143b0 - DOI
    1. Sagan C. Is the early evolution of life related to the development of the Earth’s core? Nature 1965; 206: 448.10.1038/206448a0 - DOI
    1. Tarduno JA, Blackman E, Mamajek E. Detecting the oldest geodynamo and attendant shielding from the solar wind: implications for habitability. Phys Earth Planet Inter 2014; 233: 68–87.10.1016/j.pepi.2014.05.007 - DOI
    1. Oparin AI . Origin of Life. New York: Macmillan, 1938.
    1. Bernal JD. Physical Basis of Life. London: Routledge and Kegan Paul, 1951.

LinkOut - more resources