

Genome-wide identification, phylogeny, and expression analysis of PEBP gene family in Castanea mollissima
- PMID: 40206507
- PMCID: PMC11979240
- DOI: 10.3389/fgene.2025.1530910
Genome-wide identification, phylogeny, and expression analysis of PEBP gene family in Castanea mollissima
Abstract
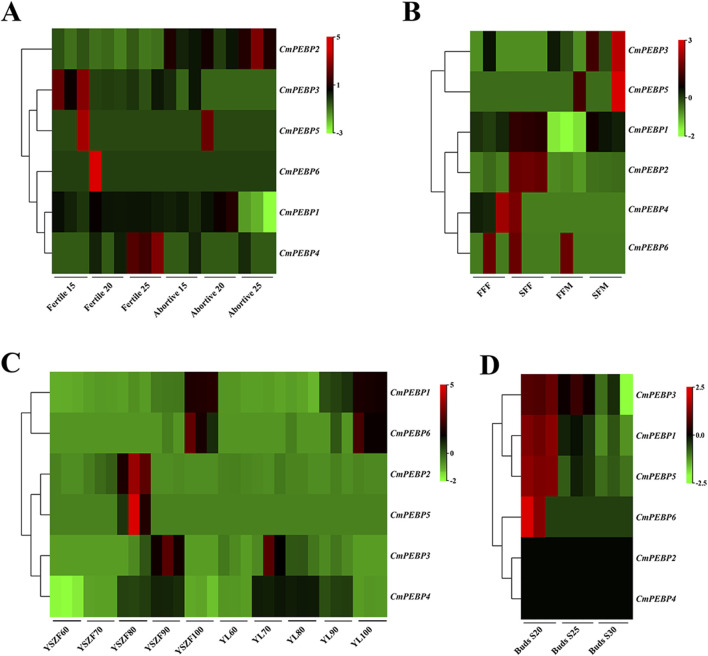
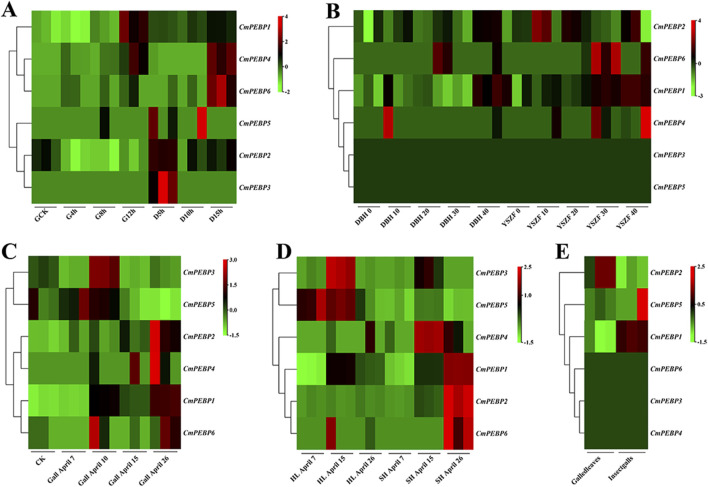
The phosphatidylethanolamine binding protein (PEBP) family plays an important part in growth and development of plants. Castanea mollissima is an economic plant with significant financial value and has become an important food source in the Northern Hemisphere. However, the PEBP genes in C. mollissima have not been studied yet. In this study, six PEBP genes (CmPEBP1 ∼ CmPEBP6) were identified in C. mollissima and comprehensively analyzed in terms of physicochemical properties, phylogeny, gene structures, cis-regulatory elements (CREs), transcription factor interaction, and expression profiles. The six CmPEBP genes were categorized into three subfamilies according to the phylogeny analysis, and all of them share extremely similar gene and protein structures. A total of 136 CREs were identified in the promoter regions of the CmPEBP genes, mainly related to growth and development, environmental stress, hormone response, and light response. Comparative genomic analysis indicated that the expansion of the CmPEBP genes was mainly driven by dispersed duplication, and the CmPEBP3/CmPEBP5 derived from eudicot common hexaploidization (ECH) events retained orthologous genes in all species studied. A total of 259 transcription factors (TFs) belonging to 39 families were predicted to be regulators of CmPEBP genes, and CmPEBP4 was predicted to interact with the most TFs. The RNA-seq data analysis indicated the potential roles of CmPEBP genes in the ovule, bud, and flower development of C. mollissima, as well as in the response to temperature stress, drought stress, and the gall wasp Dryocosmus kuriphilus (GWDK) infestation. Additionally, the expression of CmPEBP genes in C. mollissima seed kernel development and their response to temperature stress were confirmed by RT-qPCR assays. This study gives references and directions for future in-depth studies of PEBP genes.
Keywords: Castanea mollissima; PEBP gene family; RT-qPCR; expression analysis; phylogeny.
Copyright © 2025 Tian, Wang, Wang, Wang, Wang, Liu, Zhang, Zhang and Yu.
Conflict of interest statement
The authors declare that the research was conducted in the absence of any commercial or financial relationships that could be construed as a potential conflict of interest.
Figures


Similar articles
-
Transcriptomics and Antioxidant Analysis of Two Chinese Chestnut (Castanea mollissima BL.) Varieties Provides New Insights Into the Mechanisms of Resistance to Gall Wasp Dryocosmus kuriphilus Infestation.Front Plant Sci. 2022 Apr 15;13:874434. doi: 10.3389/fpls.2022.874434. eCollection 2022. Front Plant Sci. 2022. PMID: 35498685 Free PMC article.
-
Characterization of DnaJ gene family in Castanea mollissima and functional analysis of CmDnaJ27 under cold and heat stresses.BMC Plant Biol. 2025 Jun 9;25(1):778. doi: 10.1186/s12870-025-06829-8. BMC Plant Biol. 2025. PMID: 40490704 Free PMC article.
-
Genome-wide identification, phylogeny, evolutionary expansion, and expression analyses of ABC gene family in Castanea mollissima under temperature stress.Plant Physiol Biochem. 2025 Feb;219:109450. doi: 10.1016/j.plaphy.2024.109450. Epub 2024 Dec 24. Plant Physiol Biochem. 2025. PMID: 39731982
-
Terpene Synthase Gene Family in Chinese Chestnut (Castanea mollissima BL.) Harbors Two Sesquiterpene Synthase Genes Implicated in Defense against Gall Wasp Dryocosmus kuriphilus.J Agric Food Chem. 2024 Jan 24;72(3):1571-1581. doi: 10.1021/acs.jafc.3c07086. Epub 2024 Jan 11. J Agric Food Chem. 2024. PMID: 38206573
-
Transcriptome Analysis of Chinese Chestnut (Castanea mollissima Blume) in Response to Dryocosmus kuriphilus Yasumatsu Infestation.Int J Mol Sci. 2019 Feb 15;20(4):855. doi: 10.3390/ijms20040855. Int J Mol Sci. 2019. PMID: 30781446 Free PMC article.
References
LinkOut - more resources
Full Text Sources
Research Materials
Miscellaneous