Peripheral Airway Obstruction in Association with Symptoms and Quality of Life in Asthma
- PMID: 40206516
- PMCID: PMC11980927
- DOI: 10.2147/JAA.S497218
Peripheral Airway Obstruction in Association with Symptoms and Quality of Life in Asthma
Abstract
Introduction: Forced Oscillation Technique (FOT) is increasingly used to measure obstruction in the airways; however, the association between airway obstruction and the actual symptom burden in asthma is not known. Therefore, we aimed to investigate central and peripheral airway obstruction, measured by FOT, in association to symptoms and quality of life in asthma.
Methods: 319 asthma patients were recruited and answered questionnaires focusing on symptoms (ACT, ACQ, Nijmegen, HADS and SNOT-22) and quality of life (MiniAQLQ and MiniRQLQ) and performed FOT measurements estimating airway resistance (R5: total resistance, R19: central resistance, R5-R19: peripheral resistance) and reactance (X5) during inspiration and expiration.
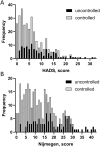
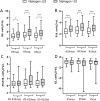
Results: Asthma groups classified based on ACT score cut-off points at 16, 20, and 25 showed higher R5, R5-R19, and lower X5 with increasing symptoms, which was not evident when applying a cut-off of only 20. ACQ-5 cut-offs at 0.75 and 1.5 captured differences in R5 and X5, whereas a Nijmegen cut-off of 23 showed differences in R5 and R19. The total scores from most questionnaires (except for the HADS and SNOT-22) correlated with many of the FOT results, but there were different patterns of correlation between airway obstruction and symptoms in uncontrolled and controlled asthma. Additionally, specific questions were associated with airway obstruction.
Conclusion: The increasing symptoms in patients with asthma assessed using questionnaires correlated well with predominantly increasing peripheral airway obstruction. A correlation also exists with the Nijmegen score, which is not specific to asthma. The cut-off points used to define asthma control may capture peripheral airway dysfunction.
Keywords: airway obstruction; asthma; quality of life; symptom.
© 2025 Papapostolou et al.
Conflict of interest statement
The authors report no conflicts of interest in this work.
Figures


Similar articles
-
Overall and peripheral lung function assessment by spirometry and forced oscillation technique in relation to asthma diagnosis and control.Clin Exp Allergy. 2017 Dec;47(12):1546-1554. doi: 10.1111/cea.13035. Epub 2017 Oct 20. Clin Exp Allergy. 2017. PMID: 28940832
-
Comparison of Forced Oscillation Technique, Lung Volumes by Body Plethysmography, and Spirometry in Moderate Persistent Adult Asthma.J Assoc Physicians India. 2024 May;72(5):29-35. doi: 10.59556/japi.72.0520. J Assoc Physicians India. 2024. PMID: 38881107
-
Forced Oscillation Technique and Small Airway Involvement in Chronic Hypersensitivity Pneumonitis.Arch Bronconeumol (Engl Ed). 2019 Oct;55(10):519-525. doi: 10.1016/j.arbres.2019.01.022. Epub 2019 Apr 8. Arch Bronconeumol (Engl Ed). 2019. PMID: 30975515 English, Spanish.
-
Measuring Airway Obstruction in Severe Asthma in Children.Front Pediatr. 2018 Jun 26;6:189. doi: 10.3389/fped.2018.00189. eCollection 2018. Front Pediatr. 2018. PMID: 30013960 Free PMC article. Review.
-
Oscillatory Mechanics in Asthma: Emphasis on Airway Variability and Heterogeneity.Crit Rev Biomed Eng. 2015;43(2-3):97-130. doi: 10.1615/CritRevBiomedEng.v43.i2-3.10. Crit Rev Biomed Eng. 2015. PMID: 27278738 Review.
References
-
- GINA. GINA main report 2023. Available from: https://ginasthma.org/wp-content/uploads/2023/07/GINA-2023-Full-report-2.... Accessed March 20, 2025.
LinkOut - more resources
Full Text Sources

