. 2025 Mar 28;16(18):8023-8029.
doi: 10.1039/d5sc00332f. eCollection 2025 May 7.

Highly selective DNA aptamer sensor for intracellular detection of coenzyme A

Affiliations

Highly selective DNA aptamer sensor for intracellular detection of coenzyme A

Yuan Ma et al. Chem Sci. .

Abstract

Detecting Coenzyme A (CoA) in cells is vital for understanding its role in metabolism. DNA aptamers, though widely used for monitoring many other molecules, have not been effective for CoA detection, as previous attempts at obtaining DNA aptamers for CoA using SELEX resulted in aptamers that only recognize the adenine moiety of CoA. This "tyranny" of adenine dominating in SELEX has, therefore, hampered the SELEX of aptamers specific for CoA. To meet this challenge, we employed a capture SELEX method by incorporating rigorous counter selections against adenine, adenosine, ATP, pantetheine, and pantothenic acid, resulting in a highly specific DNA aptamer for CoA over adenosine, ATP and other related metabolites such as NADH, with a dissociation constant of 48.9 μM. This aptamer was then converted to a fluorescent sensor for CoA across pH 6.4-8.0. Confocal microscopy showed its ability to visualize CoA in living cells, with fluorescence changes observed upon manipulating CoA levels. This method broadens SELEX's application and presents a promising approach for studying and understanding CoA dynamics.


Conflict of interest statement

There are no conflicts to declare.

Figures

Fig. 1
Fig. 1. Chemical structure of Coenzyme A (CoA), showing key structural motifs including adenosine 3′,5′-diphosphate, 4-phosphopantetheine, and 4-phosphopantothenic acid.
Fig. 2
Fig. 2. Selection of CoA aptamer. (a) In vitro selection process for obtaining the CoA aptamer. Each DNA library strand contains a 40-nucleotide randomized sequence (red) flanked by two constant sequences (purple, blue, and black) at both ends, serving as PCR primers. The binding region between the capture strand and the DNA library is highlighted in purple. The forward primer consists of purple and blue regions, and the reverse primer is composed of blue and black regions. After immobilizing the DNA library onto beads (yellow), CoA is introduced into the solution. DNA strands that bind to CoA undergo a structural switch, detaching from the capture strand and entering the solution, forming a stem-loop structure with sequences represented by blue color. These eluted strands are then PCR amplified, and ssDNA libraries are prepared. After re-immobilizing the DNA library onto the beads, counter-selection molecules are added to the solution, and the non-specific DNA strands are removed. The DNA library is then incubated with CoA, and the eluted CoA-aptamer DNA is collected. This selection process is repeated multiple times. (b) CoA-seq10 aptamer sequence and its predicted secondary structure, generated using UNAfold software. The sequence is illustrated with different colors, whose function is explained in legends of (a). The UNAfold prediction illustrates the secondary structure of the CoA aptamer upon binding to CoA.
Fig. 3
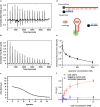
Fig. 3. Characterization of CoA-seq10 aptamer sensor. (a) Thermogram for the ITC titration of 300 μM CoA-seq10 titrated by 3.2 mM CoA in aptamer binding buffer; (b) thermogram for the ITC titration of aptamer binding buffer by 3.2 mM CoA in the same buffer; (c) integrated heat of the ITC titration for CoA-seq10 and CoA, the black line represents the binding curve fitted with the ‘one set of binding sites’ model; (d) general setup of the CoA aptamer sensor's structure switching mechanism. (e) Normalized fluorescence intensity of different aptamer : quencher ratios, when aptamer concentration is 50 nM. (f) Normalized fluorescence of CoA-seq10 aptamer sensor versus a negative control with scrambled sequences.
Fig. 4
Fig. 4. CoA aptamer sensor's selectivity against similar molecules to CoA. (a) Normalized fluorescence of the CoA-seq10 aptamer sensor's selectivity with concentration dependence of analytes. (b) Normalized fluorescence of the CoA-seq10 aptamer sensor's selectivity with physiologically relevant concentrations of analytes.
Fig. 5
Fig. 5. CoA aptamer sensor detects CoA regulation in HeLa cells. (a) CLSM images of CoA using the CoA-seq10 sensor and NC sensor in live HeLa cells during CoA regulation. (b) Quantification of average fluorescence intensity (arbitrary units, a.u.) per cell shown in (a); ***P < 0.0001. Data in (a) and (b) represent three independent experiments; n = 5 frames. Scale bar is 50 μm. Data are shown as mean  ±  s.d. Statistical significance was determined by unpaired two-tailed Student's t-test; NS, not significant (P > 0.05); *** (P < 0.001).

Similar articles

References

    1. Tuerk C. Gold L. Science. 1990;249:505–510. doi: 10.1126/science.2200121. - DOI - PubMed
    1. Ellington A. D. Szostak J. W. Nature. 1990;346:818–822. doi: 10.1038/346818a0. - DOI - PubMed
    1. Huizenga D. E. Szostak J. W. Biochemistry. 1995;34:656–665. - PubMed
    1. Zhou W. Huang P.-J. J. Ding J. Liu J. Analyst. 2014;139:2627–2640. doi: 10.1039/C4AN00132J. - DOI - PubMed
    1. Dougherty C. A. Cai W. Hong H. Curr. Top. Med. Chem. 2015;15:1138–1152. doi: 10.2174/1568026615666150413153400. - DOI - PMC - PubMed

LinkOut - more resources