. 2025 Mar 7;36(2):102506.
doi: 10.1016/j.omtn.2025.102506. eCollection 2025 Jun 10.

AAV-mediated GBA1 and GDNF rescue neurological defects in a murine model of neuronopathic Gaucher disease

Affiliations

AAV-mediated GBA1 and GDNF rescue neurological defects in a murine model of neuronopathic Gaucher disease

Yuan Meng et al. Mol Ther Nucleic Acids. .

Abstract

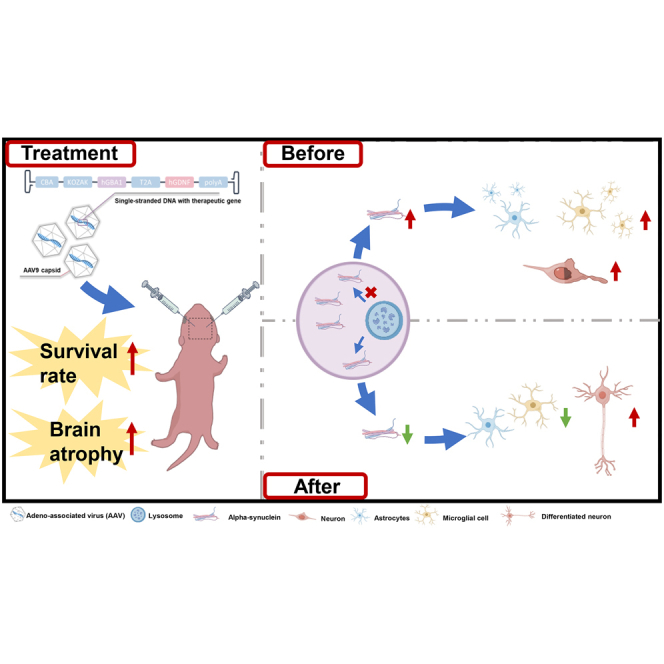
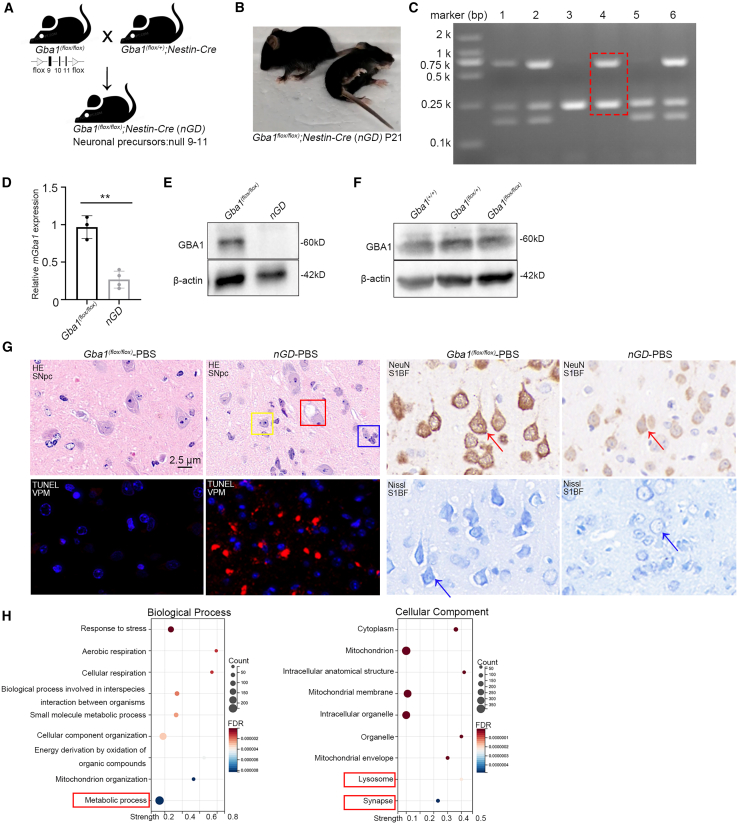
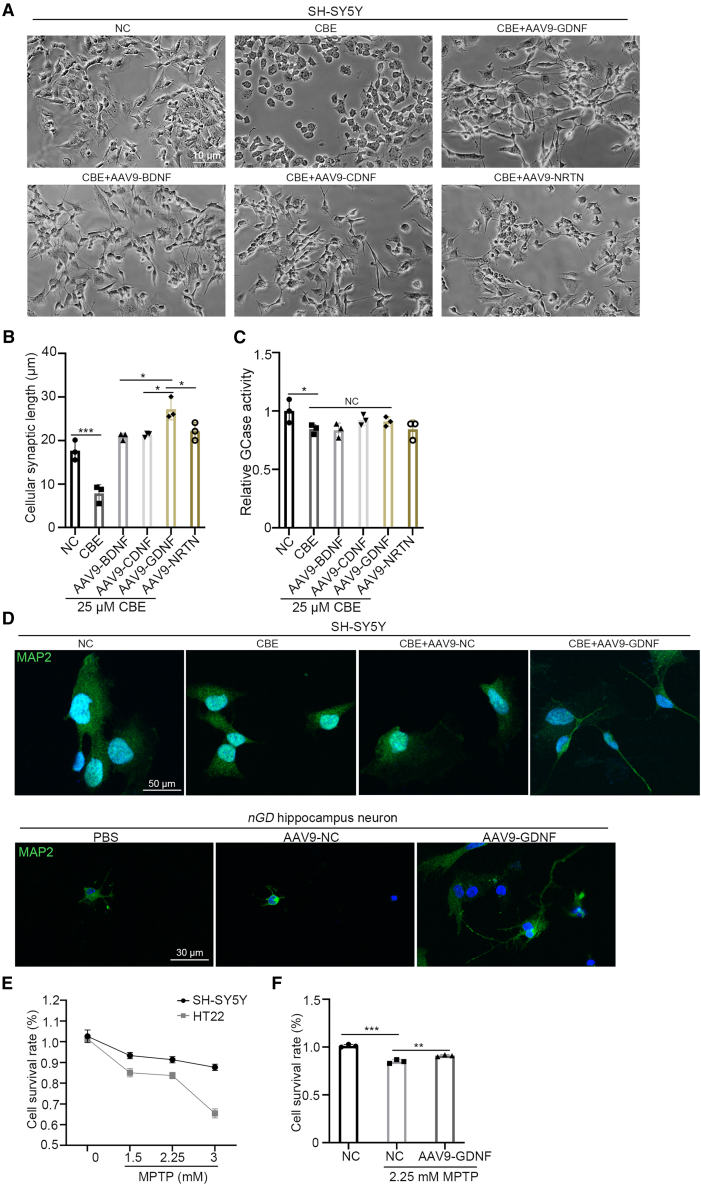
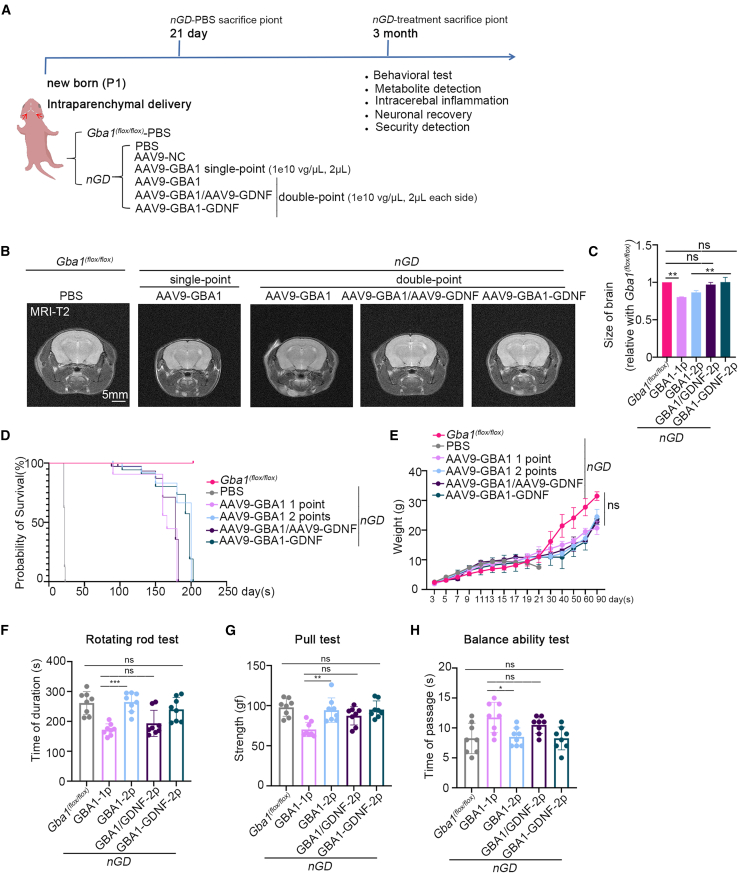
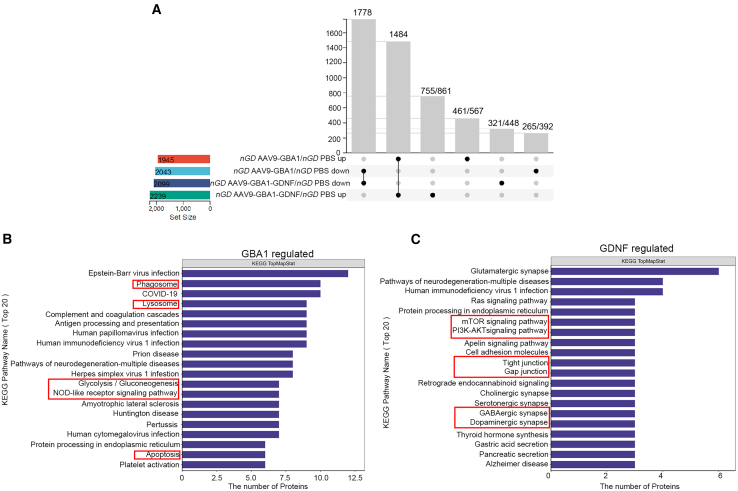
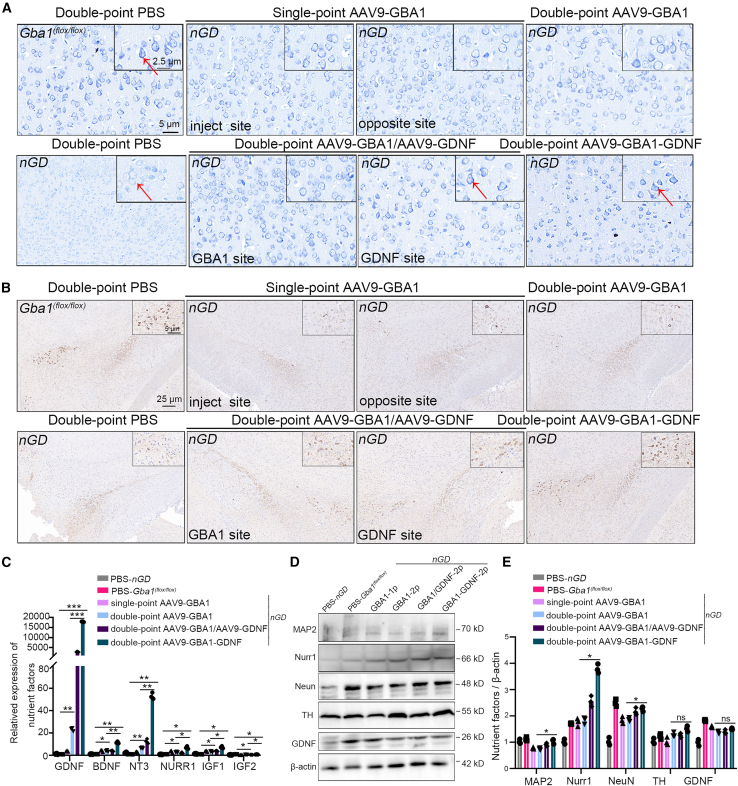
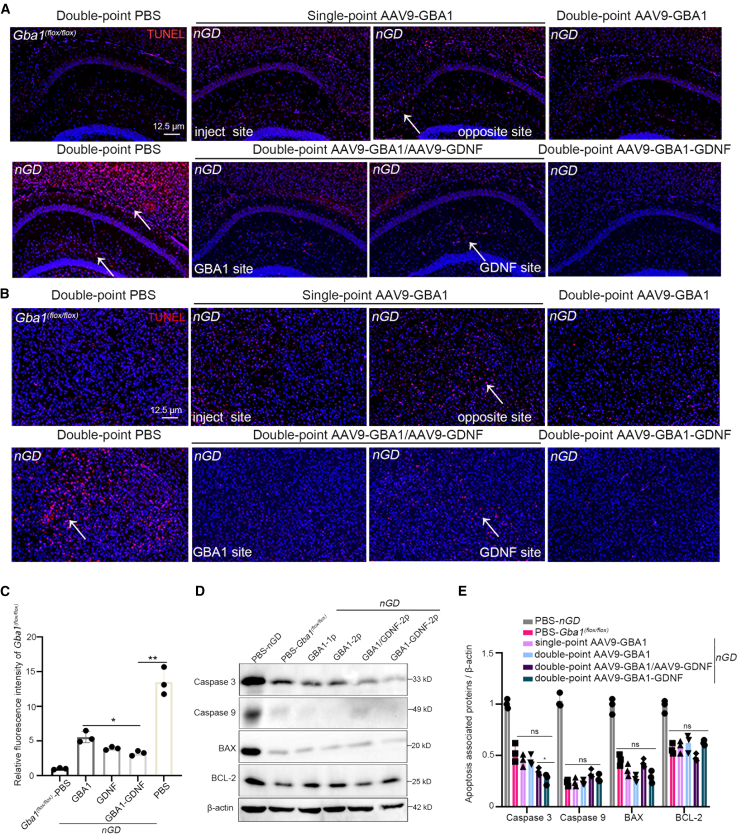
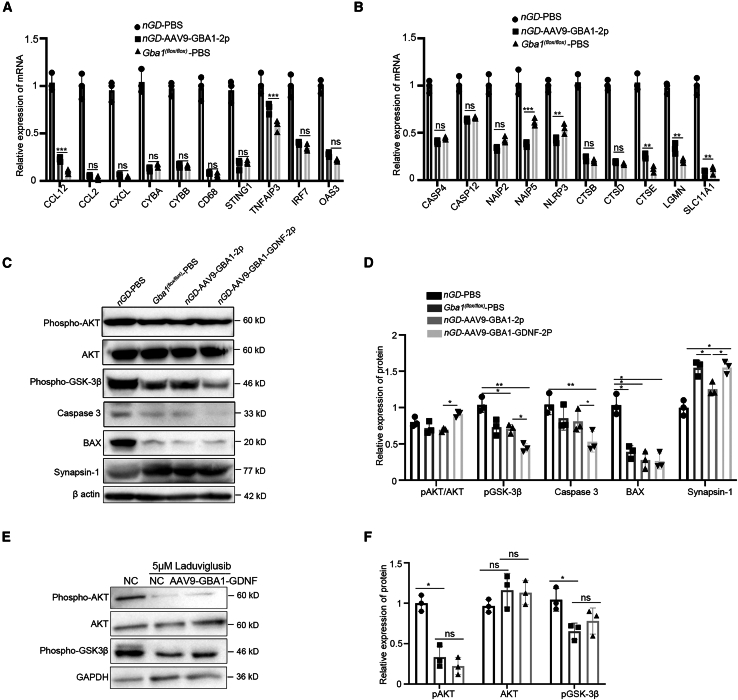
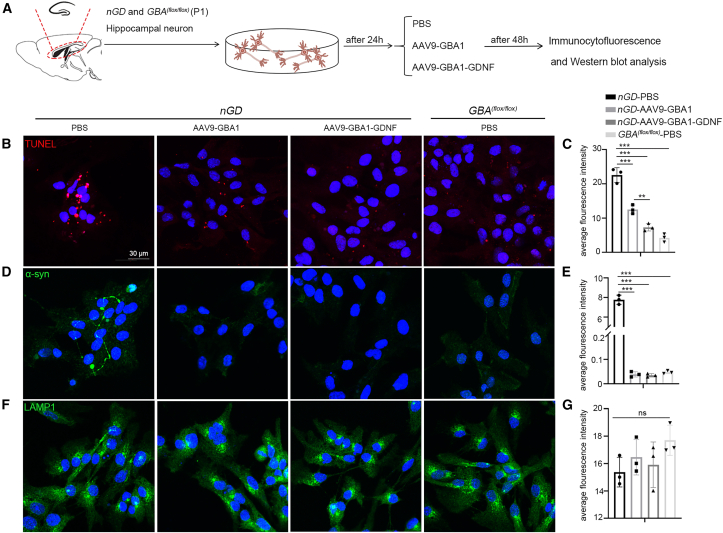
Neuropathic Gaucher disease (nGD) is a life-threatening disease that progresses rapidly and is caused by a glucosylceramidase beta 1 (GBA1) mutation, which encodes the lysosomal hydrolase β-glucocerebrosidase (GCase). Nerve damage in nGD, associated with stunted growth and development, arises from the degeneration and death of nervous system cells, which is often irreversible. Approved therapies effectively reduce the substrate burden outside the central nervous system (CNS) through augmenting mutant enzyme activity with pharmacologic recombinant GCase or by inhibiting glucocerebroside synthesis. However, these therapies do not provide neuroprotection. In this study, we developed a novel double-gene therapy based on adeno-associated virus (AAV), AAV9-GBA1-GDNF, which stably expresses human GBA1 and glial derived neurotrophic factor (GDNF) over the long term. Pathological, molecular, and proteomic tests in the nGD model confirmed that the early stages of the disease are characterized by GBA1 deficiency, loss of neuronal function, and even neuronal death. After treatment with AAV9-GBA1-GDNF, the lifespan of nGD mice was extended, and weight, brain development, and motor ability were recovered. Additionally, GBA1 and GDNF additively prevented irreversible neuronal death by activating the AKT/GSK3β pathway. These findings offer potential therapeutic strategies for nGD and other neurodegenerative diseases associated with lysosomal dysfunction.

Keywords: AAV; Dual targets; GBA1 related PD; GD; GDNF; MT; Neurodegeneration; Neurotrophic factors; Oligonucleotides; Therapies and Applications.


Conflict of interest statement

The authors declare no competing interests.

Figures

None
Graphical abstract
Figure 1
Figure 1
Neuropathological changes in nGD mice (A) Schematic view of the generation of nGD mice, Gba1(flox/flox) mice with exons 9–11 being flanked by two loxP sites and being deleted in the central nervous system upon mating with the Gba1(flox/+); Nestin-Cre mice. (B) The morphology of nGD mice at P21. (C) Identification of nGD mice genotype by agarose gel electrophoresis. (D) The expression of GBA1 molecule and (E) GBA1 protein level of nGD and Gba1(flox/flox) mice brain. (F) Western blot analysis of GBA1 protein in the brains of Gba1(+/+), Gba1(flox/+), and Gba1(flox/flox) mice. (G) Sections of brain tissue from nGD and Gba1(flox/flox) mice. (H) Biological process and cellular component GO functional annotation analysis of nGD and Gba1(flox/flox) mice. All data are expressed as mean ± standard deviation. The one-way ANOVA method was used for the analysis. Tukey’s method was used for multigroup comparisons (n = 3 per group). ∗∗p < 0.01.
Figure 2
Figure 2
The role of neurotrophic factors in in vitro conditions (A) Addition of the inhibitor CBE to the SH-SY5Y cells and synaptogenesis induced by the neurotrophic factor. (B) Measurement of SH-SY5Y synaptic length. (C) Measurement of SH-SY5Y GCase activity. (D) SH-SY5Y and nGD hippocampal neuron treated by PBS or AAV9-GDNF. (E) CCK8 detected the survival rate of SH-SY5Y and HT22 cells after MPTP treatment. (F) Survival rates of untreated, MPTP-treated, MPTP, and GDNF-treated HT22 cells were measured using CCK8. All data are expressed as mean ± standard deviation. The one-way ANOVA method was used for the analysis. Tukey’s method was used for multigroup comparisons (n = 3 per group). ∗p < 0.05, ∗∗p < 0.01, ∗∗∗p < 0.001.
Figure 3
Figure 3
Behavioral assessment of the nGD mice at 3 months post-delivery (A) Flow diagram of administration. (B) Images of the T2-weighted maximum cross-section of the brains of mice in the MRI. The treatment group and the control group at 3 months post-delivery. (C) Quantitative statistical graph of (B). (D) and (E) Survival curves and weight monitoring of mice in the Gba1(flox/flox), nGD, and nGD treatment groups. (F), (G), and (H) The running time (s), value of the tension tester (gf), passing time of mice in the Gba1(flox/flox) and nGD treatment groups. All data are expressed as mean ± standard deviation. The one-way ANOVA method was used for the analysis. Tukey’s method was used for multigroup comparisons (n = 8 per group). ∗p < 0.05, ∗∗p < 0.01, ∗∗∗p < 0.001.
Figure 4
Figure 4
Proteomic analysis of the brain tissue after treatment in the nGD mice (A) Three months post-delivery of AAV9-GBA1 and AAV9-GBA1-GDNF, Venn maps related to pathogenic proteins were drawn using proteomic sequencing. (B) KEGG pathway analysis via proteomic sequencing 3 months post-delivery of AAV9-GBA1. (C) KEGG pathway analysis by proteomic sequencing 3 months post-delivery of AAV9-GBA1-GDNF treatment. KEGG, Kyoto Encyclopedia of Genes and Genomes. (n = 3 per group).
Figure 5
Figure 5
Neuronal recovery in the brain of nGD mice after treatment (A) Three months post-delivery, Nissl staining of the fifth layer of the S1BF section of mice with Gba1(flox/flox), nGD, and nGD treatment groups, is indicated with the small box showing an enlarged image of the selected area. (B) TH staining of the SNpc brain sections of mice in the Gba1(flox/flox), nGD, and nGD treatment groups, the circles represent positive areas. (C) Relative mRNA expression of the nutrient factor by 2−ΔΔCT after homogenization in the whole-brain tissue of mice in the Gba1(flox/flox), nGD, and nGD treatment groups. (D) Expression levels of neuron-related proteins in the whole brain of Gba1(flox/flox), nGD, and nGD treatment groups detected using western blot. (E) Statistical quantitative graph of (D). All data are expressed as mean ± standard deviation. The one-way ANOVA method was used for the analysis. Tukey’s method was used for multigroup comparisons (n = 3 per group). ∗p < 0.05, ∗∗p < 0.01, ∗∗∗p < 0.001. TH, tyrosine hydroxylase.
Figure 6
Figure 6
Apoptosis was detected in nGD mice after treatment (A) TUNEL staining was observed in hippocampus and (B) VPM regions of Gba1(flox/flox), nGD, and nGD treatment groups. The positive cells and nuclei were red and blue, respectively. (C) Relative fluorescence intensity of (A) and (B). (D) Expression of apoptosis-related proteins in the Gba1(flox/flox), nGD, and nGD treatment groups was detected using western blot. (E) Statistical quantitative graph of (D). All data are expressed as mean ± standard deviation. The one-way ANOVA method was used for the analysis. Tukey’s method was used for multigroup comparisons (n = 3 per group). ∗p < 0.05.
Figure 7
Figure 7
Validation of associated genes by proteomic analysis (A) Relative expression levels of chemokines related to immune response in mice in PBS-nGD, two-point AAV9-GBA1-nGD, and PBS-Gba1(flox/flox) groups. (B) Relative expression levels of apoptosis-related molecules in PBS-nGD, two-point AAV9-GBA1-nGD, and PBS-Gba1(flox/flox) groups. (C) Western blot analysis was performed to detect pathway-related protein expression levels in PBS-nGD, two-point AAV9-GBA1-nGD, two-point AAV9-GBA1-GDNF-nGD, and PBS-Gba1(flox/flox) groups. (D) Statistical quantitative diagram of (C). (E) Western blot analysis was performed to detect untreated, 5 μM Laduviglusib treated, and 5 μM Laduviglusib and AAV9-GBA1-GDNF co-treated HT22 cells. (F) Statistical quantitative diagram of (E). All data are expressed as mean ± standard deviation. The one-way ANOVA method was used for analysis. Tukey’s method was used for multigroup comparison (n = 3 per group). ∗p < 0.05, ∗∗p < 0.01, ∗∗∗p < 0.001.
Figure 8
Figure 8
Validation of nGD primary hippocampal neurons in vitro (A) Schematic diagram of primary hippocampal neurons processing by nGD and Gba1(flox/flox). Primary hippocampal neurons were treated with PBS, AAV9-GBA1, or AAV9-GBA1-GDNF, then immunofluorescence staining by (B) and (C) TUNEL, (D) and (E) α-syn, (F) and (G) LAMP1. All data are expressed as mean ± standard deviation. One-way analysis of variance was used for statistical analysis. The Tukey method was used to compare multiple groups (n = 3 per group). ∗∗p < 0.01, ∗∗∗p < 0.001.

Similar articles

Cited by

References

    1. Schiffmann R., Sevigny J., Rolfs A., Davies E.H., Goker-Alpan O., Abdelwahab M., Vellodi A., Mengel E., Lukina E., Yoo H.W., et al. The definition of neuronopathic Gaucher disease. J. Inherit. Metab. Dis. 2020;43:1056–1059. - PMC - PubMed
    1. Biegstraaten M., van Schaik I.N., Aerts J.M.F.G., Hollak C.E.M., Hollak C.E. 'Non-neuronopathic' Gaucher disease reconsidered. Prevalence of neurological manifestations in a Dutch cohort of type I Gaucher disease patients and a systematic review of the literature. J. Inherit. Metab. Dis. 2008;31:337–349. - PubMed
    1. Daykin E.C., Ryan E., Sidransky E. Diagnosing neuronopathic Gaucher disease: New considerations and challenges in assigning Gaucher phenotypes. Mol. Genet. Metabol. 2021;132:49–58. - PMC - PubMed
    1. Weiss K., Gonzalez A., Lopez G., Pedoeim L., Groden C., Sidransky E. The clinical management of Type 2 Gaucher disease. Mol. Genet. Metabol. 2015;114:110–122. - PMC - PubMed
    1. Arévalo N.B., Lamaizon C.M., Cavieres V.A., Burgos P.V., Álvarez A.R., Yañez M.J., Zanlungo S. Neuronopathic Gaucher disease: Beyond lysosomal dysfunction. Front. Mol. Neurosci. 2022;15 - PMC - PubMed

LinkOut - more resources