

Interleukin -39 Expression in Pleural Effusion and Its Diagnostic Value for Tuberculous Pleurisy
- PMID: 40206811
- PMCID: PMC11980934
- DOI: 10.2147/JIR.S488017
Interleukin -39 Expression in Pleural Effusion and Its Diagnostic Value for Tuberculous Pleurisy
Abstract
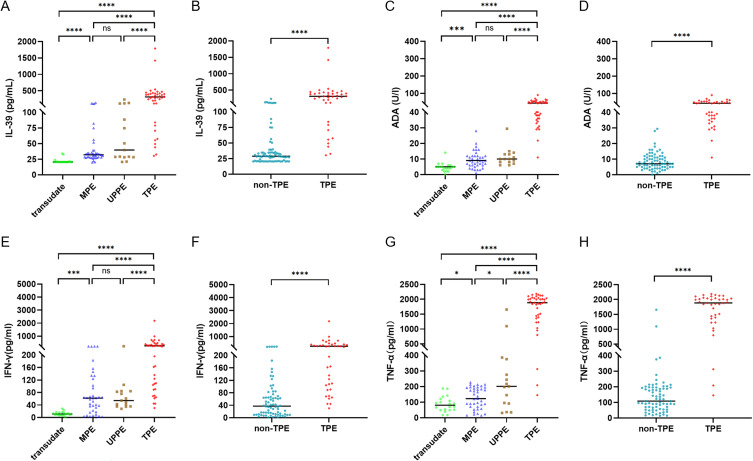
Objective: This study aimed to assess Interleukin-39 (IL-39) levels in various types of pleural effusion (PE), explore IL-39's diagnostic value in tuberculous pleurisy, analyze its correlation with other PE and tuberculosis indicators, and confirm the involvement of IL-39 in tuberculosis infection and the resulting inflammatory response.
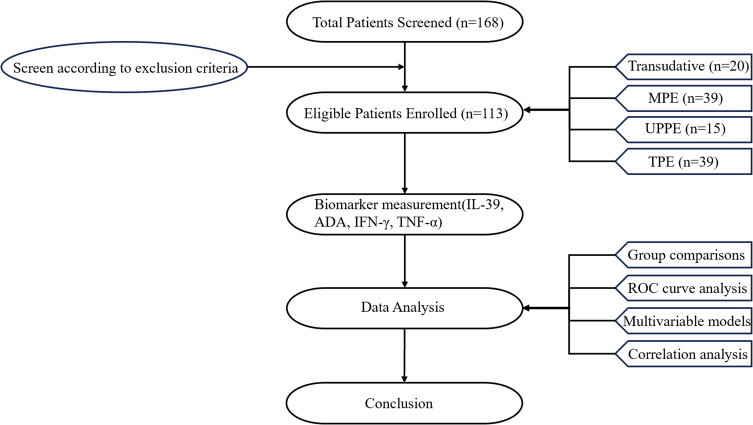
Methods: This study enrolled 113 patients with PE caused by different etiologies: 20 with transudative effusion, 39 with malignant pleural effusion (MPE), 15 with uncomplicated parapneumonic effusion (UPPE), and 39 with tuberculous pleural effusion (TPE). Enzyme-linked immunosorbent assay (ELISA) was used to measure IL-39, interferon-gamma (IFN-γ), and tumor necrosis factor-alpha (TNF-α) levels in the pleural fluid (PF) of each group. Adenosine deaminase (ADA) activity was determined using the colorimetric method.
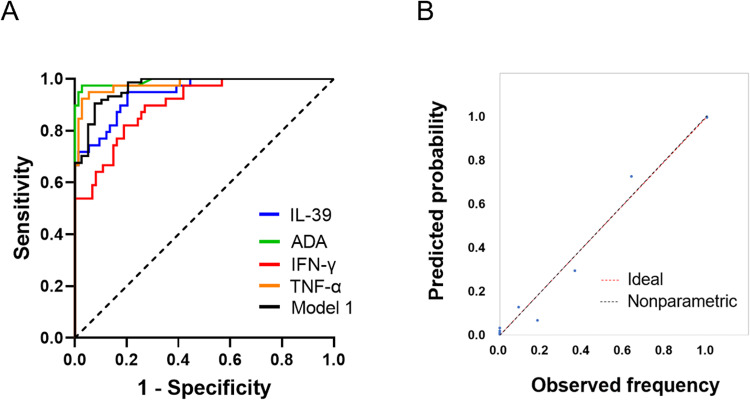
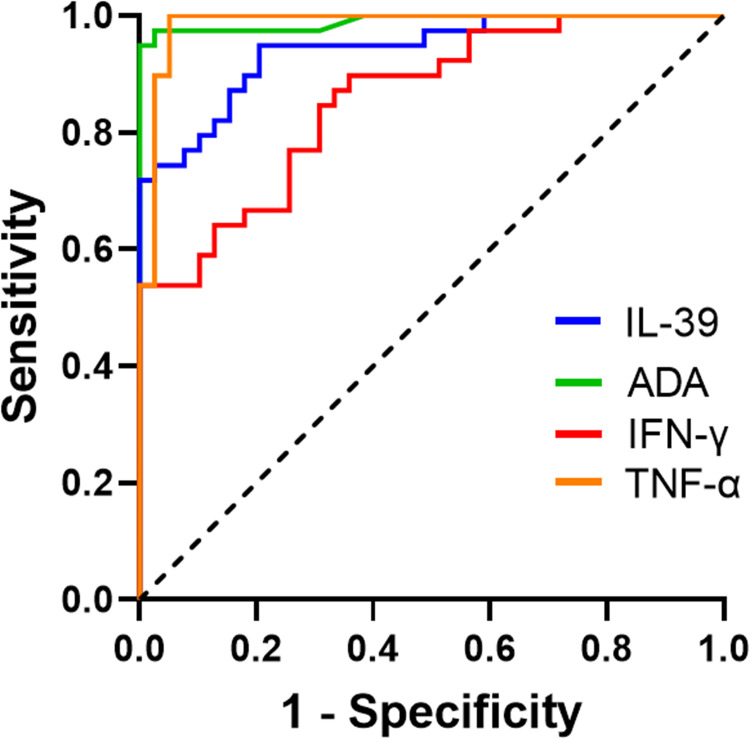
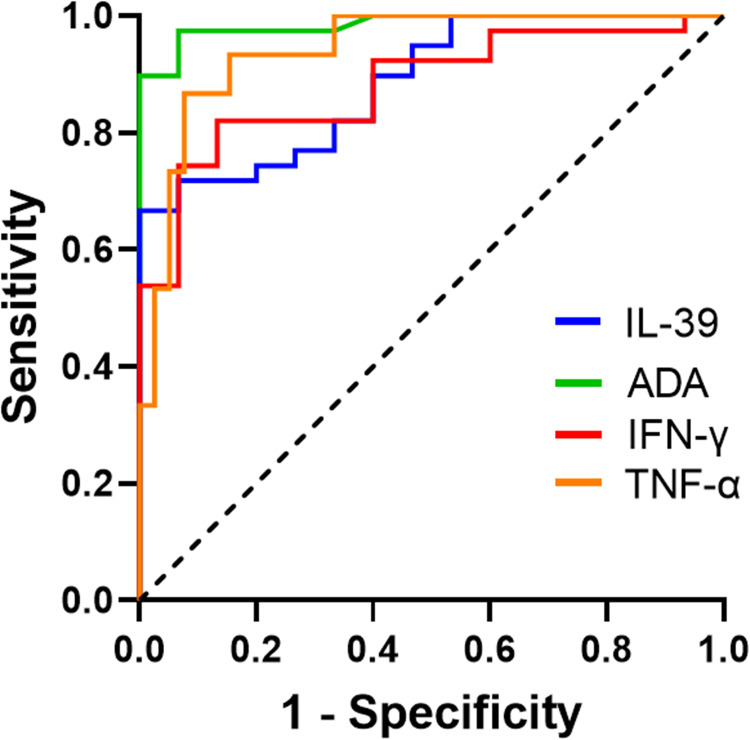
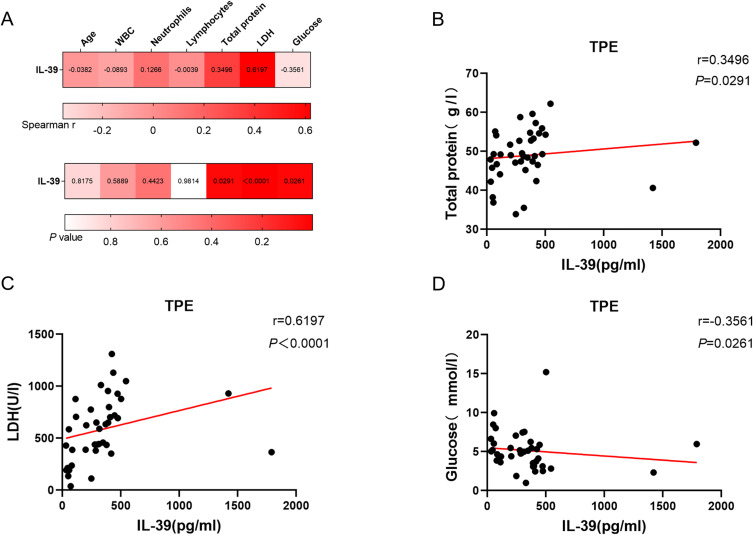
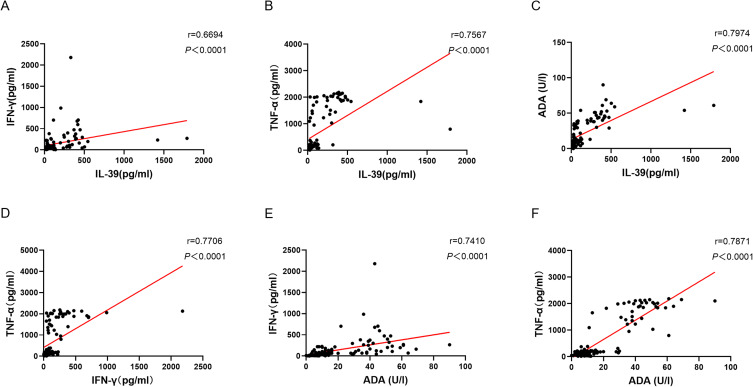
Results: IL-39 concentration was notably higher in the TPE compared to others. The IL-39 demonstrated an AUC of 0.944, with a cut-off value of 39.8 pg/mL, sensitivity of 94.9%, and specificity of 79.7% in distinguishing between the TPE and non-TPE. In discriminating between the TPE and MPE, the AUC for IL-39 was 0.941, with a cut-off value of 39.3 pg/mL, sensitivity of 94.9%, and specificity of 79.5%. For differentiating the TPE and UPPE, IL-39 yielded an AUC of 0.885, with a cut-off value of 235.0 pg/mL, sensitivity of 66.7%, and specificity of 100.0%. Moreover, based on these findings, multivariable diagnostic model and the rapid combination of IL-39 with other tuberculosis biomarkers (such as IFN-γ, TNF-α, and ADA) significantly enhanced the diagnostic and differential diagnostic performance for TPE. Additionally, IL-39, IFN-γ, TNF-α, and ADA levels in PF were positively correlated with each other.
Conclusion: IL-39 demonstrated good diagnostic and differential diagnostic value for TPE. Furthermore, the multivariate diagnostic model, as well as the joint detection of IL-39 with other tuberculosis biomarkers, can further increased the sensitivity or specificity. Additionally, IL-39 exhibited positive correlations with other tuberculosis biomarkers, suggesting its potential involvement in tuberculosis infection and the inflammatory response it may induce.
Keywords: Interleukin-39; diagnosis; pleural effusion; tuberculous pleurisy.
© 2025 Song et al.
Conflict of interest statement
The authors report no conflicts of interest in this work.
Figures
Similar articles
-
Combined detections of interleukin 27, interferon-γ, and adenosine deaminase in pleural effusion for diagnosis of tuberculous pleurisy.Chin Med J (Engl). 2013;126(17):3215-21. Chin Med J (Engl). 2013. PMID: 24033939
-
The diagnostic value of interleukin-36 cytokines in pleural effusions of varying etiologies.Clin Chim Acta. 2023 Sep 1;549:117533. doi: 10.1016/j.cca.2023.117533. Epub 2023 Sep 1. Clin Chim Acta. 2023. PMID: 37660939
-
Potential diagnostic value of pleural fluid cytokines levels for tuberculous pleural effusion.Sci Rep. 2021 Jan 12;11(1):660. doi: 10.1038/s41598-020-79685-1. Sci Rep. 2021. PMID: 33436672 Free PMC article.
-
Diagnostic Accuracy of Interleukin-27 between Tuberculous Pleural Effusion and Malignant Pleural Effusion: A Meta-Analysis.Respiration. 2018;95(6):469-477. doi: 10.1159/000486963. Epub 2018 Mar 14. Respiration. 2018. PMID: 29539604 Review.
-
Use of pleural fluid levels of adenosine deaminase and interferon gamma in the diagnosis of tuberculous pleuritis.Curr Opin Pulm Med. 2010 Jul;16(4):367-75. doi: 10.1097/MCP.0b013e32833a7154. Curr Opin Pulm Med. 2010. PMID: 20473171 Review.
References
-
- Wei H, Yuhong L. Interpretation of WHO global tuberculosis report 2023. J Tuberculosis Lung Dis. 2024;5(1):15–19. doi:10.19983/j.issn.2096-8493.2024006 - DOI
LinkOut - more resources
Full Text Sources
Research Materials
