

Antimicrobial resistance in Escherichia coli and Staphylococcus aureus at human-animal interfaces on Chongming Island, Shanghai: A One Health perspective
- PMID: 40206836
- PMCID: PMC11980626
- DOI: 10.1016/j.onehlt.2024.100910
Antimicrobial resistance in Escherichia coli and Staphylococcus aureus at human-animal interfaces on Chongming Island, Shanghai: A One Health perspective
Abstract
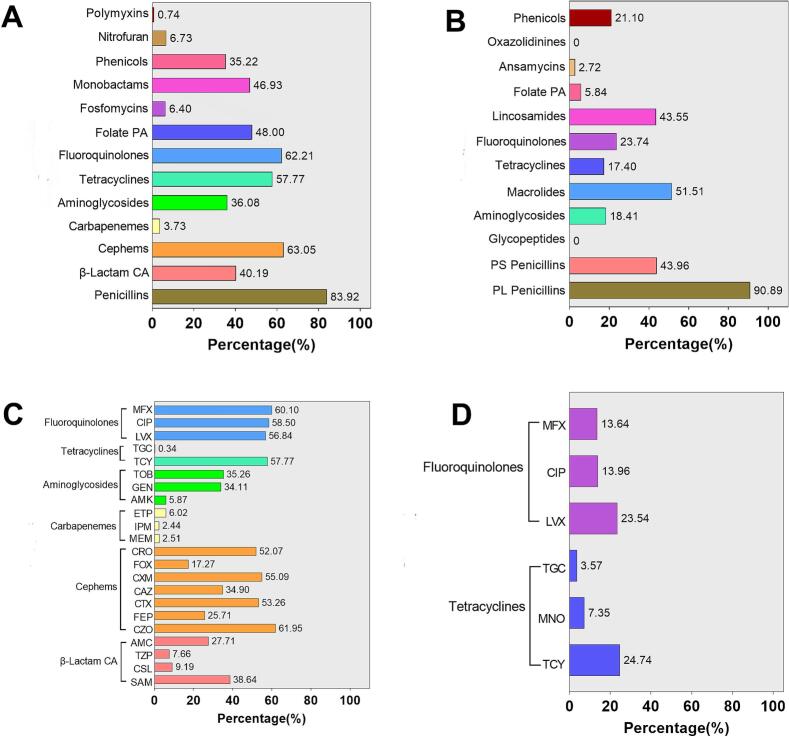
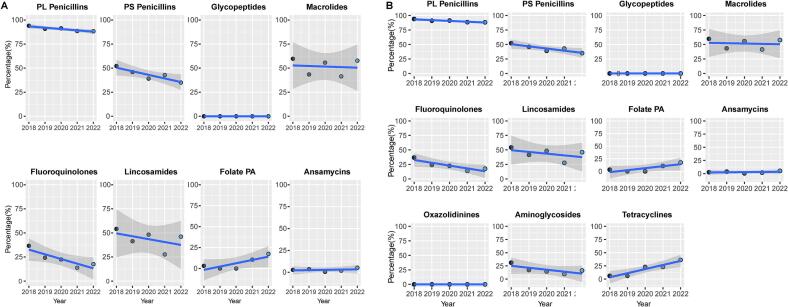
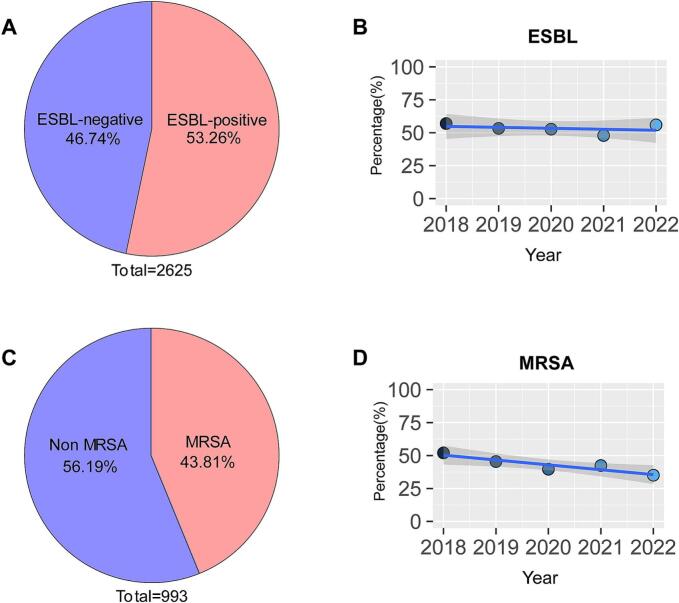
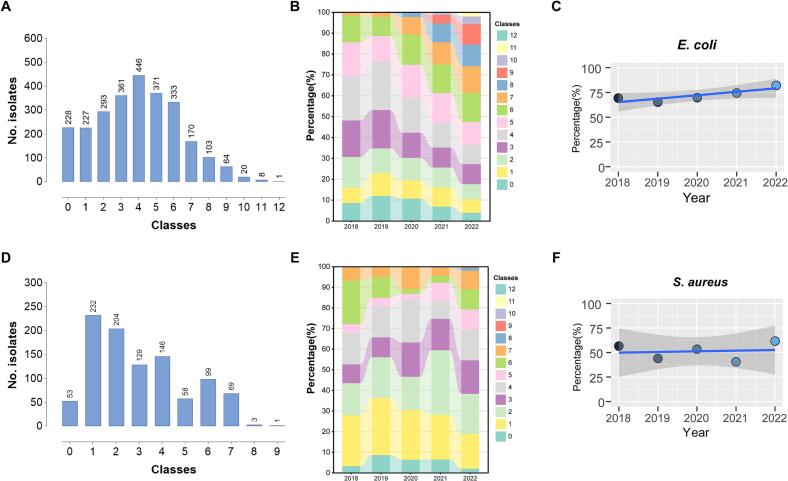
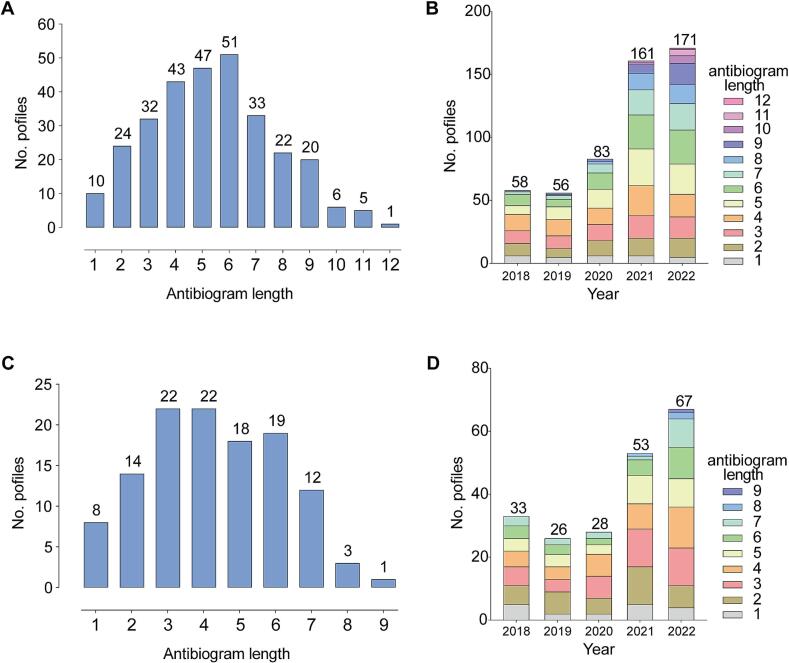
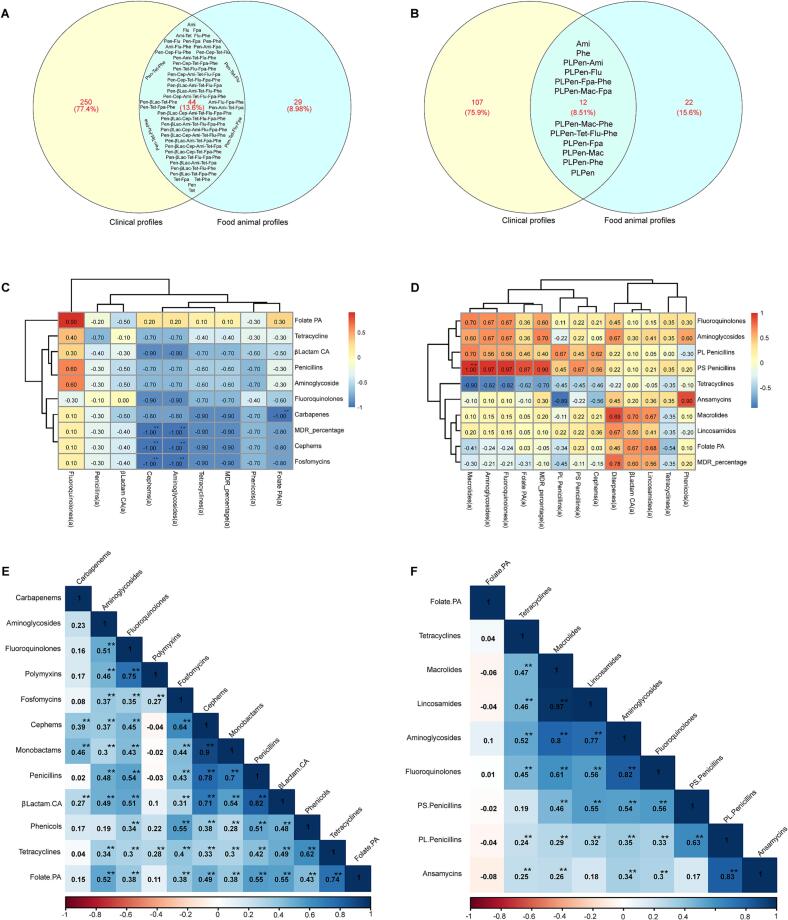
Antimicrobial resistance (AMR) is a significant concern within the One Health framework due to its ability to spread across multiple interfaces. Phenotypic data remains the primary type for AMR surveillance, but exploring association across multiple interfaces poses certain challenges. In this study, AMR phenotypic data of clinical and food animal E. coli and S. aureus from Chongming Island over the past five years were analyzed to determine key characteristics of AMR and explore its association at the human-animal interface. The clinical E. coli isolates showed significant resistance to penicillins (83.92 %), cephems (63.05 %), fluoroquinolones (62.21 %), and tetracyclines (57.77 %), while S. aureus exhibited high resistance to penicillinase-labile penicillins (90.89 %), macrolides (51.51 %), penicillinase-stable penicillins (43.96 %), and lincosamides (43.55 %). Extended-spectrum β-lactamase (ESBL)-producing E. coli isolates accounted for 53.26 % (1398/2526), while methicillin-resistant Staphylococcus aureus (MRSA) prevalence was 43.81 % (435/993). Notably, there has been an increase in the proportion of E. coli isolates resistant to 8 to 12 antimicrobial classes, and in the proportion of S. aureus isolates resistant to 5 to 9 classes. Certain multi-drug resistance (MDR) phenotypes were first identified in food animal isolates and later emerged in clinical settings. Meanwhile, several MDR phenotypes were shared between the two interfaces, with 44 identified in E. coli and 12 in S. aureus. Further co-occurrence analysis in E. coli and S. aureus identified several co-occurrence phenotypic pairs or clusters, potentially mediated by a single plasmid or multiple plasmids within a bacterium, indicating potential associations at the human-animal interface. To summarize, a heightened prevalence of MDR in clinical E. coli and S. aureus has been observed, with some MDR profiles appearing in food animals before emerging in clinical settings. The co-occurrence of phenotypic pairs or clusters underscores the potential for AMR association and transmission between humans and food animals. Within the One Health framework, integrating genomic data into AMR monitoring is a crucial next step.
Keywords: Clinical isolates; Escherichia coli; Food animals; Multidrug resistance; Staphylococcus aureus.
© 2024 The Authors.
Conflict of interest statement
The authors of the present study declare no competing interests.
Figures
Similar articles
-
Dynamic antimicrobial resistant patterns of Escherichia coli from healthy poultry and swine over 10 years in Chongming Island, Shanghai.Infect Dis Poverty. 2022 Sep 16;11(1):98. doi: 10.1186/s40249-022-01025-4. Infect Dis Poverty. 2022. PMID: 36114584 Free PMC article.
-
Phenotypic and Genotypic Characterization of Extended Spectrum Beta-Lactamase-Producing Clinical Isolates of Escherichia coli and Klebsiella pneumoniae in Two Kenyan Facilities: A National Referral and a Level Five Hospital.Int J Microbiol. 2024 Feb 14;2024:7463899. doi: 10.1155/2024/7463899. eCollection 2024. Int J Microbiol. 2024. PMID: 38384586 Free PMC article.
-
Wildlife as Sentinels of Antimicrobial Resistance in Germany?Front Vet Sci. 2021 Jan 27;7:627821. doi: 10.3389/fvets.2020.627821. eCollection 2020. Front Vet Sci. 2021. PMID: 33585611 Free PMC article.
-
Sulopenem: An Intravenous and Oral Penem for the Treatment of Urinary Tract Infections Due to Multidrug-Resistant Bacteria.Drugs. 2022 Apr;82(5):533-557. doi: 10.1007/s40265-022-01688-1. Epub 2022 Mar 16. Drugs. 2022. PMID: 35294769 Review.
-
Genetic diversity and risk factors for the transmission of antimicrobial resistance across human, animals and environmental compartments in East Africa: a review.Antimicrob Resist Infect Control. 2020 Aug 6;9(1):127. doi: 10.1186/s13756-020-00786-7. Antimicrob Resist Infect Control. 2020. PMID: 32762743 Free PMC article. Review.
Cited by
-
Comprehensive regional study of ESBL Escherichia coli: genomic insights into antimicrobial resistance and inter-source dissemination of ESBL genes.Front Microbiol. 2025 Jun 10;16:1595652. doi: 10.3389/fmicb.2025.1595652. eCollection 2025. Front Microbiol. 2025. PMID: 40556893 Free PMC article.
References
-
- WHO Antimicrobial Resistance. 2023. https://www.who.int/news-room/fact-sheets/detail/antimicrobial-resistance
LinkOut - more resources
Full Text Sources
Molecular Biology Databases
Miscellaneous
