. 2025 Mar 26:16:1473473.
doi: 10.3389/fpls.2025.1473473. eCollection 2025.

Salt stress alters the selectivity of mature pecan for the rhizosphere community and its associated functional traits

Affiliations

Salt stress alters the selectivity of mature pecan for the rhizosphere community and its associated functional traits

Mengting Shi et al. Front Plant Sci. .

Abstract

Introduction: Salt stress is a major global environmental factor limiting plant growth. Rhizosphere bacteria, recruited from bulk soil, play a pivotal role in enhancing salt stress resistance in herbaceous and crop species. However, whether the rhizosphere bacterial community of a mature tree can respond to salt stress, particularly in saline-alkalitolerant trees, remains unexplored. Pecan (Carya illinoinensis), an important commercially cultivated nut tree, is considered saline-alkali tolerant.

Methods: Pecan trees (12 years) were subjected to different NaCl concentrations for 12 weeks. Collected samples included bulk soil, rhizosphere soil, roots, leaves, and fruit. Amplicon sequencing data and shotgun metagenomic sequencing data obtained from the samples were investigated: 1) microbial communities in various ecological niches of mature pecan trees; 2) the characteristic of the rhizosphere bacteria community and the associated functional traits when pecan suffered from salt stress.

Results and discussion: We characterized the mature pecan-associated microbiome (i.e., fruit, leaf, root, and rhizosphere soil) for the first time. These findings suggest that niche-based processes, such as habitat selection, drive bacterial and fungal community assembly in pecan tissues. Salt stress reduced bacterial diversity, altered community composition, and shifted pecan's selective pressure on Proteobacteria and Actinobacteria. Shotgun metagenomic sequencing further revealed functional traits of the rhizosphere microbiome in response to salt stress. This study enhances our understanding of mature tree-associated microbiomes and supports the theory that shaping the rhizosphere microbiome may be a strategy for saline-alkali-tolerant mature trees to resist salt stress. These findings provide insights into salt tolerance in mature trees and suggest potential applications, such as the development of bio-inoculants, for managing saline environments in agricultural and ecological contexts.

Keywords: mature pecan; microbiome; rhizosphere; salt stress; selectivity.


Conflict of interest statement

The authors declare that the research was conducted in the absence of any commercial or financial relationships that could be construed as a potential conflict of interest.

Figures

Figure 1
Figure 1
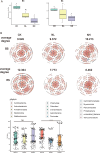
Composition and diversity of microbiota in different ecological niches of mature pecan. (A) Alpha diversity (index: Richness, Shannon, Simpson) across broad habitats (habitats: the location where microorganisms are found in plants: rhizosphere soil, root, leaf, and fruit) for both bacterial and fungal communities. Box plots show the high, low, and median values, with the lower and upper edges of each box representing the first and third quartiles, respectively. The x-axis represents the sample information. Statistical significance between different groups is indicated by different letters (p < 0.05, ANOVA). (B) Beta diversity across broad habitats (rhizosphere soil, root, leaf, and fruit) for both bacterial and fungal communities. Beta diversity is visualized using principal component analysis (PCA) based on the unweighted UniFrac distance at the operational taxonomic unit (OTU) level. The variation explained by the plotted principal coordinates is indicated in the axis labels. p-values from Adonis tests, adjusted by the FDR, are displayed at the top of each PCA plot. (C, D) Structure of bacterial and fungi communities across broad habitats (rhizosphere soil, root, leaf, and fruit). The relative abundances of bacterial (C) and fungi (D) communities are shown at the phylum level. RS, rhizosphere soil; RT, root; L, leaf; F, fruit.
Figure 2
Figure 2
Effects of salt stress on the α-diversity and network complexity of rhizosphere bacteria in pecan. (A) Alpha diversity of bulk soil (left) and rhizosphere soil (right) under nonsalt-, low-salt-, and high-salt-treated conditions for bacterial communities, based on amplicon sequencing data. Box plots show the high, low, and median values, with the lower and upper edges of each box representing the first and third quartiles, respectively. BS, bulk soil; RS, rhizosphere soil; CK, control check (nonsalt condition); NL, low concentration (0.3%) NaCl; NH, High concentration (0.6%) NaCl; BSCK, bulk soil under nonsalt condition; BSNL, bulk soil under low-salt condition; BSNH, bulk soil under high-salt condition; RSCK, rhizosphere soil under nonsalt condition; RSNL, rhizosphere soil under low-salt condition; RSNH, rhizosphere soil under high-salt condition. (B) Network co-occurrence analysis of bacterial communities in bulk soil and rhizosphere soil samples under nonsalt-, low-salt-, and high-salt-treated conditions. (Spearman |ρ| > 0.7 and p < 0.05). Each node represents the taxonomic level of the genus (based on 16S rRNA), with red lines indicating positive correlations and blue lines indicating negative correlations. Line width represents the strength of the correlation, while node colors denote different phyla. Box plots show the node size of each genus in the samples. **** p < 0.0001. ns, non significant.
Figure 3
Figure 3
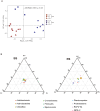
Salt stress alters the community composition of pecan rhizosphere bacteria. (A) Beta diversity is visualized using principal coordinates analysis (PCoA) based on Bray–Curtis distance at the operational taxonomic unit (OTU) level. (B) Ternary plots illustrating bacterial community composition in bulk soil (left) and rhizosphere soil (right).
Figure 4
Figure 4
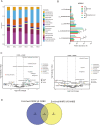
Salt stress altered the selectivity of pecan toward Proteobacteria and Actinobacteria. (A) Structure of the bacterial community in bulk soil and rhizosphere soil samples under nonsalt-, low-salt-, and high-salt-treated conditions. BSCK, bulk soil under nonsalt condition; BSNL, bulk soil under low-salt condition; BSNH, bulk soil under high-salt condition; RSCK, rhizosphere soil under nonsalt condition; RSNL, rhizosphere soil under low-salt condition; RSNH, rhizosphere soil under high-salt condition. (B) Average relative abundance of the five most abundant genera in samples based on 16S data. (C) Volcano plots showing enrichment and depletion analyses for CKRS versus CKBS and NHRS versus NHBS comparisons. CKBS, bulk soil under nonsalt condition; CKRS, rhizosphere soil under nonsalt condition; NHBS, bulk soil under high-salt condition; NHRS, rhizosphere soil under high-salt condition. The shape of each dot represents the enrichment and depleted taxonomic affiliation of the OTUs at the genus level, with colors indicating phylum-level annotations. (D) Venn diagram illustrating the unique and shared genera predicted from the enriched genera datasets of CKRS versus CKBS and NHRS versus NHBS comparisons.
Figure 5
Figure 5
Effects of salt stress on rhizosphere microbiome functions. (A) The top 20 KEGG pathways show significant differences in abundance between the nonsalt- and high-salt-treated groups. Each dot is color-coded according to KEGG level 1 annotation. (B) Volcano plots depicting enrichment and depletion analyses between the nonsalt- and high-salt-treated groups. Enriched NOGs are represented by red triangles, depleted NOGs by blue squares, and nonsignificant differences by gray dots. (C) Distribution of different NOGs across functional categories. C, energy production and conversion; G, carbohydrate transport and metabolism; K, transcription; L, replication, recombination, and repair; M, cell wall/membrane/envelope biogenesis; O, Posttranslational modification, protein turnover, chaperones; P, inorganic ion transport and metabolism; S, function unknown; T, signal transduction mechanisms; U, intracellular trafficking, secretion, and vesicular transport.

Similar articles

References

    1. Abdelfadil M. R., Patz S., Kolb S., Ruppel S. (2024). Unveiling the influence of salinity on bacterial microbiome assembly of halophytes and crops. Environ. Microbiome 19, 49. doi: 10.1186/s40793-024-00592-3 - DOI - PMC - PubMed
    1. Agler M. T., Ruhe J., Kroll S., Morhenn C., Kim S. T., Weigel D., et al. . (2016). Microbial hub taxa link host and abiotic factors to plant microbiome variation. PloS Biol. 14, e1002352. doi: 10.1371/journal.pbio.1002352 - DOI - PMC - PubMed
    1. Bais H. P., Weir T. L., Perry L. G., Gilroy S., Vivanco J. M. (2006). The role of root exudates in rhizosphere interactions with plants and other organisms. Annu. Rev. Plant Biol. 57, 233–266. doi: 10.1146/annurev.arplant.57.032905.105159 - DOI - PubMed
    1. Barberan A., Bates S. T., Casamayor E. O., Fierer N. (2012). Using network analysis to explore co-occurrence patterns in soil microbial communities. ISME J. 6, 343–351. doi: 10.1038/ismej.2011.119 - DOI - PMC - PubMed
    1. Beckers B., Op De Beeck M., Weyens N., Boerjan W., Vangronsveld J. (2017). Structural variability and niche differentiation in the rhizosphere and endosphere bacterial microbiome of field-grown poplar trees. Microbiome 5, 25. doi: 10.1186/s40168-017-0241-2 - DOI - PMC - PubMed

LinkOut - more resources