. 2025 Apr 5:20:4145-4163.
doi: 10.2147/IJN.S503181. eCollection 2025.

Electromechanical Regulation Underlying Protein Nanoparticle-Induced Osmotic Pressure in Neurotoxic Edema

Affiliations

Electromechanical Regulation Underlying Protein Nanoparticle-Induced Osmotic Pressure in Neurotoxic Edema

Zihui Zheng et al. Int J Nanomedicine. .

Abstract

Purpose: Osmotic imbalance is a critical driving force of cerebral edema. Protein nanoparticles (PNs) amplify intracellular osmotic effects by regulating membrane potential and homeostasis of water and multiple ions. This study has investigated how PNs control the neuronal swelling through electromechanical activity.

Methods: The fluorescence resonance energy transfer (FRET)-based Vimentin force probe was used to real-time monitor the osmotic tension in neurons. Patch clamp and the living cell 3D imaging system were applied to explore the relationship between cell electromechanical activity and cell volume in different cytotoxic cell models. Cytoplasmic PN amount measured by the NanoSight instrument, ion contents detected by the freezing point osmometer and ion imaging were performed to investigate the role of PNs in regulating cell swelling.

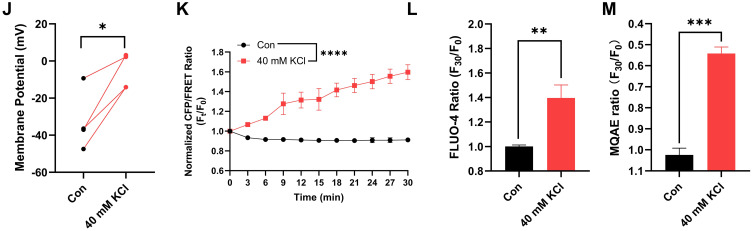
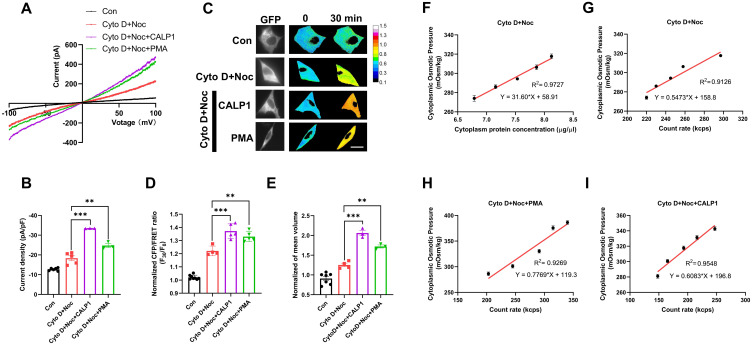
Results: We observed a close association between neuronal swelling and changes in osmotic tension and membrane potential. The tension effect of biological osmotic pressure (OP) relies on electromechanical cooperation induced by intracellular PN and Ca2+ levels. PNs increment results from cytoplasmic translocation of intracellular various proteins. Alterations in Ca2+ content are involved in the membrane potential transition between depolarization and hyperpolarization in a PN-dependent manner. Chemical signals-mediated sensitization of ion channels has an indispensable effect on PN-induced ion increments. Notably, aquaporin-mediated water influx recovers membrane potential and enhances osmotic tension controlling neuronal swelling.

Conclusion: Our findings indicate that PNs, Ca2+, and water are pivotal in electromechanical cooperation and provide insights into the biological OP mechanisms underlying neurotoxic edema.

Keywords: electromechanical cooperation; membrane potential; neuronal swelling; osmotic tension; protein nanoparticle.


Conflict of interest statement

The authors report no conflicts of interest in this work.

Figures

None
Graphical abstract
Figure 1
Figure 1
Continued.
Figure 1
Figure 1
Changes in membrane potential induce osmotic tension imbalance, closely associated with PNs and Ca2+. (A) After transfection with vimentin–cpstFRET probe, SH-SY5Y cells were treated with Bay K8644 (1 μM), Lu AE98134 (30 μM), lubiprostone (100 μM), Bay K8644 + Sen A (100 μM) + TAX (10 μM), Bay K8644 + 0 mm Ca2+ (no extracellular Ca2+), Bay K8644 + heparin (0.5 mg/mL), and Bay K8644 + 0 mm Ca2+ + heparin. Representative fluorescent images were captured within 30 min. Scale bar, 10 µm. The representative fluorescent calibration bar was set from 0.1 to 1.5. The dark-blue calibration bar indicates the smallest CFP/FRET ratio (0.10), whereas red indicates the largest CFP/FRET ratio (1.5). (B) Normalized CFP/FRET ratio of vimentin IF tension under different treatments. ****p < 0.0001, Bay K8644 was compared with the control. ***p < 0.001, Lu AE98134 or lubiprostone was individually compared with the Bay K8644 group. (C) Normalized CFP/FRET ratio of vimentin IF tension under different treatments. ***p < 0.001, the additional treatment of Sen A+TAX or 0 mm Ca2++heparin was individually compared with the Bay K8644 group. *p < 0.05, the additional treatment of 0 mm Ca2+ was compared with the Bay K8644+heparin group. (D) Number of cytoplasmic PNs under different treatments. (E) Cytoplasmic OP was detected using a freezing point osmometer. (F) Normalized F30/F0 ratio of intracellular Ca2+ and (G) Cl fluorescent intensities. The significant differences were statistically analyzed between the Bay K8644 group compared with the control, the additional treatment of Sen A+TAX or 0 mm Ca2++heparin individually compared with the Bay K8644 group. (H) Neuronal cells were treated with an isotonic solution (300 mOsm/kg) containing 40 mm KCl. Representative trace map of membrane potential was recorded using a whole-cell patch clamp. (I) Representative fluorescence images of vimentin IF tension. The calibration bar was set from 0.1 to 1.5. (J) Membrane potential changes after KCl treatment. Each line represents a single neuronal cell. Paired samples were analyzed by t-test. (K) Normalized CFP/FRET ratio of vimentin IF tension. (L) Normalized F30/F0 ratio of intracellular Ca2+ and (M) Cl fluorescent intensities. Average of ≥3 biologically independent replicates ± SEM. *p < 0.05, **p < 0.01, ***p < 0.001, ****p < 0.0001.
Figure 2
Figure 2
Extracellular hypotonicity induces IF tension and membrane potential changes dependent on PNs and Ca2+. (A) Neuronal cells were treated with hypotonic solution (Hypo, 220 mOsm/kg), Hypo + Sen A (100 μM) + TAX (10 μM), Hypo + 0 mm Ca2+, and Hypo + heparin (0.5 mg/mL). Representative fluorescent images of vimentin IF tension were captured within 30 min. Scale bar, 10 µm. The calibration bar was set from 0.1 to 1.5. (B) Normalized CFP/FRET ratio of vimentin IF tension. (C) Ratio of 27 min and 30 min CFP/FRET was analyzed by paired t-test. (D) Normalized ratio (Ft/F0) of cell volume within 30 min. (E) Number of cytoplasmic PNs. (F) Cytoplasmic OP was detected using a freezing point osmometer. (G) Normalized F30/F0 ratio of intracellular Ca2+ and (H) Cl fluorescent intensities. An increase in intracellular Cl levels led to a decrease in MQAE fluorescence intensity. The significant differences were statistically analyzed between the Hypo group compared with the control, the additional treatment of Sen A+TAX or 0 mm Ca2+ or heparin or 0 mm Ca2++heparin individually compared with the Hypo group (B, DH). (I) Representative trace map and (J) variations in membrane potential measured using a whole-cell patch clamp. Average of ≥3 biologically independent replicates ± SEM. The significant differences were statistically analyzed between the additional treatment of Sen A+TAX or 0 mm Ca2+ or heparin or 0 mm Ca2++heparin individually compared with the Hypo group. ns, no significant, *p < 0.05, **p < 0.01, ***p < 0.001.
Figure 3
Figure 3
Piezo1 is associated with IF tension, membrane potential, and intracellular ion level regulation. Neuronal cells were transfected with siRNA-Control (si-Con) and siRNA-Piezo1 (si-Piezo1) under extracellular hypotonic conditions (220 mOsm/kg). (A) Representative fluorescent images (scale bar, 10 µm). The calibration bar was set from 0.1 to 1.5. (B) Normalized CFP/FRET ratio of vimentin IF tension. ***p < 0.001, the si-Con+Hypo group was compared with the si-Con group. *p < 0.05, the si-Piezo1+Hypo group was compared with the si-Con+Hypo group. (C and D) Representative trace map of membrane potential was recorded within 30 min using a whole-cell patch clamp. (E) Statistics of resting membrane potential before treatment. (F) Variations in membrane potential after treatment. (G and H) Normalized F30/F0 ratio of intracellular Ca2+ and Cl fluorescent intensities. The significant differences were statistically analyzed between the si-Con+Hypo group compared with the si-Con group, the si-Piezo1+Hypo group compared with the si-Con+Hypo group. Average of ≥3 biologically independent replicates ± SEM. ns, no significant, *p < 0.05, **p < 0.01, ***p < 0.001.
Figure 4
Figure 4
PNs contribute to intracellular hyperosmosis, membrane potential changes, and extent of opening of voltage-dependent ion channels. Neuronal cells were treated with 10 μM CytoD and 100 μM Noc. (A) Number of cytoplasmic PNs. (B) Cytoplasmic OP. (C and D) Normalized F30/F0 ratio of intracellular Ca2+ and Cl fluorescent intensities. (E) Representative trace map of membrane potential was recorded using a whole-cell patch clamp. (F) Membrane potential changes after CytoD+Noc treatment. Each line represents a single neuronal cell; paired samples were analyzed by t-test. (G) Cells were treated with CytoD+Noc and CytoD+Noc+Gil (20 μM). Under the holding potential of 0 mV, cells were subjected to ramp voltage stimulation from −100 mV to +100 mV for 200 ms, and representative current trace of SUR1-TRPM4 channel was recorded. (H) Average current density of SUR1-TRPM4 channel induced at −80 mV. (I) Cells were treated with CytoD+Noc and CytoD+Noc+Nic (1 μM). Under the holding potential of 0 mV, a step voltage stimulation scheme of +20 mV was applied in the voltage range of −80 mV to +80 mV, and representative current trace of TMEM16A channel was recorded. (J) Average current density of TMEM16A channel was calculated at +80 mV. (K) Cells were treated with CytoD+Noc and CytoD+Noc+Nimo (10 μM). At the holding potential of −90 mV, cells were subjected to step voltage stimulation from −70 mV to +10 mV, and representative current trace of VGCCs was recorded. (L) Average current density of VGCCs. The significant differences were statistically analyzed between the Cyto D+Noc group compared with the control, the additional treatment of Gil or Nic or Nimo individually compared with the Cyto D+Noc group (H, J and L). (M and N) Representative fluorescent images (scale bar, 10 µm; the calibration bar was set from 0.1 to 1.5) and normalized CFP/FRET ratio of vimentin IF tension recorded within 30 min. (O) Normalized ratio (Ft/F0) of cell volume within 30 min. Average of ≥3 biologically independent replicates ± SEM. ns, *p < 0.05, **p < 0.01, ***p < 0.001, ****p < 0.0001.
Figure 5
Figure 5
Sensitization of voltage-dependent ion channels is involved in PN-induced OP. (A) Neuronal cells were treated with CytoD+Noc, CytoD+Noc+CALP1, and CytoD+Noc+PMA. Under the holding potential of 0 mV, cells were subjected to ramp voltage stimulation from −100 mV to +100 mV for 200 ms, and representative current trace of SUR1-TRPM4 channel was recorded. (B) Average current density of SUR1-TRPM4 channel induced at −80 mV. (C and D) Representative fluorescent images and normalized CFP/FRET ratio of vimentin IF tension. Scale bar, 10 µm. The calibration bar was set from 0.1 to 1.5. (E) Normalized ratio (F30/F0) of cell volume. The significant differences were statistically analyzed between the additional treatment of CALP1 or PMA individually compared with the Cyto D+Noc group (B, D and E). (F) Linear relationship between cytoplasmic protein concentration and OP, corresponding to the concentration gradients (CytoD 10 μM + Noc 100 μM, CytoD 20 μM + Noc 200 μM, CytoD 30 μM + Noc 300 μM, and CytoD 40 μM + Noc 400 μM) (G, H and I) Linear relationship between the count rate of cytoplasmic PNs and OP, corresponding to the concentration gradients of CytoD + Noc. Average of ≥3 biologically independent replicates ± SEM. **p < 0.01, ***p < 0.001.
Figure 6
Figure 6
Neurotoxins induce electromechanical imbalance dependent on intracellular PNs. Neuronal cells were treated with CoCl2 (200 μM), LPS (1 μg/mL), and 1,2-DCE (1.2 μg/mL), or combined with Sen A + TAX + Tran (20 μM), 0 mm Ca2+ + heparin, and HgCl2 (200 μM). (A) Normalized CFP/FRET ratio of vimentin IF tension. (B–E) Representative trace map of membrane potential was recorded within 30 min under different treatments. (F) Variations in membrane potential. The significant differences were statistically analyzed between the additional treatment of Sen A+TAX+Tran or 0 mm Ca2++heparin or HgCl2 individually compared with the CoCl2 group, the LPS group or 1,2-DCE group. (G) Number of cytoplasmic PNs. The significant differences were statistically analyzed between the individual CoCl2/LPS/1,2-DCE group compared with the control, the additional treatment of Sen A+TAX+Tran or 0 mm Ca2++heparin or HgCl2 individually compared with the CoCl2 group, the LPS group or 1,2-DCE group (A and G). Average of ≥3 biologically independent replicates ± SEM. ns, no significant, *p < 0.05, **p < 0.01, ***p < 0.001, ****p < 0.0001.
Figure 7
Figure 7
AQP is involved in IF tension and membrane potential regulation. Neuronal cells were co-transfected with green fluorescent protein-tagged vimentin probe and red fluorescent protein-tagged AQP9. (A and B) Representative fluorescent images and normalized CFP/FRET ratio of vimentin IF tension under different treatments. Scale bar, 10 µm. The calibration bar was set from 0.1 to 1.5. The significant differences were statistically analyzed between the AQP9+CoCl2/LPS/1,2-DCE group individually compared with the corresponding CoCl2/LPS/1,2-DCE group; the additional treatment of Sen A+TAX+Tran individually compared with the corresponding AQP9+CoCl2/LPS/1,2-DCE group. (C) Representative trace map of cell membrane potential. (D) Cell membrane potential before treatment, max membrane potential after treatment, and the recovered plateau. Each line represents a single neuronal cell. Average of ≥3 biologically independent replicates ± SEM. *p < 0.05, **p < 0.01, ***p < 0.001.
Figure 8
Figure 8
Proteomic analysis by label-free LC–MS. Identification of different proteins between (1) the control and CytoD+Noc groups and (2) the CytoD–Noc and CytoD–Noc-removal groups. (A and B) Volcano plot of nonredundant proteins. Red dots indicate upregulated proteins, blue dots indicate downregulated proteins, and grey dots indicate proteins with no significant change. (C and D) Classification of identified proteins by subcellular localization. The percentage in parentheses represents the enriched types of proteins. (E and F) GO enrichment analysis categorized by cellular components (CC), biological processes (BP) and molecular functions (MF). Top 20 enriched pathways were ranked by p-value. Pathways with p ≤ 0.05 were considered to be significantly enriched.

Similar articles

References

    1. Schleicher RL, Vorasayan P, Mccabe ME, et al. Analysis of brain edema in RHAPSODY. International Journal of Stroke. 2024;19(1):68–75. doi:10.1177/17474930231187268 - DOI - PMC - PubMed
    1. Halstead MR, Geocadin RG. The Medical Management of Cerebral Edema: past, Present, and Future Therapies. Neurotherapeutics. 2019;16(4):1133–1148. doi:10.1007/s13311-019-00779-4 - DOI - PMC - PubMed
    1. Hladky SB, Barrand MA. Alterations in brain fluid physiology during the early stages of development of ischaemic oedema. Fluids Barriers CNS. 2024;21(1):51. doi:10.1186/s12987-024-00534-8 - DOI - PMC - PubMed
    1. Zheng Z, Qiu Z, Xiong X, et al. Co-activation of NMDAR and mGluRs controls protein nanoparticle-induced osmotic pressure in neurotoxic edema. Biomedicine & Pharmacotherapy. 2023;169:115917. doi:10.1016/j.biopha.2023.115917 - DOI - PubMed
    1. Zheng Z, Wang Y, Li M, et al. Albumins as Extracellular Protein Nanoparticles Collaborate with Plasma Ions to Control Biological Osmotic Pressure. International Journal of Nanomedicine. 2022;17:4743–4756. doi:10.2147/IJN.S383530 - DOI - PMC - PubMed

LinkOut - more resources