. 2025 Dec;14(1):2492210.
doi: 10.1080/22221751.2025.2492210. Epub 2025 May 7.

Eurasian 1C swine influenza A virus exhibits high pandemic risk traits

Affiliations

Eurasian 1C swine influenza A virus exhibits high pandemic risk traits

Valerie Le Sage et al. Emerg Microbes Infect. 2025 Dec.

Abstract

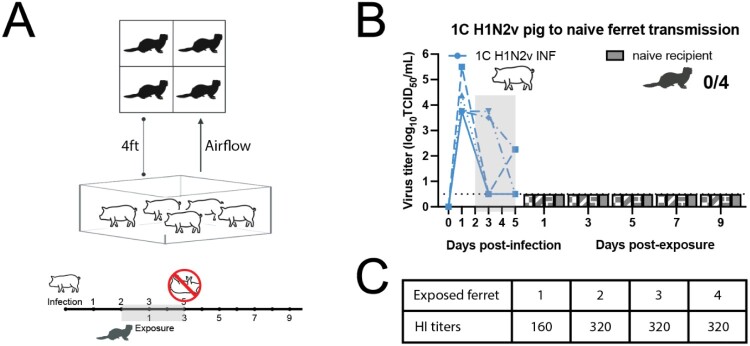
ABSTRACTRecent surveillance has identified an expansion of swine H1 1C influenza viruses in Eurasian swine. Since 2010, at least 21 spillover events of 1C virus into humans have been detected and three of these occurred from July to December of 2023. Pandemic risk assessment of H1 1C influenza virus revealed that individuals born after 1950 had limited cross-reactive antibodies, confirming that they are antigenically novel viruses. The 1C virus exhibited phenotypic signatures similar to the 2009 pandemic H1N1 virus, including human receptor preference, productive replication in human airway cells, and robust environmental stability. Efficient inter- and intraspecies airborne transmission using the swine and ferret models was observed, including efficient airborne transmission to ferrets with pre-existing human seasonal H1N1 immunity. Together our data suggest H1 1C influenza virus poses a relatively high pandemic risk.

Keywords: Influenza virus; pandemic risk assessment; pre-existing immunity; swine; transmission.


Conflict of interest statement

No potential conflict of interest was reported by the author(s).

Figures

Figure 1.
Figure 1.
Pathological examination and virus shedding in pigs infected with 1C H1N2v. Five pigs were intranasally infected with 2 mL of 106 TCID50/mL of 1C H1N2v and necropsied 5 days post-inoculation (dpi). A. Percentage of macroscopic lung lesions was significantly higher in 1C H1N2v-infected pigs at 6.8%. B. Composite of microscopic lung lesion scores on a scale of 0–22. 1C H1N2v-infected pigs had an average score of 13.8 and were characterized by purulent bronchiolitis with the accumulation of pyknotic and karyorrhectic debris admixed with neutrophils in the lumen of two bronchioles. C. Composite of microscopic trachea lesion scores on a scale of 0–8 with a group average composite score of 4.4 for 1C H1N2v-infecteds pigs. D. Virus titres in bronchoalveolar lavage fluid (BALF) at 5 dpi. Viral titres were measured by TCID50 in MDCK cells and recorded as log10 TCID50/mL.
Figure 2.
Figure 2.
Representative microscopic lesions in the lung and trachea of pigs infected with 1C H1N2v at 5 dpi. A. Negative control swine lung (200× hematoxylin and eosin staining (H&E)). B. Infected swine lung with evident purulent bronchiolitis characterized by the accumulation of pyknotic and karyorrhectic debris admixed with neutrophils in the lumen of two bronchioles (white asterisks; 200× H&E). The bronchioles were surrounded and the propria submucosa was expanded by a pluricellular inflammatory infiltrate. In addition, bronchiolitis obliterans was observed in the lungs and characterized by partial obstruction of a bronchiole by intraluminal accumulation of inflammatory cells lined by attenuated epithelium. Accumulation of a pluricellular inflammatory infiltrate was observed in alveolar lumens consisting of lymphocytes, foamy alveolar macrophages and neutrophils. Bronchioles are surrounded and the propria submucosa is expanded by a pluricellular inflammatory infiltrate consisting of lymphocytes (white arrow), macrophages (white notched arrow), neutrophils (white arrowhead), and plasma cells (white chevron). C. Infected swine lung with bronchiolitis obliterans characterized by partial obstruction of a bronchiole by intraluminal accumulation of inflammatory cells (white asterisk) lined by attenuated epithelium (black arrowheads; 400× H&E). D. Infected swine lung with accumulation of a pluricellular inflammatory infiltrate in alveolar lumens consisting of lymphocytes (black arrow), foamy alveolar macrophages (black notched arrow), and neutrophils (black arrowhead). Alveolar lumens also contain alveolar macrophages phagocytizing proteinaceous fluid (black notched arrow). Alveolar septa are expanded by lymphocytes (black arrow) and neutrophils (black arrowhead; 400× H&E). E. Negative control swine lung (200×, immunohistochemistry (IHC)) F. Infected swine lung with IHC staining of IAV NP in the respiratory epithelium (black arrowhead) and alveolar macrophages (black notched arrow; 200× IHC). G. Infected swine lung with staining of IAV nucleoprotein (NP) by IHC, in the respiratory epithelium nuclei, indicating replication (black arrowhead) and in interstitial macrophages (black notched arrow). IAV NP staining lined the cilia of respiratory epithelium (black chevron) and pneumocytes (black arrow; 200× IHC). H. Trachea from infected pig with IHC staining of IAV NP in the tracheal respiratory epithelium with loss of cilia (arrowhead; 400× IHC).
Figure 3.
Figure 3.
Low levels of cross-neutralizing antibodies against 1C H1N2v in the population. A. Sera from the indicated number of individuals collected in Fall 2020 from Pittsburgh, Pennsylvania for each decade of birth were tested for antibodies against H1N1pdm09 (black circles) and 1C H1N2v (blue circles). B. Plasma collected from ten individuals pre-vaccination and 28 days post-vaccination with GSK Fluvalal quadrivalent formulation in 2021/2022 were assessed for cross-neutralizing antibodies. Each dot represents an individual, and the open circles indicate individuals that had a greater than 4-fold rise in antibody titres. The dashed line indicates the limit of detection for each assay.
Figure 4.
Figure 4.
In vitro characterization of 1C H1N2v A. Binding of 1C H1N2v virus to a sialoside microarray. Printed glycans include those with α2-3 sialic acid linkages and α2-6 sialic acid linkages. Bars represent the mean fluorescent intensity for H1N1pdm09 (black bars) or 1C H1N2v (blue bars). Glycan numbers are shown on the x-axis and corresponding structures can be found in Supplemental Table 1. B. Replication of 1C H1N2v in primary HBE cells. Transwells of HBE cultures from three different patient donors were infected in triplicate with 103 TCID50/mL of H1N1pdm09 or 1C H1N2v, and virus was collected at 24- and 48-hours post-infection for titration using MDCK cells. Data represent the mean values +/− standard deviation of three independent patient donors. C. H1N1pdm09 and 1C H1N2v were incubated in pH-adjusted PBS. Remaining virus titre was determined by TCID50 assay. The data were fit with an asymmetric sigmoidal curve to determine the EC50. pH of inactivation for H1N1pdm09 and 1C H1N2v as determined by regression analysis of the dose–response curve. The mean +/− standard deviation corresponds to three independent biological replicates, each performed in triplicate. D. Neuraminidase activity for H1N1pdm09 and 1C H1N2v was determined using an ELLA assay with fetuin as a substrate. The data are displayed as the mean +/− standard deviation of three independent assays performed in duplicate. H1N1pdm09 (E) and 1C H1N2v (F) virus stocks were diluted 1:10 in ASL collected from HBE cell cultures. Ten 1 μL droplets were generated and incubated for 2 h at the indicated relative humidity in a controlled chamber. Infectious titres were determined in unaged (time 0) and aged (time 2 h) G. Virus decay was calculated by comparing the virus titre at time 0 to that remaining after 2 h. Data represent the mean values +/− standard deviation from four independent replicates performed with ASL from four different HBE patient cell cultures.
Figure 5.
Figure 5.
Airborne transmission of 1C H1N2v from pig-to-ferret. A. Schematic of experimental timeline whereby five pigs were intranasally infected with 2 mL of 106 TCID50/mL of 1C H1N2v and nasal swabs collected on days 0, 1, 3 and 5 post-infection. Pigs were necropsied at 5 dpi. At 2 dpi, four feet away from the infected pig pen, four ferrets were placed into open cages with directional air flow from the pigs to ferrets. Nasal washes were collected from the ferrets on days 1, 3, 5, 7 and 9 post-exposure and sera were collected on day 21 post-exposure. B. Viral titres of nasal swabs from each infected pig, as indicated by blue lines and nasal washes from exposed naïve ferrets, grey bars. The number of recipient ferrets with detectable virus in nasal washes out of four is shown. The limit of detection is indicated by the dashed line. Grey box indicates the time during which the ferrets were exposed to the infected pigs. Viral titres were measured by TCID50 in MDCK cells and recorded as log10 TCID50/mL. C. HI titres of ferret sera collected at 21 days post-exposure. All schematics were created in BioRender.
Figure 6.
Figure 6.
Swine 1C H1N2v transmits efficiently via the air after a short exposure. (A) Four donor ferrets were infected intranasally with 500 μl of 106 TCID50/mL of 1C H1N2v (1C H1N2v INF), as in Methods. Schematic indicates that recipient ferrets with no prior immunity (naïve recipients) were placed in the adjacent cages at 24 h post-infection for two continuous days. Nasal washes were collected from all ferrets on the indicated days and titred for virus by TCID50. Each bar indicates an individual ferret. (B) Schematic of procedure, whereby four ferrets were infected with H1N1pdm09 (H1N1pdm09-imm) between 84 and 110 days prior to acting as recipients to 1C H1N2v-infected donors. Four donor ferrets were infected with 1C H1N2v and H1N1pdm09-imm recipients were placed in the adjacent cage 24 h later. For all graphs, the number of recipient ferrets with detectable virus in nasal secretions out of four total is shown; the number of recipient animals that seroconverted at 14- or 21-days post-exposure out of four total is shown in parentheses. Grey shaded box indicates shedding of the donor during the exposure period. The limit of detection is indicated by the dashed line. All schematics were made in BioRender.
Figure 7.
Figure 7.
Pre-existing H1N1pdm09 immunity reduces 1C H1N2v influenza virus clinical signs in recipients. A. The total number of signs for each intranasally 1C H1N2-infected ferret from Figure 6 (N = 8) are indicated on the days post-infection. B. The total number of signs for each airborne 1C H1N2v-infected recipient having either no prior immunity (N = 4) or H1N1pdm09 pre-existing immunity (N = 4) from Figure 6 displayed on each day post-exposure. C. The symptoms for each airborne 1C H1N2v-infected recipient from panel B having either no prior immunity (N = 4) or H1N1pdm09-imm (N = 4) were added together to assign each animal a cumulative score. Each dot represents the cumulative sign score for a single ferret.

References

    1. Anderson TK, Macken CA, Lewis NS, et al. A phylogeny-based global nomenclature system and automated annotation tool for H1 hemagglutinin genes from swine influenza A viruses. mSphere. 2016;1(6):e00275–16. doi: 10.1128/mSphere.00275-16 - DOI - PMC - PubMed
    1. Anderson TK, Chang J, Arendsee ZW, et al. Swine influenza A viruses and the tangled relationship with humans. Cold Spring Harb Perspect Med. 2021;11. doi: 10.1101/cshperspect.a038737 - DOI - PMC - PubMed
    1. Zhao Y, Han L, Chen T, et al. Serological surveillance of the H1N1 and H3N2 swine influenza A virus in Chinese swine between 2016 and 2021. Biomed Res Int. 2022;2022:5833769. doi: 10.1155/2022/5833769 - DOI - PMC - PubMed
    1. Pensaert M, Ottis K, Vandeputte J, et al. Evidence for the natural transmission of influenza A virus from wild ducts to swine and its potential importance for man. Bull World Health Organ. 1981;59:75–78. - PMC - PubMed
    1. Sun H, Xiao Y, Liu J, et al. Prevalent Eurasian avian-like H1N1 swine influenza virus with 2009 pandemic viral genes facilitating human infection. Proc Natl Acad Sci U S A. 2020;117:17204–17210. doi: 10.1073/pnas.1921186117 - DOI - PMC - PubMed

MeSH terms

Substances