Impacts of sequence and structure on pyrrolocytosine fluorescence in RNA
- PMID: 40207631
- PMCID: PMC11983128
- DOI: 10.1093/nar/gkaf262
Impacts of sequence and structure on pyrrolocytosine fluorescence in RNA
Abstract
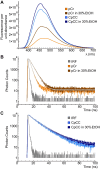
Fluorescence spectroscopy encompasses many useful methods for studying the structures and dynamics of biopolymers. Applications to nucleic acids require the use of extrinsic fluorophores such as fluorescent base analogs (FBAs), which mimic the native bases but have enhanced fluorescence quantum yields. In this work, we use multiple complementary methods to systematically investigate the sequence- and structure-dependence of the fluorescence of the FBA pyrrolocytosine (pC) within RNA. We demonstrate that pC is typically brightest in conformations in which it is base-stacked but not base-paired, properties that distinguish it from more widely used FBAs. This effect is strongly sequence-dependent, with adjacent adenosine and cytidine residues conferring the greatest contrast between stacked and unstacked structures. Structural heterogeneity was resolved in single-stranded RNA and fully complementary and mismatched double-stranded RNA using time-resolved fluorescence measurements and fluorescence-detected circular dichroism spectroscopy. Double-stranded contexts are distinguished from single-stranded contexts by the presence of inter-strand energy transfer from opposing bases, while base-paired pC is distinguished by its short excited state lifetime. This work will enhance the value of pC as a structural probe for biologically and medicinally significant RNAs by guiding the selection of labeling sites and interpretation of the resulting data.
© The Author(s) 2025. Published by Oxford University Press on behalf of Nucleic Acids Research.
Conflict of interest statement
None declared.
Figures


Similar articles
-
Pyrrolo-C as a fluorescent probe for monitoring RNA secondary structure formation.RNA. 2006 Mar;12(3):522-9. doi: 10.1261/rna.2165806. Epub 2006 Jan 23. RNA. 2006. PMID: 16431979 Free PMC article.
-
Base-Stacking Heterogeneity in RNA Resolved by Fluorescence-Detected Circular Dichroism Spectroscopy.J Phys Chem Lett. 2022 Sep 1;13(34):8010-8018. doi: 10.1021/acs.jpclett.2c01778. Epub 2022 Aug 19. J Phys Chem Lett. 2022. PMID: 35984918 Free PMC article.
-
Fluorescent RNA cytosine analogue - an internal probe for detailed structure and dynamics investigations.Sci Rep. 2017 May 24;7(1):2393. doi: 10.1038/s41598-017-02453-1. Sci Rep. 2017. PMID: 28539582 Free PMC article.
-
Design of triplex-forming peptide nucleic acid-based fluorescent probes for forced intercalation sensing of double-stranded RNA structures.Anal Sci. 2025 May;41(5):531-539. doi: 10.1007/s44211-024-00713-5. Epub 2025 Jan 17. Anal Sci. 2025. PMID: 39821230 Review.
-
Characteristic Features of Protein Interaction with Single- and Double-Stranded RNA.Biochemistry (Mosc). 2021 Aug;86(8):1025-1040. doi: 10.1134/S0006297921080125. Biochemistry (Mosc). 2021. PMID: 34488578 Review.
References
MeSH terms
Substances
Grants and funding
LinkOut - more resources
Full Text Sources

