. 2025 Apr 10;53(7):gkaf253.
doi: 10.1093/nar/gkaf253.

High-throughput screen of 100 000 small molecules in C9ORF72 ALS neurons identifies spliceosome modulators that mobilize G4C2 repeat RNA into nuclear export and repeat associated non-canonical translation

Affiliations

High-throughput screen of 100 000 small molecules in C9ORF72 ALS neurons identifies spliceosome modulators that mobilize G4C2 repeat RNA into nuclear export and repeat associated non-canonical translation

Maartje J Luteijn et al. Nucleic Acids Res. .

Abstract

An intronic G4C2 repeat expansion in the C9ORF72 gene is the major known cause for Amyotrophic Lateral Sclerosis (ALS), with current evidence for both, loss of function and pathological gain of function disease mechanisms. We screened 96 200 small molecules in C9ORF72 patient iPS neurons for modulation of nuclear G4C2 RNA foci and identified 82 validated hits, including the Brd4 inhibitor JQ1 as well as novel analogs of Spliceostatin-A, a known modulator of SF3B1, the branch point binding protein of the U2-snRNP. Spliceosome modulation by these SF3B1 targeted compounds recruits SRSF1 to nuclear G4C2 RNA, mobilizing it from RNA foci into nucleocytoplasmic export. This leads to increased repeat-associated non-canonical (RAN) translation and ultimately, enhanced cell toxicity. Our data (i) provide a new pharmacological entry point with novel as well as known, publicly available tool compounds for dissection of C9ORF72 pathobiology in C9ORF72 ALS models, (ii) allowing to differentially modulate RNA foci versus RAN translation, and (iii) suggest that therapeutic RNA foci elimination strategies warrant caution due to a potential storage function, counteracting translation into toxic dipeptide repeat polyproteins. Instead, our data support modulation of nuclear export via SRSF1 or SR protein kinases as possible targets for future pharmacological drug discovery.


Conflict of interest statement

The following authors are or were employees of the Novartis Institutes of Biomedical Research at the time this work was performed: Maartje Luteijn, Dominic Trojer, Hicham Mahboubi, Nicolas Pizzato, Martin Pfeifer, Hans Voshol, Elisa Giorgetti, Carole Manneville, Isabelle P.M. Garnier, Matthias Müller, Fanning Zeng, Kathrin Buntin, Roger Markwalder, Harald Schröder, Jan Weiler, Dora Khar, Tim Schuhmann, Paul J. Groot-Kormelink, Caroline Gubser Keller, Pierre Farmer, Angela MacKay, Martin Beibel, Guglielmo Roma, Giovanni D’Ario, Claudia Merkl, Michael Schebesta, Marc Hild, Fiona Elwood, Mark Labow, Daniela Gabriel, Mark Nash1, Jürg Hunziker and Nicole C. Meisner-Kober.

Figures

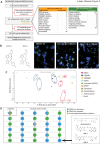
Graphical Abstract
Graphical Abstract
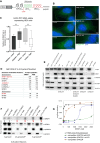
Figure 1.
Figure 1.
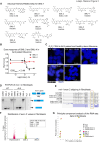
High-throughput screen of 96 000 small molecules for RNA foci clearance in C9orf72 iNeurons. (A) Construct used for stable integration of inducible Ngn2 expression in HD and ALS iPS cells, adapted from Zhang et al. (2013) [72]. 5′PB and 3′PB: flanking arms for PiggyBac transposase genome integration. Ngn2: open reading frame of human Neurogenin2. Dox: Doxycyclin. NeoR: Neomycin resistance gene. The reverse tetracycline-controlled transactivator (rTA) is encoded on the same construct (rTA16: rTetR fused to VP16) and expressed from the CAG (CMV early enhancer/chicken β actin) promoter. (B) Dox induced expression of stably integrated, transgenic Ngn2 in C9orf72 ALS iPS cells results in neuronal morphology and electrical activity after 8 days and repetitive action potential firing after 28 days. Representative data for one ALS line are shown, data for HD line are shown in Supplementary Fig. S1A. (C) G4C2-RNA foci are retained in C9orf72 ALS patient iNeurons as detected by FISH. Nucleus stain: DAPI. Left panels, ALS patient cells. Right panels, healthy donor lines (Supplementary Table S1) (D) Quantification of RNA foci in 1536-well format. Single cell histograms of RNA foci per cell are shown for healthy donor (hDF90) and ALS (ALS80/5a) iNeurons. Each bar represents pooled data for nine wells on the same plate. (E) Screening paradigm. iPS cells were expanded and Ngn2 expression was induced for 3 days with Dox prior to cryopreservation. For the HTS, iNeurons were plated into 1536-well plates for additional 5 days and incubated with compounds for 48 h. RNA foci were visualized by FISH and quantified by automated imaging. (F) Primary screening data. Each dot represents data for one compound at 8 μM and shows % change in RNA foci and cell number as compared to DMSO controls. SML (splice modulator like) compounds are highlighted within the primary screening data.
Figure 2.
Figure 2.
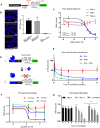
Validation and stratification of primary hits reveals pharmacological RNA foci modulation by epigenetic modulators and novel Spliceostatin A analogs. (A) Screening flowchart (left panel) with classification of the 261 validated hits based on known targets and historical data (right panel). (B) JQ1(+) results in massive upregulation of both RNA foci as well as C9orf72 mRNA within 6 h, whereas the Brd4 inactive enantiomer JQ1(-) was inactive also in RNA foci clearance, for quantification see Supplementary Fig. S2C–E. (C) IC50 and % change of RNA foci for small molecules targeting epigenetic regulatory proteins, as annotated for each of these compounds based on in house data from independent, previous screening and drug discovery campaigns. Among the validated RNA foci increasing hits, the screen led to de novo identification of the Brd4 inhibitor JQ1, which already had been previously reported to regulate the C9orf72 locus [73]. (D) Clustering of the 261 validated hits by chemical similarity. Each circle represents one scaffold. The number of analogs belonging to the same chemical cluster is shown within the center of each circle, numbers on top indicate arbitrary cluster identities. The cluster number 39, comprising two analogs of the spliceosome modulator Spliceostatin A, SML-1 and SML-2, is highlighted and the structures of the compounds are shown.
Figure 3.
Figure 3.
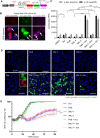
SML compounds phenocopy Pladienolide B in alternative splicing and eliminate RNA foci via SF3B1 modulation. (A) SAR (structure activity relationship) for compounds similar to Spliceostatin A (SSA) with IC50 values of RNA foci clearance in C9orf72 fibroblasts (dose response curves in Supplementary Fig. S3c). (B) Dose response of SML-3 and SML-4 in RNA foci clearance after 8 h of treatment of ALS iNeurons. Each data point represents an average of three wells, error bars are SDs. (C) G4C2 FISH (white) of ALS patient iNeurons treated with 50nM of SML-1 or 100 nM of SML-3. ALS iNeurons treated with RNAse and Healthy donor iNeurons are shown as controls for the FISH. Nuclei stain: DAPI. (D) RT-PCR of mcl-1 on cDNA of fibroblasts treated for 4 h with 25 nM of SML-3, SML-4 and PlaB or equivalent DMSO concentrations, showing alternative splicing of mcl-1 exon 2. (E-G RNASeq of ALS and healthy donor (HD) fibroblasts with and without treatment with PlaB or DMSO for 4 h. (E) alignment of reads to the mcl-1 gene, showing exon2 skipping and intron retention upon PlaB treatment, confirming the RT-PCR data in (D). (F) Transcriptome wide distribution of alternatively spliced RNA transcripts in PlaB or SML-3 treated fibroblasts as determined by RNASeq. F-value represents the difference in reads along the transcripts for each exon compared to DMSO treated samples. The higher the F-value, the stronger this difference, most likely attributed to alternative splicing. Libraries were generated from triplicates per compound condition. ALS patient samples (ALS G9 fibroblasts) and Healthy Donors (Hdf 90/1a) were used for the limma/voom analysis. (G) Principal component analysis of alternatively spliced transcripts, grouping affected intronic sequences by compound and cell line. Every intron was treated as “gene”, resulting in 43 572 “genes” after filtering (counts per million (CPM) ≥ 5). The first component separates active from inactive compounds, the second component separates hdf63 from other donors (neonatal versus adult). In both components, SML-3 and PlaB affected introns grouped closely together while SML-4 clustered with DMSO. Additional data of the RNASeq study are shown in Supplementary Fig. S3.
Figure 4.
Figure 4.
Pharmacological as well as gene expression modulation of SF3B1 alters G4C2 RNA foci levels. (A-C) RNA foci clearance by orthogonal chemotypes targeting SF3B1. (A) Confocal images of RNA foci in ALS fibroblasts treated with DMSO or 50 nM of Pladienolide B (PlaB). Note that fibroblasts contain less foci per cell than iNeurons. Herboxidiene (B) and PlaB (C) were added in different concentrations for 8 h to ALS iNeurons. Each condition is an average of three wells, error bars are SD. (D) Quantification of RNA foci in ALS patient iPS derived motor neurons after treatment with PlaB (Between 3 and 4 fields of view were analyzed (each dot represent a field of view). Number of neurons counted for each condition: DMSO: 349 neurons, PlaB (25 nM, 5 h): 102, PlaB (25 nM, 24 h): 156, Statistical analysis: One-Way ANOVA with Dunnet's multiple comparisons test, error bars: SD). (E) Left: Western blot of SF3B1 in ALS patient fibroblasts treated twice over a total of 4 days with siRNA targeting sf3b1 or scrambled siRNAs. Loading control: b-actin. Middle panel: Representative images of G4C2 RNA foci (green dots) in siRNA treated ALS fibroblasts, showing increased number of RNA-foci in SF3B1 knockdown cells. Right panel: average number of RNA-foci per cell upon SF3B1 knockdown (n = 3 wells, 2500 cells per well, error bars: SD, significance: two-tailed One-Way Anova, **** indicates P< 0.0001). (F) Detection of RNA foci and SF3B1 in ALS patient iNeurons by confocal microscopy. Nuclei stain: DAPI. Right panel: 3D reconstruction (Imaris). RNA foci accumulate in the periphery of SF3B1 speckles.
Figure 5.
Figure 5.
G4C2-RNA foci are eliminated posttranscriptionally. (A) A construct carrying 152x G4C2 repeats under expression of the ef1a promoter and a stop codon upstream of the repeats. The construct was randomly integrated in HD iNeurons with PiggyBac transposase to generate stable 152x G4C2 iNeuron reporter lines. (B) Confocal images confirm the presence of G4C2-RNA foci in the nucleus (DAPI) of reporter lines (left panel). The reporter line, ALS patient iNeurons (ALS G9) and the healthy donor parent line were analyzed side by side for comparison. A quantification is shown in the right panel. (C) RNA foci in 152x G4C2 reporter iNeurons, treated with PlaB, SML-3, and SML-4 at different concentrations for 8 h. Each bar represents an average of three wells (∼5000 cells per well) and error bars are SDs. (D) A schematic overview of the TetOFF construct with 152x G4C2 repeats as used in Fig. 5E. Upon Doxycycline addition, transcription is turned off. (E) RNA foci in HeLa cells transfected with 152x G4C2 repeats under a TetOFF promoter, were treated for 0.5–6 h with 50 nM PlaB and/or Dox (n = 3 wells, 15 000 cells/well, error bars represent SDs). Grey dot represents t = 0 (before Dox addition). (F) RNA foci clearance by SML-3 as a function of time and dose after treatment with SML-3 (FTD patient fibroblasts treated with SML-3 for 0.5, 2, 4, and 8 h, n = 3 wells, 300 cells/well, error bars are SDs). Data for SML-4 are shown in Supplementary Fig. S5i. (G) RNA foci in FTD patient fibroblasts treated with SML-3 (500 nM), SML-4 (500 nM) or the RNA polymerase II/III inhibitor α -amanitin (20 ug/ml) for different time points. RNA foci clearance induced by SML-3 is faster than by blocking transcription by α -amanitin. The difference between the 8 h time-points for SML-3 and α-amanitin is statistically significant (P> 0.05 t-test, n = 3 wells 300 cells/well, error bars are SDs).
Figure 6.
Figure 6.
SML compounds increase DPR levels and enhance DPR toxicity, measured by cell proliferation. (A) Schematic representation of the Dox-inducible RAN reporter construct used for stable insertion into HEK293 cells, including an upstream Stop codon, no ATG and fusing three reporter tags in different frames downstream of the repeat. Depending on the reading frame, polyGA DPRs carrying a Myc-tag, polyGP DPRs carrying an HA-tag, or polyGR DPRs carrying a FLAG-tag are expressed upon Dox induction of reporter transcription. (B) Widefield fluorescent microscopy images showing expression of the different DPRs (Myc-tag: polyGA; HA-tag: polyGP; Flag-tag: polyGR) in RAN reporter lines upon Dox induction, showing high expression of polyGA and polyGP DPRs, and very low expression of polyGR. Zoomed-in confocal figures (lower panel) show subcellular localization of DPR inclusions in the HEK293 152xG4C2 reporter lines, with mostly nuclear localization with some cytoplasmic aggregates for polyGA and polyGP. PolyGR showed mostly cytoplasmic localization (C) Quantification of the images represented in Fig. 5E. Each datapoint is an average of 6 wells, with approx. 5′000 cells per well. Statistical differences are shown (t test; ****P < 0.0001**P= 0.002). (D) Confocal images of polyGA and polyGP in HEK293 RAN reporter cells treated with 100 nM of SML-3 and PlaB for 24h, showing an increased production of DPRs induced by SML-3 and PlaB compared to Dox only or Dox + SML-4. Zoomed-in frame (Dox panel) of PlaB + Dox treated HEK293 RAN reporter cells suggests nucleolar polyGA inclusions, consistent with previous reports [104]. (E) Cell proliferation measured by continuous bright field imaging (Incucyte) for RAN reporter cells with and without Dox-induced RAN expression and 100 nM SML-3, SML-4 or PlaB treatment for up to 100 h (n = 8 wells and error bars are SD). SML-3 and PlaB treatment significantly enhanced the inhibitory DPR effect on cell proliferation, showing that increased levels of DPRs are inducing reduced cell proliferation (t test, P< 0.0001).
Figure 7.
Figure 7.
Spliceosome modulating compounds induce G4C2 repeat RNA export. (A) Schematic representation of a reporter construct used for generating stable HEK293 reporter cells with PP7 and MS2 stem loops downstream of 152xG4C2 repeats that allow visualization of single RNA molecules by FISH. The G4C2 reporter RNA was under control of a TREG3 promoter to allow Tetracyclin induced inhibition of transcription, thereby preventing transcript accumulation at transcriptional start sites. (B) Confocal images of single molecule FISH against PP7 stem-loop RNA (green) in HEK293 G4C2 single molecule FISH reporter cells. Nuclei stain: DAPI. A redistribution of G4C2-PP7 RNA molecules in cells treated with PlaB to the cytoplasm can be observed. (C) Quantification of single molecule FISH against PP7 stem-loop RNA in HEK293 G4C2 single molecule FISH reporter cells upon compound treatment. Cells were treated for 1.5 h with 50 nM Pladienolide B and 45 min of Dox. Controls: Dox only. A significant difference between the cytoplasmic and nuclear fractions of G4C2 RNA molecules in control and PlaB treated cells was observed (Welch's t test, P = 0.0028). (D) MassSpec analysis of proteins co-immunoprecipitated with biotinylated (G4C2)4-RNA in nuclear lysates from PlaB or DMSO pretreated HeLa cells. Selection of top hits and spliceosomal proteins are shown (full data set in Supplementary Data S4). (E) Western blot for SF3B1, SRSF1, export factor ALY/REF, hnRNPH (positive control), and laminin (loading control) after co-immunoprecipitation with different biotinylated RNA oligonucleotides in nuclear HeLa extracts. (G4C2)4 RNA oligos were pre-folded in different structures prior to the IP. KCl or LiCl were used to facilitate or disrupt G-quadruplex formation, respectively. Hybridization to the complementary strand was used to fold the (G4C2)4 oligos into dsRNA. Confirmation of RNA secondary structures by CD spectroscopy is shown in Supplementary Fig. S7c. Biotinylated (A4U2)4 or (C4G2)4 RNA oligos were used for comparison. The blot shows one representative data set out of 15 independent experiments. (F) Western blot for SRSF1, SF3B1, hnRNPH (positive control) and laminin (loading control) after co-immunoprecipitations with biotinylated (G4C2)4 RNA using nuclear extracts of HeLa cells pre-treated for 4 h with PlaB (50nM) or DMSO prior to lysis. An increased binding of SRSF1 to the G4C2 RNA oligo in lysates from PlaB pretreated cells was observed. (G) Binding of recombinant SRSF1 to 5′TMR labeled RNA (canonical motif: AAAUCAGAGGAAAA, 0.5 nM) measured by fluorescence correlation spectroscopy (2D-FIDA). RNA-protein complex formation is monitored based on an increase of the fluorescence anisotropy upon protein binding to the TMR labelled RNA. Binding of SRSF1 to its canonical motif in presence of unlabelled (G4C2)4 RNA (5 uM) prefolded in absence or presence of 200 μM KCl was fitted to a model of 1:1 competition. Competition with (A4U2)4 RNA is shown as control for unspecific RNA binding.
Figure 8.
Figure 8.
Model for compound screen design and turnover of nuclear RNA foci in response to SF3B1 modulating compounds explained in the discussion. Created with BioRender.com.

References

    1. Westeneng HJ, Debray TPA, Visser AE et al. . Prognosis for patients with amyotrophic lateral sclerosis: development and validation of a personalised prediction model. Lancet Neurol. 2018; 17:423–33.10.1016/S1474-4422(18)30089-9. - DOI - PubMed
    1. Wales S, Kiernan DSc AM C, Cheah MBiostat BC et al. . Seminar amyotrophic lateral sclerosis. Lancet. 2011; 377:423–33.
    1. DeJesus-Hernandez M, Mackenzie IR, Boeve BF et al. . Expanded GGGGCC hexanucleotide repeat in noncoding region of C9ORF72 causes chromosome 9p-linked FTD and ALS. Neuron. 2011; 72(2):245–56.10.1016/j.neuron.2011.09.011. - DOI - PMC - PubMed
    1. Renton AE, Majounie E, Waite A et al. . A hexanucleotide repeat expansion in C9ORF72 is the cause of chromosome 9p21-linked ALS-FTD. Neuron. 2011; 72:257–68.10.1016/j.neuron.2011.09.010. - DOI - PMC - PubMed
    1. Majounie E, Renton AE, Mok K et al. . Frequency of the C9orf72 hexanucleotide repeat expansion in patients with amyotrophic lateral sclerosis and frontotemporal dementia: a cross-sectional study. Lancet Neurol. 2012; 11:323–30.10.1016/S1474-4422(12)70043-1. - DOI - PMC - PubMed

MeSH terms