

The Effect of Humalite on Improving Soil Nitrogen Availability and Plant Nutrient Uptake for Higher Yield and Oil Content in Canola
- PMID: 40207787
- PMCID: PMC11984079
- DOI: 10.1111/ppl.70201
The Effect of Humalite on Improving Soil Nitrogen Availability and Plant Nutrient Uptake for Higher Yield and Oil Content in Canola
Abstract
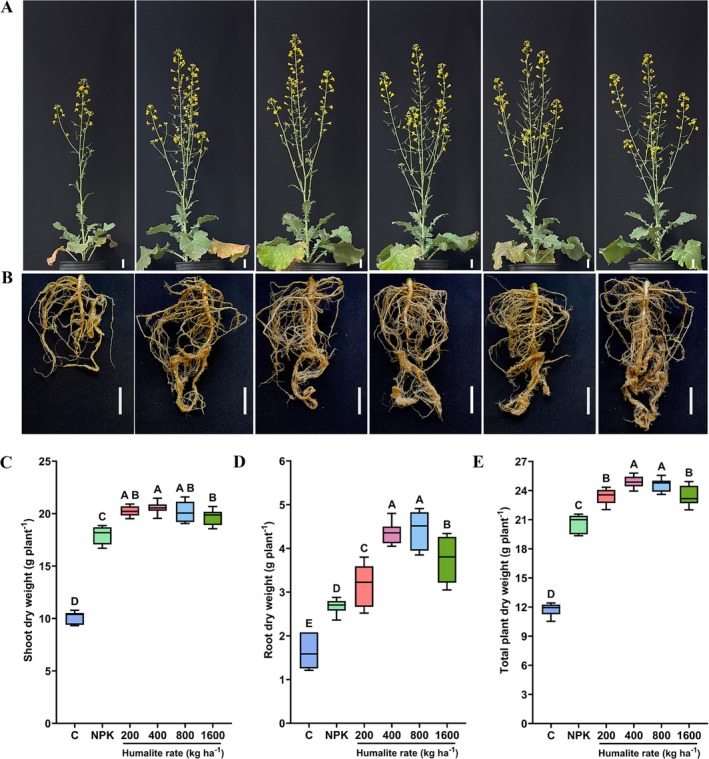
Over the last half-century, the widespread use of synthetic chemical fertilizers has boosted crop yields but caused noticeable environmental damage. In recent years, the application of humic substances to increase plant growth and crop yield has gained considerable interest, largely due to their organic origin and their ability to reduce nutrient losses while enhancing plant nutrient use efficiency. Humalite, found exclusively in large deposits in southern Alberta, Canada, is rich in humic substances and has low levels of unwanted ash and heavy metals, which makes it particularly valuable for agricultural applications. However, its effects on canola, the largest oilseed crop in Canada and the second-largest in the world, have yet to be evaluated. This study investigated the effects of five Humalite rates (0, 200, 400, 800, and 1600 kg ha-1) in combination with nitrogen, phosphorus, and potassium (NPK) applied at recommended levels, on canola growth, soil nitrogen availability, plant nutrient uptake, photosynthesis, seed yield, seed oil content, and nitrogen use efficiency under controlled environmental conditions. The results demonstrated that Humalite application significantly enhanced soil nitrogen availability, uptake of macro- and micronutrients (N, P, K, S, Mg, Mn, B, Fe and Zn), shoot and root biomass, net photosynthesis, and water use efficiency as compared to the NPK alone treatment. The application of Humalite also led to increased seed yield, seed oil content, and nitrogen use efficiency. Taken together, Humalite could serve as an effective organic soil amendment to enhance canola growth and yield while enhancing fertilizer use efficiency.
© 2025 The Author(s). Physiologia Plantarum published by John Wiley & Sons Ltd on behalf of Scandinavian Plant Physiology Society.
Figures


Similar articles
-
Synergistic effects of PGPRs and fertilizer amendments on improving the yield and productivity of Canola (Brassica napus L.).BMC Plant Biol. 2025 Jan 14;25(1):50. doi: 10.1186/s12870-025-06062-3. BMC Plant Biol. 2025. PMID: 39806305 Free PMC article.
-
Quantitative Proteomic Analysis of Brassica Napus Reveals Intersections Between Nutrient Deficiency Responses.Plant Cell Environ. 2025 Feb;48(2):1409-1428. doi: 10.1111/pce.15216. Epub 2024 Oct 24. Plant Cell Environ. 2025. PMID: 39449274 Free PMC article.
-
Efficiency of nitrogen, gibberellic acid and potassium on canola production under sub-tropical regions of Pakistan.Sci Rep. 2023 Oct 31;13(1):18677. doi: 10.1038/s41598-023-38997-8. Sci Rep. 2023. PMID: 37907585 Free PMC article.
-
Role of nanofertilization in plant nutrition under abiotic stress conditions.Chemosphere. 2024 Oct;366:143496. doi: 10.1016/j.chemosphere.2024.143496. Epub 2024 Oct 5. Chemosphere. 2024. PMID: 39374674 Review.
-
A review-chitosan nanoparticles towards enhancing nutrient use efficiency in crops.Int J Biol Macromol. 2025 May;306(Pt 2):141433. doi: 10.1016/j.ijbiomac.2025.141433. Epub 2025 Feb 24. Int J Biol Macromol. 2025. PMID: 40010475 Review.
Cited by
-
Defining the Molecular Impacts of Humalite Application on Field-Grown Wheat (Triticum aestivum L.) Using Quantitative Proteomics.Proteomics. 2025 Jul;25(14):e13981. doi: 10.1002/pmic.13981. Epub 2025 Jun 23. Proteomics. 2025. PMID: 40545991 Free PMC article.
References
-
- Agegnehu G, Nelson PN, Bird MI (2016) The effects of biochar, compost and their mixture and nitrogen fertilizer on yield and nitrogen use efficiency of barley grown on a Nitisol in the highlands of Ethiopia. Science of The Total Environment 569‐570: 869‐879 - PubMed
-
- Alvarez R, Evans LA, Milham PJ, Wilson MA (2004) Effects of humic material on the precipitation of calcium phosphate. Geoderma 118(3): 245‐260
-
- Ampong K, Thilakaranthna MS, Gorim LY (2022) Understanding the role of humic acids on crop performance and soil health. Frontiers in Agronomy 4:848621
-
- Andersson S, Nilsson SI, Saetre P (2000) Leaching of dissolved organic carbon (DOC) and dissolved organic nitrogen (DON) in mor humus as affected by temperature and pH. Soil Biology and Biochemistry 32(1): 1‐10
-
- Andrés Z, Pérez‐Hormaeche J, Leidi EO, Schlücking K, Steinhorst L, McLachlan DH, Schumacher K, Hetherington AM, Kudla J, Cubero B, Pardo JM (2014) Control of vacuolar dynamics and regulation of stomatal aperture by tonoplast potassium uptake. Proceedings of the National Academy of Sciences 111(17): E1806‐E1814 - PMC - PubMed
MeSH terms
Substances
Grants and funding
LinkOut - more resources
Full Text Sources
Research Materials
Miscellaneous
