. 2025 May 14;16(5):e0313624.
doi: 10.1128/mbio.03136-24. Epub 2025 Apr 10.

Pseudomonas aeruginosa population dynamics in a vancomycin-induced murine model of gastrointestinal carriage

Affiliations

Pseudomonas aeruginosa population dynamics in a vancomycin-induced murine model of gastrointestinal carriage

Marine Lebrun-Corbin et al. mBio. .

Abstract

Pseudomonas aeruginosa is a common nosocomial pathogen and a major cause of morbidity and mortality in hospitalized patients. Multiple reports highlight that P. aeruginosa gastrointestinal colonization may precede systemic infections by this pathogen. Gaining a deeper insight into the dynamics of P. aeruginosa gastrointestinal carriage is an essential step in managing gastrointestinal colonization and could contribute to preventing bacterial transmission and progression to systemic infection. Here, we present a clinically relevant mouse model relying on parenteral vancomycin pretreatment and a single orogastric gavage of a controlled dose of P. aeruginosa. Robust carriage was observed with multiple clinical isolates, and carriage persisted for up to 60 days. Histological and microbiological examination of mice indicated that this model indeed represented carriage and not infection. We then used a barcoded P. aeruginosa library along with the sequence tag-based analysis of microbial populations (STAMPR) analytic pipeline to quantify bacterial population dynamics and bottlenecks during the establishment of the gastrointestinal carriage. Analysis indicated that most of the P. aeruginosa population was rapidly eliminated in the stomach, but the few bacteria that moved to the small intestine and the cecum expanded rapidly. Hence, the stomach constitutes a significant barrier against gastrointestinal carriage of P. aeruginosa, which may have clinical implications for hospitalized patients.

Importance: While Pseudomonas aeruginosa is rarely part of the normal human microbiome, carriage of the bacterium is quite frequent in hospitalized patients and residents of long-term care facilities. P. aeruginosa carriage is a precursor to infection. Options for treating infections caused by difficult-to-treat P. aeruginosa strains are dwindling, underscoring the urgency to better understand and impede pre-infection stages, such as colonization. Here, we use vancomycin-treated mice to model antibiotic-treated patients who become colonized with P. aeruginosa in their gastrointestinal tracts. We identify the stomach as a major barrier to the establishment of gastrointestinal carriage. These findings suggest that efforts to prevent gastrointestinal colonization should focus not only on judicious use of antibiotics but also on investigation into how the stomach eliminates orally ingested P. aeruginosa.

Keywords: Pseudomonas aeruginosa; STAMP; intestinal colonization; mouse; vancomycin.


Conflict of interest statement

The authors declare no conflict of interest.

Figures

Fig 1
Fig 1
Murine model of P. aeruginosa GI carriage. (A) Male (square) or female (circle) mice received either PBS (gray symbols) or vancomycin (colored symbols) injections, and an orogastric gavage with 105.6 CFU of PABL048. Fecal burdens of PABL048 were then measured. The experiment was performed twice for vancomycin-treated mice (combined results are shown; n ≥ 8), and once for PBS-treated mice (n = 5). Each symbol represents one mouse. Solid horizontal lines indicate medians. No significant differences in fecal CFU were found at any time point between male and female mice receiving the same treatment (i.e., vancomycin or PBS) (Mann-Whitney tests with Bonferroni-Dunn correction). For both male and female mice, fecal bacterial carriage was significantly higher in the vancomycin-treated group compared to the PBS group across all time points (P ≤ 0.05). (B) Timeline schematic of the model. Mice were intraperitoneally injected daily with vancomycin for 7 days at a dose of 370 mg/kg. On the fifth day of vancomycin treatment (day 0), mice received a defined dose of P. aeruginosa through orogastric gavage. On selected days, feces were collected to assess the extent of GI carriage, estimated by CFU counts. (C) Fecal burden of six clinical isolates of P. aeruginosa during GI carriage. Vancomycin and bacterial delivery (inoculum sizes: 105.4±0.2 CFU PABL004, 105.6±0.3 CFU PABL006, 106±0.2 CFU PABL012, 105.4±0.1 CFU PABL048, 106±0.1 CFU PABL049, or 106±0.1 CFU PABL054) were performed as in (B). Box plots are shown with boxes extending from the 25th to 75th percentiles, whiskers representing minimum and maximum values and lines indicating medians. Experiments were performed at least twice, and combined results are shown (n ≥ 10). Unless indicated, no significant differences were observed between groups. *Adjusted P ≤ 0.05, **adjusted P ≤ 0.01 (Mann-Whitney tests with Bonferroni-Dunn correction for multiple comparisons). The dotted line indicates the limit of detection.
Fig 2
Fig 2
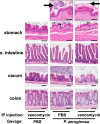
Tissue histology of the GI tracts of mice with carriage of P. aeruginosa. Hematoxylin-eosin staining of organ tissues collected at day 3 post-inoculation with either 107.1 CFU of PABL048 or PBS (mock). Prior to the orogastric gavage, mice received either vancomycin or PBS via intraperitoneal injections. Images in the bottom four rows were captured at a 400× magnification (bar = 100µm). Images on the top row were captured at a 1,000× magnification (bar = 200 µm) (n = 3–4 mice/group). Arrows indicate intraluminal clumps of bacterial bacilli.
Fig 3
Fig 3
Dissemination of P. aeruginosa from the GI tract. P. aeruginosa burden in organs of mice carrying PABL048. Mice were sacrificed at (A) day 3 (n = 10), (B) day 7 (n = 10), or (C) day 14 (n = 9) post-orogastric gavage with 107.4±0.2 CFU of PABL048, and bacterial CFU in the organs were enumerated by plating. The experiment was performed twice; combined results are shown. Each symbol represents one mouse. Solid horizontal lines indicate medians. The vertical dashed lines separate GI tract organs (left) from other organs (right). Symbols representing mice with dissemination from the GI tract are colored (one color/mouse). The horizontal dotted line indicates the limit of detection.
Fig 4
Fig 4
Long-term carriage of P. aeruginosa in the GI tract. PABL048 fecal burdens after orogastric gavage with 105.7±0.3 CFU in male (purple squares) and female (red circles) mice. The experiment was performed twice; combined results are shown (n = 10). Each symbol represents one mouse. Solid horizontal lines indicate medians. No significant differences were observed between male and female mice at any time point (Mann-Whitney tests with Bonferroni-Dunn correction). The dotted line indicates the limit of detection.
Fig 5
Fig 5
Founding populations and bacterial loads of P. aeruginosa in the GI tract. A total of 106.1 CFU of PABL012pool were delivered to single-caged mice by orogastric gavage. P. aeruginosa CFU in 250 µL of resuspensions of collected homogenized tissues (one-fourth of tissue homogenates of stomach, small intestine [“s. intestine”], cecum, colon, and feces) were enumerated by plating, and founding population sizes (Ns) were estimated using the STAMPR approach. (A–C) Bacterial loads (CFU, black circles) and estimated founding population sizes (Ns, pink circles) were quantified at (A) 24 (n = 5), (B) 48 (n = 4), and (C) 72 hpi (n = 3, except for Ns in stomach, which was n = 2 due to a sequencing issue). Each circle represents an organ from one mouse. Solid horizontal lines indicate medians. Minor ticks on the right Y-axis represent the limits of detection for the CFU. Triangles represent samples with no recovered CFU. (D) P. aeruginosa burdens and (E) estimated founding population sizes in different tissues of the GI tract at 24 (purple), 48 (blue), and 72 (green) hpi. For comparison, fecal samples were collected at 24 hpi (“feces 24 hpi”) regardless of the ending timepoint. An additional terminal fecal sample was available for animals harvested at 48 or 72 hpi (“feces late”). Squares represent medians, and error bars represent 95% confidence intervals. The dotted line indicates the limit of detection for CFU. Neither CFU counts nor Ns values are significantly different over time (paired t-test).
Fig 6
Fig 6
Average intra-mouse genetic relatedness of P. aeruginosa populations in the GI tract. (A–C) Heatmaps representing the average intra-mouse GDs of P. aeruginosa from organs of the mice described in Fig. 5, at (A) 24, (B) 48, and (C) 72 hpi. Lower values of GD (purple) indicate a higher frequency of barcode sharing between the samples, with 0 reflecting identical populations. (D) GD values over time between stomach and small intestine (“SI”) (green), small intestine and cecum (teal), and cecum and colon (purple). Each symbol represents one mouse. Lines indicate medians. P-values were calculated using two-tailed paired t-tests: ns, non-significant; *P ≤ 0.05; **P ≤ 0.01. (E–G) Heatmaps representing the average intra-mouse fractional resilient genetic distances (FRD) of P. aeruginosa from organs of the mice described in Fig. 5, at (E) 24, (F) 48, and (G) 72 hpi. The FRD is calculated using the following formula: FRDAB= ln(RDAB+1)ln(number of barcodes in B+1), where RDA–B is the number of shared barcodes that contribute to genetic similarity between samples A and B. The column names in the FRD heatmaps correspond to the organ of reference (B in the above formula). High FRD values (yellow) indicate that most bacterial barcodes are shared between samples. Thick lines in panels B–C and F–G separate the samples collected at the time of dissection (top/left) from samples of feces collected from the same animals at an earlier time point (“feces 24 h”) (bottom/right). Samples outlined by blue and orange squares in panels A and E indicate pairs that are detailed in panel H. (H) FRD values for bacteria from the stomach/small intestine (SI) (blue) and small intestine/cecum (orange) pairs at 24 hpi. Each symbol represents one mouse. Lines indicate medians. P-values are indicated (two-tailed paired t-test). The Venn diagrams under the graph are visual representations of the averaged proportion of barcodes shared between two adjacent organs (circles). Diagrams were created using Biorender.com. As observed in Fig. 5, no bacteria could be detected in the stomach of some mice, leading to variation in the number of samples used for this analysis. (A, E, and H) n = 5 (except for the stomach; n = 4); (B and F) n = 4 (except for the stomach; n = 3); (C and G) n = 3 (except for the stomach; n = 1); (D) see panels A–C.
Fig 7
Fig 7
Model of the population dynamics of P. aeruginosa following orogastric gavage. (Left) Soon after the orogastric delivery of P. aeruginosa, most bacteria are eliminated from the stomach, severely constricting the size of the remaining population (less than 0.01% survival). Part of the population passes through the stomach to reach other compartments of the GI tract: small intestine, cecum, colon, and feces. P. aeruginosa does not encounter additional barriers downstream of the stomach. (Right) Over the first 24 hours, population expansion and/or reflux from the small intestine occurs in the stomach. The small intestine and the cecum support massive expansion of the remaining P. aeruginosa clones, and bacteria freely migrate from the cecum to the colon and feces. This figure was created using Biorender.com.

Update of

Similar articles

References

    1. Ikuta KS, Swetschinski LR, Robles Aguilar G, Sharara F, Mestrovic T, Gray AP, Davis Weaver N, Wool EE, Han C, Gershberg Hayoon A, et al. . 2022. Global mortality associated with 33 bacterial pathogens in 2019: a systematic analysis for the global burden of disease study 2019. Lancet 400:2221–2248. doi:10.1016/S0140-6736(22)02185-7 - DOI - PMC - PubMed
    1. Centers for the Disease Control and Prevention . 2023. Pseudomonas aeruginosa infection. HAI | CDC. Available from: https://www.cdc.gov/hai/organisms/pseudomonas.html. Retrieved 8 March 2024.
    1. Magill SS, Edwards JR, Bamberg W, Beldavs ZG, Dumyati G, Kainer MA, Lynfield R, Maloney M, McAllister-Hollod L, Nadle J, et al. . 2014. Emerging infections program healthcare-associated infections and antimicrobial use prevalence survey team. N Engl J Med 370:1198–1208. doi:10.1056/NEJMoa1306801 - DOI - PMC - PubMed
    1. Boucher HW, Talbot GH, Bradley JS, Edwards JE, Gilbert D, Rice LB, Scheld M, Spellberg B, Bartlett J. 2009. Bad bugs, no drugs: no ESKAPE! An update from the infectious diseases society of America. Clin Infect Dis 48:1–12. doi:10.1086/595011 - DOI - PubMed
    1. Centers for Disease Control and Prevention (U.S.) . 2019. Antibiotic resistance threats in the United States, 2019. Centers for Disease Control and Prevention (U.S.)

MeSH terms

LinkOut - more resources