. 2025 May 27;10(5):e0006125.
doi: 10.1128/msphere.00061-25. Epub 2025 Apr 10.

Effect of urolithin A on intracellular survival of Mycobacterium tuberculosis by regulating AKT-FOXO1-mediated autophagy

Affiliations

Effect of urolithin A on intracellular survival of Mycobacterium tuberculosis by regulating AKT-FOXO1-mediated autophagy

Jing Bi et al. mSphere. .

Abstract

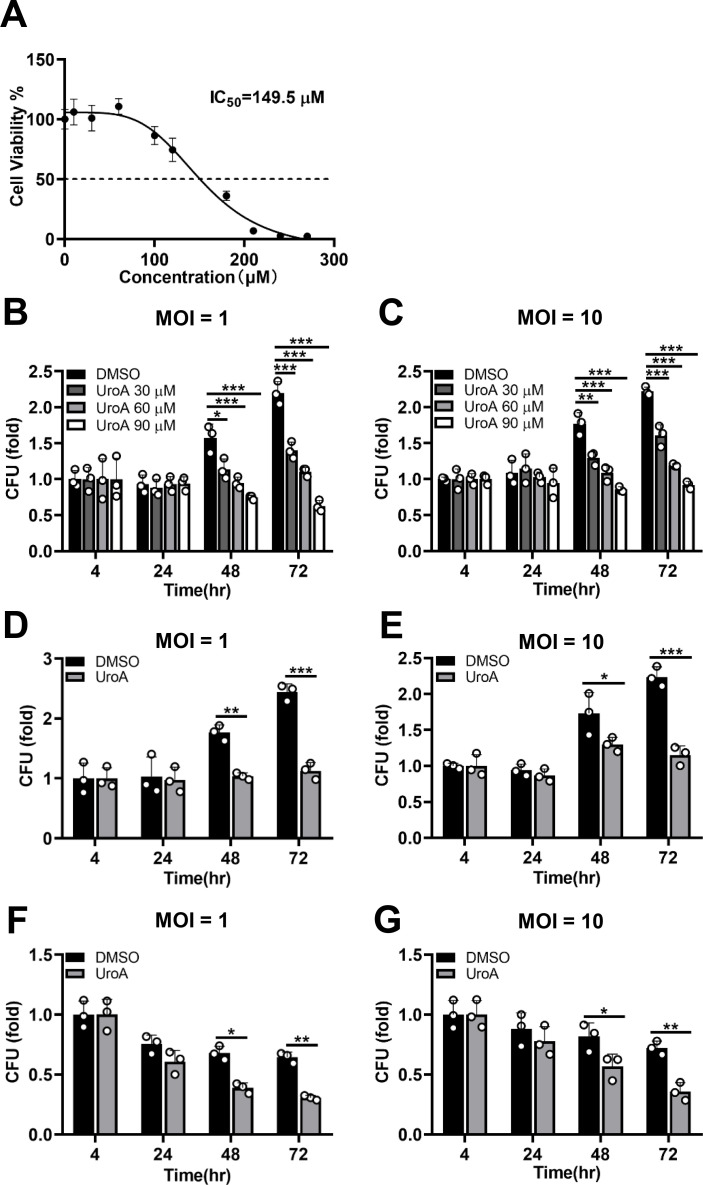
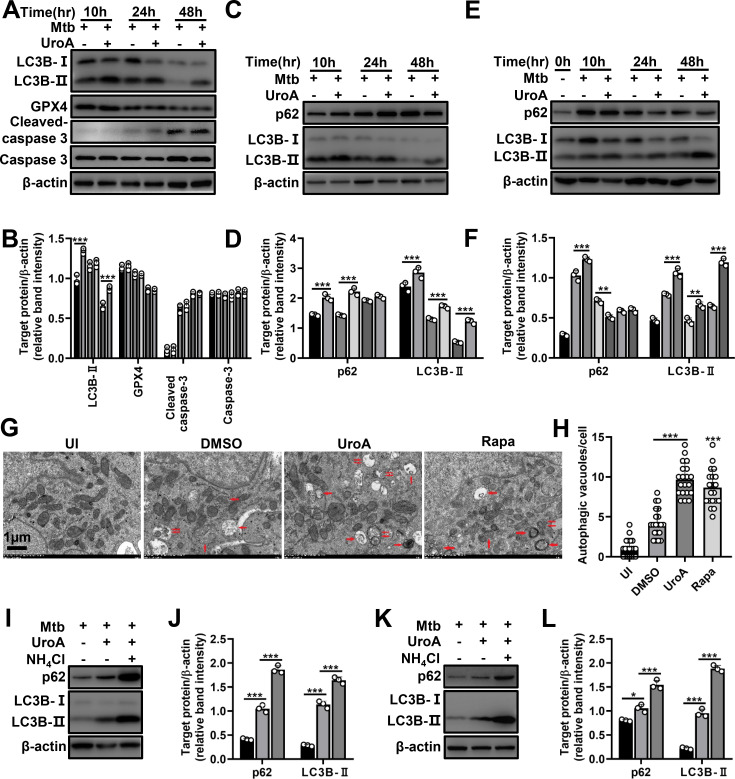
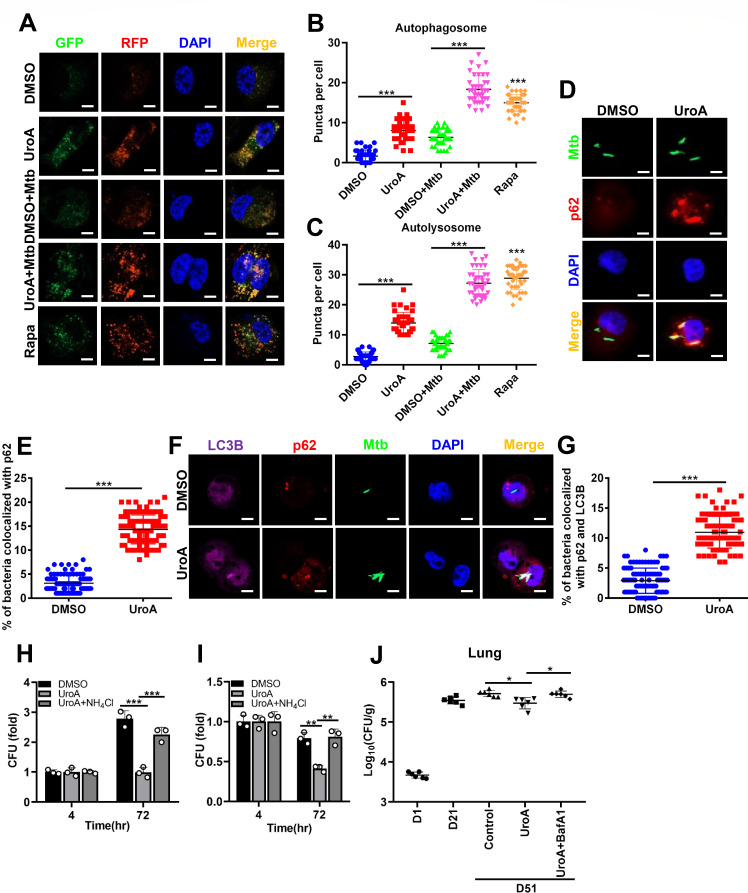
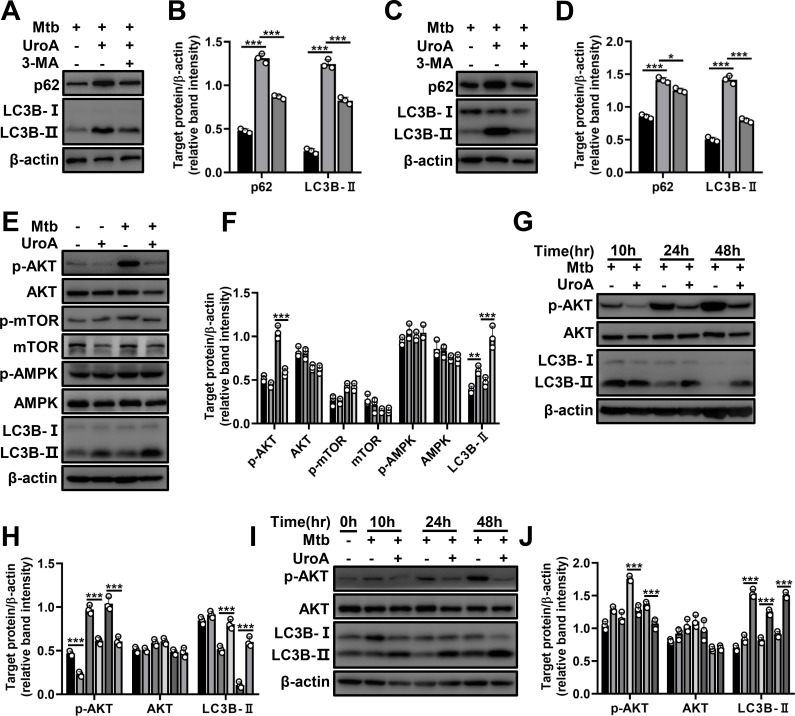
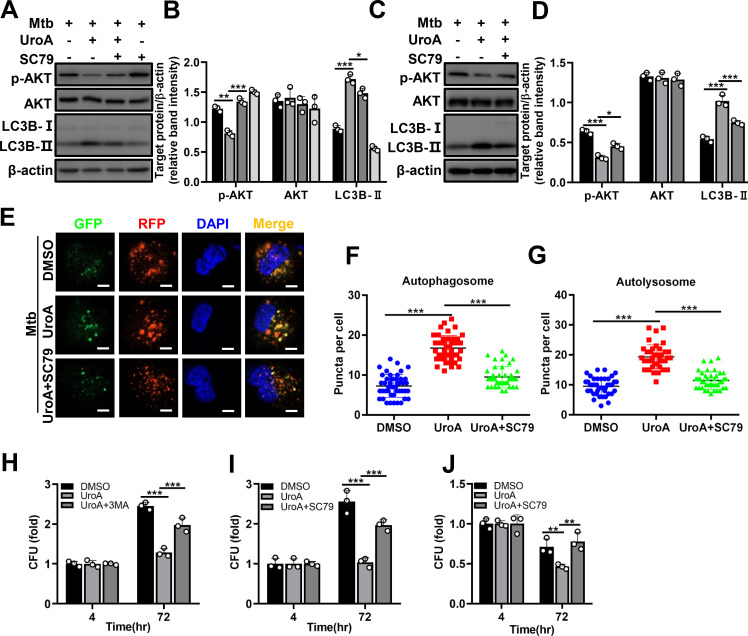
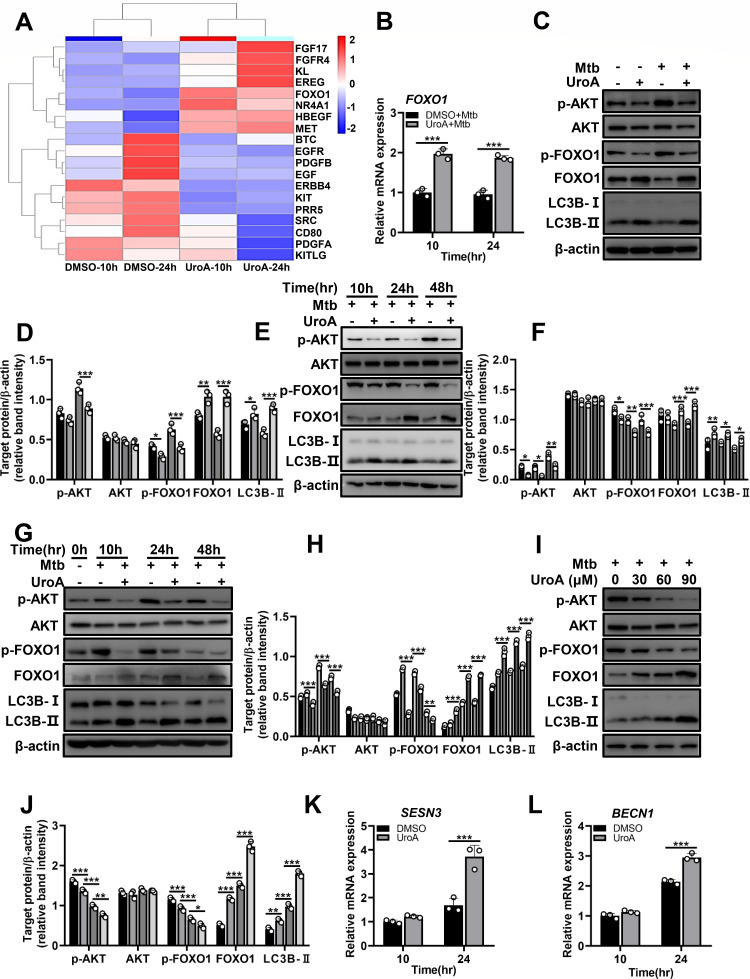
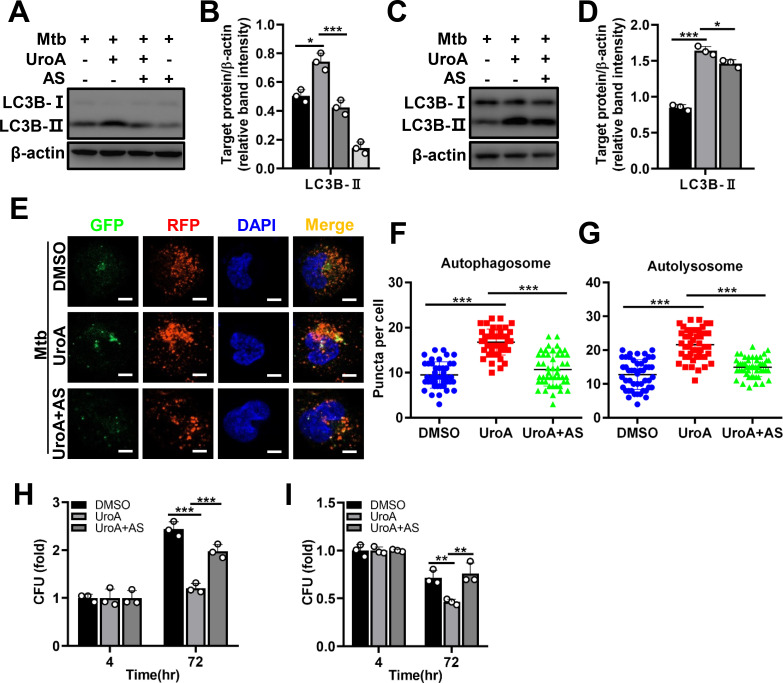
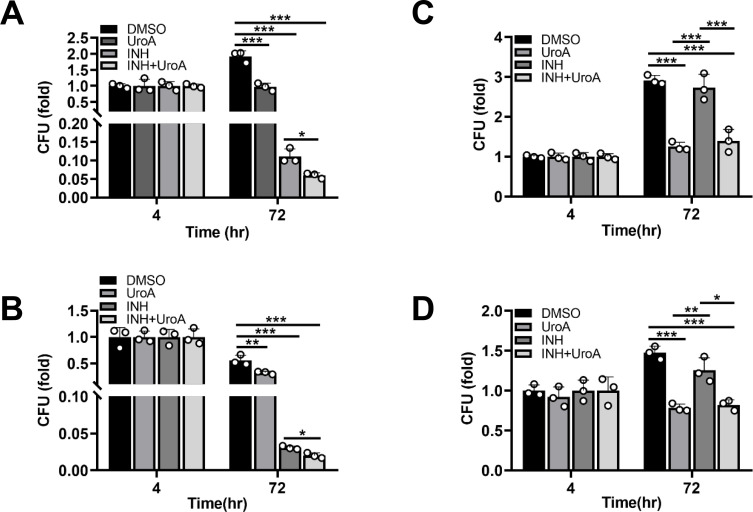
Tuberculosis (TB), resulting from Mycobacterium tuberculosis (Mtb), is one of the leading causes of morbidity and mortality in humans worldwide. Host-directed therapy (HDT) is a novel approach for treating TB, particularly those with drug resistance. Urolithin A (UroA) produced through bioconversion of plant-derived ellagic acid by gut microbes has been proven to have multiple beneficial effects in a variety of diseases without showing undesired adverse reactions. However, whether UroA has antimycobacterial effect and the underlying mechanism has not yet been reported. Here, we found that UroA significantly inhibited Mtb growth within both macrophages and mice. Moreover, UroA promoted the activation of autophagy in Mtb-infected macrophages via the protein kinase B-Forkhead box protein O1 signaling pathway, which contributed to the antimycobacterial effect of UroA. Additionally, UroA suppressed the survival of clinically isoniazid (INH)-resistant Mtb (C2) within macrophages, and the combination of UroA and INH synergistically enhanced host elimination of Mtb H37Rv. Therefore, UroA may be utilized as a potential candidate for HDT and as an adjunctive therapy with first-line anti-TB drugs.IMPORTANCEHost-directed therapy (HDT) is a novel approach for treating tuberculosis (TB), particularly those with drug resistance. Urolithin A (UroA) produced through bioconversion of plant-derived ellagic acid by gut microbes has been proven to have multiple beneficial effects in a variety of diseases without showing undesired adverse reactions. We found that UroA significantly inhibited Mycobacterium tuberculosis (Mtb) growth within macrophages. Moreover, UroA suppressed the survival of clinically isoniazid (INH)-resistant Mtb (C2) within macrophages, and the combination of UroA and INH synergistically enhanced host elimination of Mtb H37Rv. Therefore, UroA may be utilized as a potential candidate for HDT and as an adjunctive therapy with first-line anti-TB drugs.

Keywords: AKT-FOXO1 signaling pathway; HDT; Mycobacterium tuberculosis; autophagy; urolithin A.


Conflict of interest statement

The authors declare no conflict of interest.

Figures

Fig 1
Fig 1
UroA inhibits Mtb growth within macrophages. (A) Cell viability of Mtb-infected THP-1 cells treated with UroA. (B and C) THP-1 cells were preincubated with UroA (30, 60, and 90 µM) for 1 h and then infected with Mtb H37Rv (MOI, 10:1 or 1:1) for 4 h. Cells were washed thrice with warm phosphate-buffered saline and then treated with UroA for another 24, 48, and 72 h. The number of CFUs was determined. (D–G) THP-1 cells (D and E) and BMDMs (F and G) pretreated with UroA (60 µM) were infected with Mtb H37Rv (MOI, 10:1 or 1:1) for 4 h. The infected cells were washed and stimulated as described in panel B. The number of CFUs was determined. The data are presented as mean ± SD of three independent experiments. Unless indicated otherwise, there is no significant difference; *P < 0.05; **P < 0.01; ***P < 0.001.
Fig 2
Fig 2
UroA enhances autophagy flux within Mtb-infected macrophages. (A) THP-1 cells were pretreated with UroA (60 µM) for 1 h and then infected with Mtb H37Rv (MOI, 10:1). Cell lysates were subjected to western blot analysis. β-Actin was used as a loading control. (B) The relative band intensities (target protein/β-actin) of proteins. (C–F) THP-1 cells (C) and BMDMs (E) were pretreated with UroA and infected with Mtb H37Rv as described in panel A. Cell lysates were subjected to western blot analysis using anti-p62, anti-LC3B, or anti-β-actin antibodies. (D and F) Relative band intensities. (G) THP-1 cells were pretreated with UroA (60 µM) for 1 h and then infected with Mtb H37Rv (MOI, 10:1) for 24 h. The cells were harvested, fixed, and then subjected to TEM analysis. One representative TEM image was shown (scale bar 1 µm). Single arrows indicate autolysosomes, and double arrows indicate autophagosomes. Rapamycin (Rapa) treatment was used as a positive control. (H) The number of autophagic vacuoles per cell was quantified within 20 cells in each sample. (I–L) THP-1 cells (I) and BMDMs (K) were pretreated with UroA and infected with Mtb H37Rv as described in panel A in the presence or absence of NH4Cl. Cell lysates were subjected to western blot analysis using anti-p62, anti-LC3B, or anti-β-actin antibodies. (J and L) Relative band intensities. For each target protein, the relative band intensities from left to right matched the different treatment conditions in the same order. The data are presented as mean ± SD of three independent experiments. Unless indicated otherwise, there is no significant difference; *P < 0.05; **P < 0.01; ***P < 0.001.
Fig 3
Fig 3
UroA reduces Mtb survival by promoting autophagy in vitro and in vivo. (A–C) THP-1 cells expressing mRFP-GFP-LC3B reporter were pretreated with UroA (60 µM) and infected with Mtb H37Rv (MOI, 10:1). Representative confocal microscopic image in panel A; bar, 5 µm. Rapamycin (Rapa) was used as a positive control. (B and C) Autophagosomal (yellow, B) and autolysosomal (red, C) puncta in panel A were counted. (D and E) THP-1 cells were pretreated and infected as described in Fig. 2A using a GFP-overexpressing Mtb. Cells were fixed and immunostained for p62. Representative confocal microscopic image in panel D; (bar, 5 µm). (E) Percent colocalization of Mtb with p62 within THP-1 cells. A total of 100 bacterial cells were counted. (F and G) BMDMs were pretreated and infected as described in Fig. 2A using a GFP-overexpressing Mtb. Cells were fixed and immunostained for p62 and LC3B. Representative confocal microscopic image in panel F; (bar, 5 µm). (G) Percent colocalization of Mtb with p62 and LC3B within BMDMs. A total of 100 bacterial cells were counted. (H and I) THP-1 cells (H) or BMDMs (I) were pretreated with UroA and infected with Mtb H37Rv, as shown in Fig. 2A in the presence or absence of NH4Cl. After washing thrice with warm phosphate-buffered saline, cells were treated with UroA for another 72 h in the presence or absence of NH4Cl. The number of CFUs was counted. As the difference is sufficient at 72 h postinfection, we did not perform the experiment at 24 and 48 h postinfection. (J) C57BL/6 mice were infected with ~200 CFU of H37Rv through aerosol. The infected mice were intragastric administration of either 0.5% sodium carboxymethyl cellulose (Control) or 0.5% sodium carboxymethyl cellulose harboring UroA/UroA + BafA1 at 3 weeks postinfection for one month (once every two days). The bacteria burden in the lungs was determined at 1 day (D), 21 days, and 51 days. The data are presented as mean ± SD of three independent experiments. Unless indicated otherwise, there is no significant difference; *P < 0.05; **P < 0.01; ***P < 0.001.
Fig 4
Fig 4
UroA-mediated autophagy is closely associated with AKT activity. (A–D) THP-1 cells (A) and BMDMs (C) were pretreated with UroA and infected with Mtb H37Rv as described in Fig. 2A in the presence or absence of 3-MA. Cell lysates were subjected to western blot analysis using anti-p62, anti-LC3B, or anti-β-actin antibodies. (B and D) Relative band intensities. (E) THP-1 cells incubated with UroA (60 µM) were infected with Mtb H37Rv (MOI, 10:1). Cell lysates were subjected to western blot analysis. (F) Relative band intensities. (G–J) THP-1 cells (G) and BMDMs (I) were pretreated with UroA and infected with Mtb H37Rv as described in Fig. 2A. Cell lysates were subjected to western blot analysis using anti-p-AKT, anti-AKT, anti-LC3B, or anti-β-actin antibodies. (H and J) Relative band intensities. For each target protein, the relative band intensities from left to right matched the different treatment conditions in the same order. The data are presented as mean ± SD of three independent experiments. Unless indicated otherwise, there is no significant difference; *P < 0.05; **P < 0.01; ***P < 0.001.
Fig 5
Fig 5
AKT agonist inhibits UroA-mediated autophagy and antimycobacterial effect. (A–D) THP-1 cells (A) and BMDMs (C) were pretreated with UroA and infected with Mtb H37Rv as described in Fig. 2A in the presence or absence of SC79. Cell lysates were subjected to western blot analysis using anti-p-AKT, anti-AKT, anti-LC3B, or anti-β-actin antibodies. (B and D) Relative band intensities. (E–G) THP-1 cells expressing mRFP-GFP-LC3B reporter were pretreated with UroA (60 µM) and infected with Mtb H37Rv (MOI, 10:1) in the presence or absence of SC79. Representative confocal microscopic image in panel E; (bar, 5 µm). (F and G) Autophagosomal (yellow, F) and autolysosomal (red, G) puncta in panel E. (H–J) THP-1 cells (H and I) or BMDMs (J) were pretreated with UroA and infected with Mtb H37Rv as described in Fig. 2A in the presence or absence of 3-MA or SC79. After washing with warm phosphate-buffered saline, cells were retreated with UroA for another 72 h in the presence or absence of 3-MA or SC79. The number of CFUs was counted. As the difference is sufficient at 72 h postinfection, we did not perform the experiment at 24 and 48 h postinfection. For each target protein, the relative band intensities from left to right matched the different treatment conditions in the same order. The data are presented as mean ± SD of three independent experiments. Unless indicated otherwise, there is no significant difference; *P < 0.05; **P < 0.01; ***P < 0.001.
Fig 6
Fig 6
UroA activates autophagy by regulating AKT–FOXO1 signaling. (A) Genes involved in the PI3K–AKT signaling pathway in UroA-treated and Mtb H37Rv-infected THP-1 cells assessed by the Kyoto Encyclopedia of Genes and Genomes pathway enrichment analysis. (B) The relative expression of FOXO1 in Mtb H37Rv-infected THP-1 cells with or without UroA treatment. (C) THP-1 cells treated with UroA (60 µM) were infected with Mtb H37Rv (MOI, 10:1). Cell lysates were subjected to western blot analysis using anti-p-AKT, anti-AKT, anti-p-FOXO1, anti-FOXO1, anti-LC3B, or anti-β-actin antibodies. (D) Relative band intensities. (E–H) THP-1 cells (E) and BMDMs (G) were pretreated with UroA and infected with Mtb H37Rv as described in Fig. 2A. Cell lysates were subjected to western blot analysis. (F and H) Relative band intensities. (I) THP-1 cells were preincubated with UroA at different concentrations (0 µM–90 µM) and then infected with Mtb H37Rv (MOI, 10:1). Cell lysates were subjected to western blot analysis. (J) Relative band intensities. (K and L) Relative expression of SESN3 (K) and BECN1 (L) in Mtb H37Rv-infected THP-1 cells with or without UroA treatment. For each target protein, the relative band intensities from left to right matched the different treatment conditions in the same order. The data are presented as mean ± SD of three independent experiments. Unless indicated otherwise, there is no significant difference; *P < 0.05; **P < 0.01; ***P < 0.001.
Fig 7
Fig 7
AKT–FOXO1 signaling regulated by UroA activates autophagy to exert antimycobacterial effects. (A–D) THP-1 cells (A) and BMDMs (C) were pretreated with UroA and infected with Mtb H37Rv as described in Fig. 2A in the presence or absence of AS. Cell lysates were subjected to western blot analysis. (B and D) Relative band intensities. (E–G) THP-1 cells expressing mRFP-GFP-LC3B reporter were pretreated with UroA (60 µM) and infected with Mtb H37Rv (MOI, 10:1) in the presence or absence of AS. Representative confocal microscopic image in panel E; (bar, 5 µm). (F and G) Autophagosomal (yellow, F) and autolysosomal (red, G) puncta in panel E. (H and I) THP-1 cells (H) or BMDMs (I) were pretreated with UroA and infected with Mtb H37Rv as described in Fig. 2A in the presence or absence of AS. After washing with warm phosphate-buffered saline, cells were retreated with UroA for another 72 h in the presence or absence of AS. The number of CFUs was counted. As the difference is sufficient at 72 h postinfection, we did not perform the experiment at 24 and 48 h postinfection. For each target protein, the relative band intensities from left to right matched the different treatment conditions in the same order. The data are presented as mean ± SD of three independent experiments. Unless indicated otherwise, there is no significant difference; *P < 0.05; **P < 0.01; ***P < 0.001.
Fig 8
Fig 8
Combined utilization of INH and UroA synergistically contributes to Mtb clearance. (A and B) THP-1 cells (A) and BMDMs (B) preincubated with UroA for 1 h were infected with Mtb H37Rv (MOI, 10:1) for 4 h. After washing thrice with warm phosphate-buffered saline (PBS), the infected macrophages were incubated with UroA (60 µM) in combination with INH (0.1 µg/mL) for another 72 h. Cells were lysed, and the number of CFUs was counted. As the difference is sufficient at 72 h postinfection, we did not perform the experiment at 24 and 48 h postinfection. (C and D) THP-1 cells (C) and BMDMs (D) preincubated with UroA for 1 h were infected with C2 (MOI, 10:1) for 4 h. After washing thrice with warm PBS, the infected macrophages were incubated with UroA (60 µM) in combination with INH (0.1 µg/mL) for another 72 h. Cells were lysed, and the number of CFUs was counted. As the difference is sufficient at 72 h postinfection, we did not perform the experiment at 24 and 48 h postinfection. The data are presented as mean ± SD of three independent experiments. Unless indicated otherwise, there is no significant difference; *P < 0.05; **P < 0.01; ***P < 0.001.

Similar articles

References

    1. World Health Organization . 2023. Global tuberculosis report 2023
    1. Bruns H, Stegelmann F, Fabri M, Döhner K, van Zandbergen G, Wagner M, Skinner M, Modlin RL, Stenger S. 2012. Abelson tyrosine kinase controls phagosomal acidification required for killing of Mycobacterium tuberculosis in human macrophages. J Immunol 189:4069–4078. doi:10.4049/jimmunol.1201538 - DOI - PMC - PubMed
    1. Critchley JA, Young F, Orton L, Garner P. 2013. Corticosteroids for prevention of mortality in people with tuberculosis: a systematic review and meta-analysis. Lancet Infect Dis 13:223–237. doi:10.1016/S1473-3099(12)70321-3 - DOI - PubMed
    1. Jurado JO, Alvarez IB, Pasquinelli V, Martínez GJ, Quiroga MF, Abbate E, Musella RM, Chuluyan HE, García VE. 2008. Programmed death (PD)-1:PD-ligand 1/PD-ligand 2 pathway inhibits T cell effector functions during human tuberculosis. J Immunol 181:116–125. doi:10.4049/jimmunol.181.1.116 - DOI - PubMed
    1. Roca FJ, Ramakrishnan L. 2013. TNF dually mediates resistance and susceptibility to mycobacteria via mitochondrial reactive oxygen species. Cell 153:521–534. doi:10.1016/j.cell.2013.03.022 - DOI - PMC - PubMed

MeSH terms

LinkOut - more resources