Proteomic Analysis of 442 Clinical Plasma Samples From Individuals With Symptom Records Revealed Subtypes of Convalescent Patients Who Had COVID-19
- PMID: 40207927
- PMCID: PMC11984345
- DOI: 10.1002/jmv.70203
Proteomic Analysis of 442 Clinical Plasma Samples From Individuals With Symptom Records Revealed Subtypes of Convalescent Patients Who Had COVID-19
Abstract
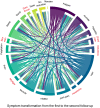
After the coronavirus disease 2019 (COVID-19) pandemic, the postacute effects of severe acute respiratory syndrome coronavirus 2 (SARS-CoV-2) infection have gradually attracted attention. To precisely evaluate the health status of convalescent patients with COVID-19, we analyzed symptom and proteome data of 442 plasma samples from healthy controls, hospitalized patients, and convalescent patients 6 or 12 months after SARS-CoV-2 infection. Symptoms analysis revealed distinct relationships in convalescent patients. Results of plasma protein expression levels showed that C1QA, C1QB, C2, CFH, CFHR1, and F10, which regulate the complement system and coagulation, remained highly expressed even at the 12-month follow-up compared with their levels in healthy individuals. By combining symptom and proteome data, 442 plasma samples were categorized into three subtypes: S1 (metabolism-healthy), S2 (COVID-19 retention), and S3 (long COVID). We speculated that convalescent patients reporting hair loss could have a better health status than those experiencing headaches and dyspnea. Compared to other convalescent patients, those reporting sleep disorders, appetite decrease, and muscle weakness may need more attention because they were classified into the S2 subtype, which had the most samples from hospitalized patients with COVID-19. Subtyping convalescent patients with COVID-19 may enable personalized treatments tailored to individual needs. This study provides valuable plasma proteomic datasets for further studies associated with long COVID.
Keywords: COVID‐19 convalescents; plasma; proteomics; subtype; symptoms.
Journal of Medical Virology© 2025 The Author(s). Journal of Medical Virology published by Wiley Periodicals LLC.
Conflict of interest statement
The authors declare no conflicts of interest.
Figures


Similar articles
-
Longitudinal multi-omics analysis of convalescent individuals with respiratory sequelae 6-36 months after COVID-19.BMC Med. 2025 Mar 5;23(1):134. doi: 10.1186/s12916-025-03971-w. BMC Med. 2025. PMID: 40038650 Free PMC article.
-
Longitudinal analysis of SARS-CoV-2 antibodies in 8000 U.S. first-time convalescent plasma donations.Transfusion. 2021 Apr;61(4):1141-1147. doi: 10.1111/trf.16291. Epub 2021 Feb 22. Transfusion. 2021. PMID: 33615484 Free PMC article.
-
Proteomic analysis of post-COVID condition: Insights from plasma and pellet blood fractions.J Infect Public Health. 2024 Dec;17(12):102571. doi: 10.1016/j.jiph.2024.102571. Epub 2024 Oct 23. J Infect Public Health. 2024. PMID: 39486386
-
Treatment of COVID-19 with convalescent plasma: lessons from past coronavirus outbreaks.Clin Microbiol Infect. 2020 Oct;26(10):1436-1446. doi: 10.1016/j.cmi.2020.08.005. Epub 2020 Aug 11. Clin Microbiol Infect. 2020. PMID: 32791241 Free PMC article. Review.
-
Convalescent plasma or hyperimmune immunoglobulin for people with COVID-19: a rapid review.Cochrane Database Syst Rev. 2020 May 14;5(5):CD013600. doi: 10.1002/14651858.CD013600. Cochrane Database Syst Rev. 2020. Update in: Cochrane Database Syst Rev. 2020 Jul 10;7:CD013600. doi: 10.1002/14651858.CD013600.pub2. PMID: 32406927 Free PMC article. Updated.
References
-
- Jiang Y., Sun A., Zhao Y., et al., “Proteomics Identifies New Therapeutic Targets of Early‐Stage Hepatocellular Carcinoma,” Nature 567 (2019): 257–261. - PubMed
MeSH terms
Substances
LinkOut - more resources
Full Text Sources
Medical
Miscellaneous

