. 2025 May 20;99(5):e0222424.
doi: 10.1128/jvi.02224-24. Epub 2025 Apr 10.

The ACBD3 protein coordinates ER-Golgi contacts to enable productive TBEV infection

Affiliations

The ACBD3 protein coordinates ER-Golgi contacts to enable productive TBEV infection

Wai-Lok Yau et al. J Virol. .

Abstract

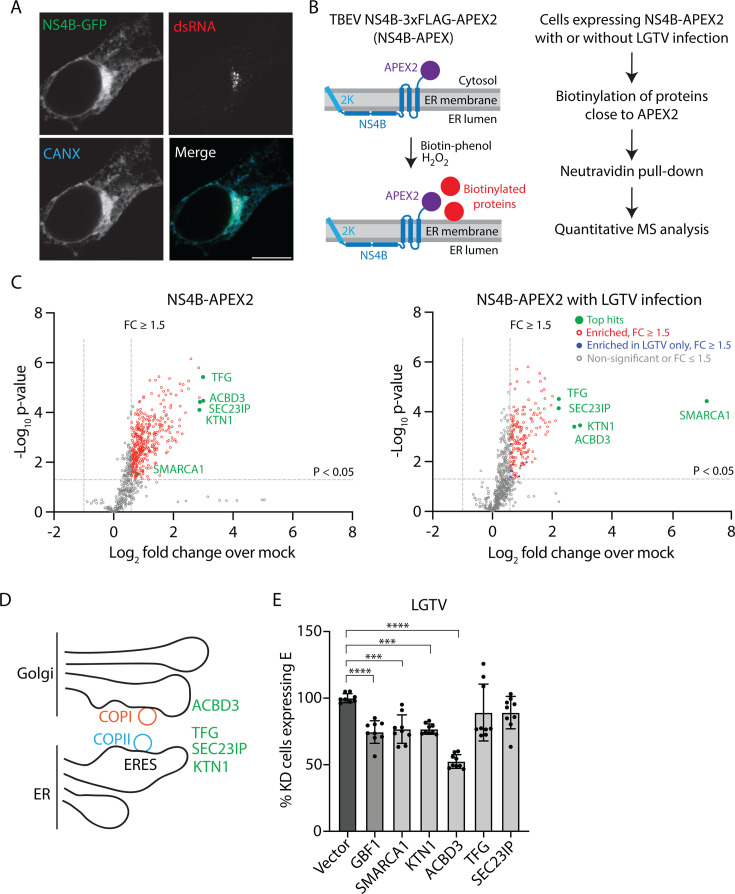
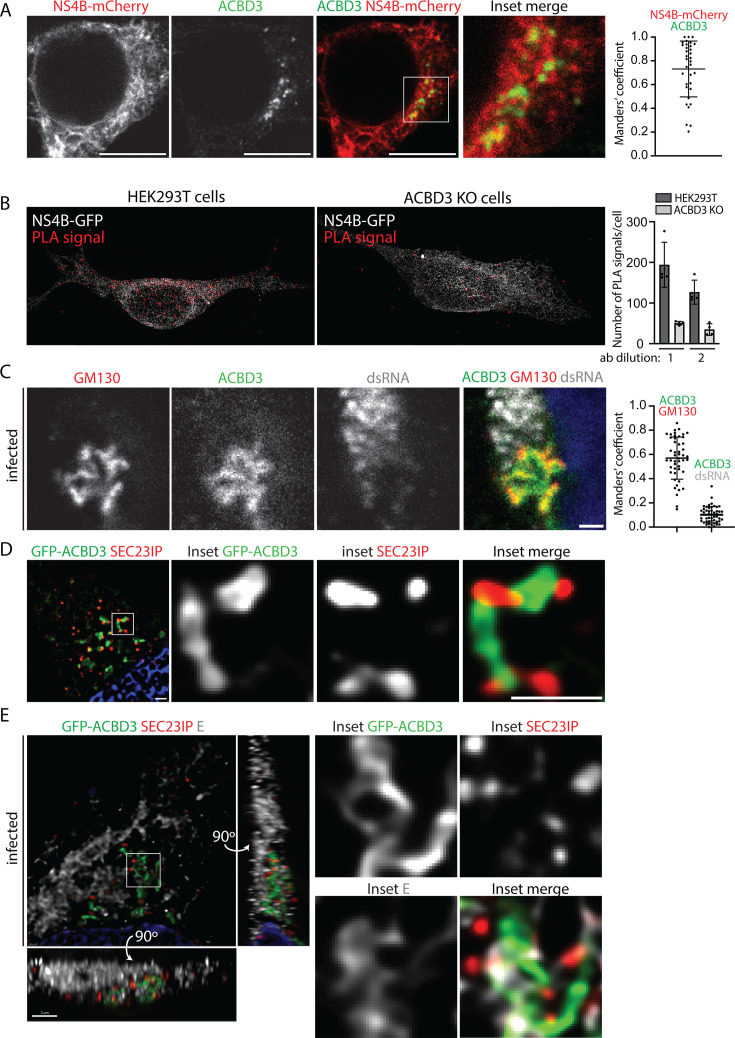
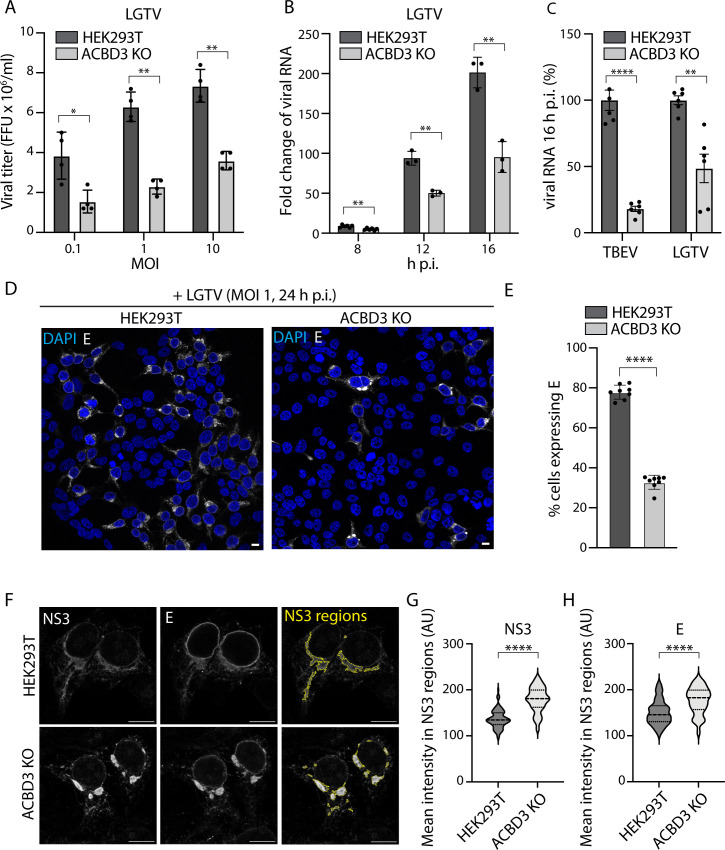
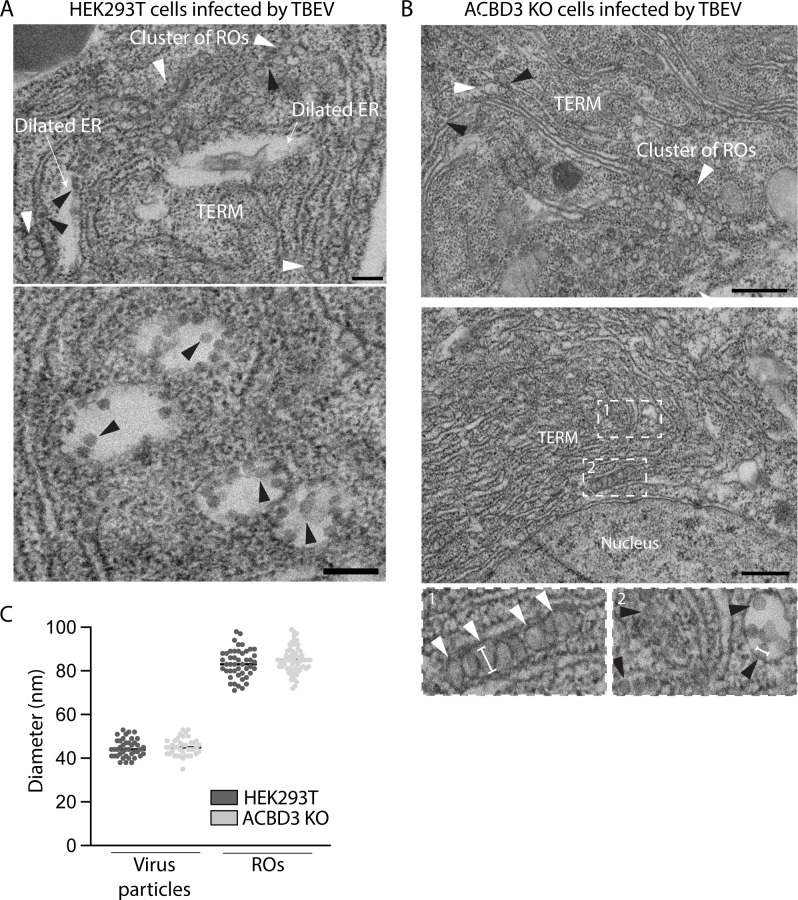
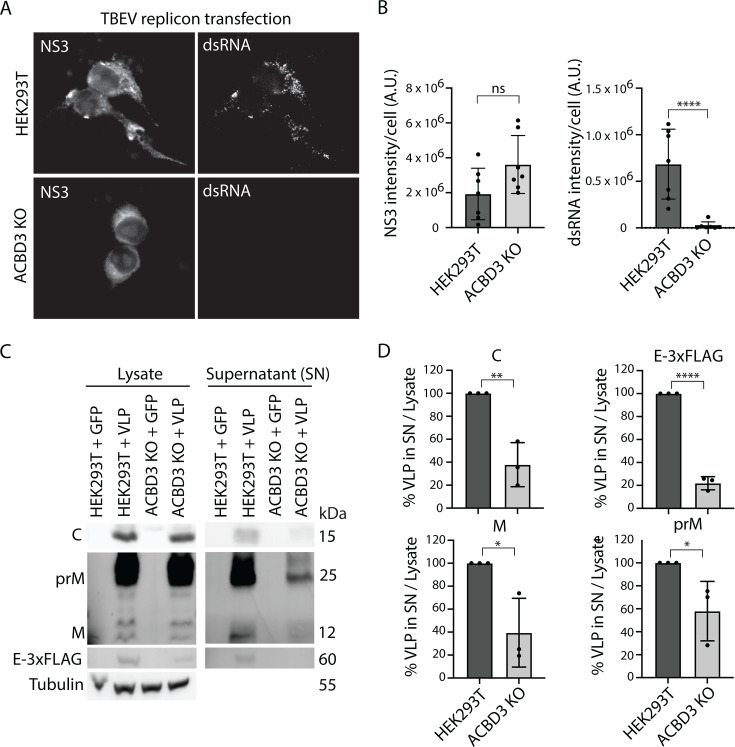
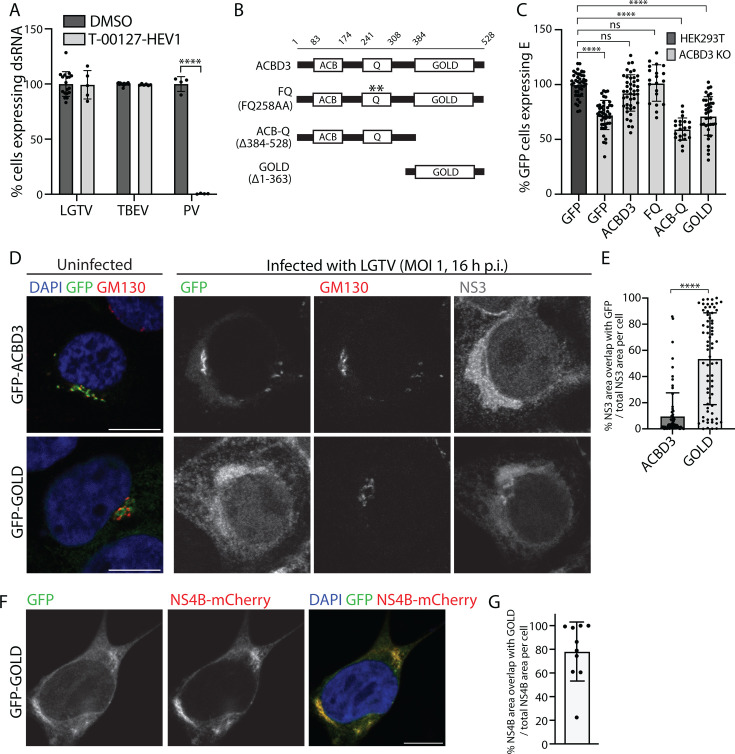
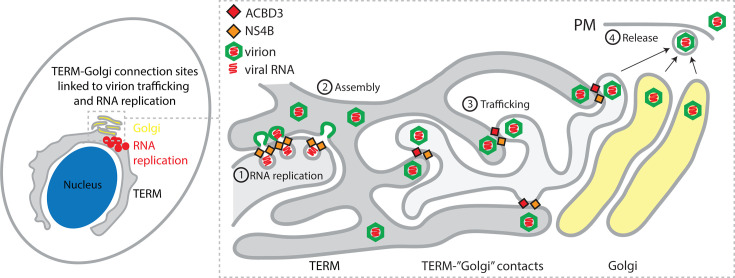
Flavivirus infection involves extensive remodeling of the endoplasmic reticulum (ER), which is key to both the replication of the viral RNA genome as well as the assembly and release of new virions. However, little is known about how viral proteins and host factors cooperatively facilitate such a vast transformation of the ER, and how this influences the different steps of the viral life cycle. In this study, we screened for host proteins that were enriched in close proximity to the tick-borne encephalitis virus (TBEV) protein NS4B and found that the top candidates were coupled to trafficking between ER exit sites (ERES) and the Golgi. We characterized the role of ACBD3, one of the identified proteins, and showed that it promotes TBEV infection. Depletion of ACBD3 inhibited virus replication and resulted in abnormal transformation of the ER, leading to reduced virion release. ACBD3's proviral mechanism did not involve the recruitment of PI4PK as previously described for enteroviruses. Instead, productive TBEV infection required the full-length ACBD3, which localizes to ER-Golgi contact sites together with NS4B. We propose that NS4B and ACBD3 promote replication by coordinating the transformation of the ER, which is required for RNA replication and particle release. The transformation involves direct coupling to the Golgi which facilitates efficient virion transport.

Importance: Flaviviruses like tick-borne encephalitis have significant effects on human health. During flavivirus infection, the viral particles enter the host cells and transform the endoplasmic reticulum (ER), which is a membranous organelle and the main site of cellular protein synthesis. Although this is critical for successful infection, the details of the process are unknown. Here, we found that the viral protein NS4B and the host protein ACBD facilitate this transformation by ensuring that the ER is coupled to the Golgi apparatus, the organelle responsible for transporting material out of the cell. TBEV uses ACBD3 to guarantee that the connection sites between the transformed ER and the Golgi remain functional so that RNA is replicated and the produced viral particles are exported from the cell and can infect further cells. Our work sheds light both on the basic biology of flavivirus infection, and virus-induced remodeling of membranous organelles.

Keywords: ACBD3; ER exit sites; ERES-Golgi contact; NS4B; Orthoflavivirus; flavivirus; host-pathogen interaction; replication organelles.


Conflict of interest statement

The authors declare no conflict of interest.

Figures

Fig 1
Fig 1
Identification of ACBD3 as a host factor in NS4B-APEX2 proximal protein analysis. (A) Confocal fluorescence micrographs of HEK293T cells transiently expressing TBEV NS4B-GFP infected with LGTV (MOI 10, 16 h.p.i.) and stained with anti-calnexin (CANX, ER marker) antibodies and anti-dsRNA antibodies. Scale bar, 10 µm. (B) Schematic illustration of the NS4B-APEX2 proximal protein biotinylation screen used in this study. (C) Volcano plots of the proteins identified in the NS4B-APEX2 proximal protein biotinylation screen in NS4B-APEX2 cells (left) and NS4B-APEX2 cells infected with LGTV (MOI 10, 16 h.p.i.) (right). Proteins are indicated by dots color-coded based on the FC and P-values. Three biological replicates per condition were analyzed, and the P-value was calculated using unpaired t-test. (D) Schematic illustration of ERES-Golgi contacts, and the top hit proteins ACBD3, TFG, SEC23IP, and KTN1 (E) Quantification of the percentage of GFP-positive KD HEK293T cells expressing E protein at 24 h after LGTV infection (MOI 1). The KD proteins are indicated. Mean ± SD of 3 independent experiments. One-way ANOVA with Dunnett multiple tests, ***P < 0.005, ****P < 0.0001.
Fig 2
Fig 2
ACBD3 localization in healthy and infected cells. (A) Confocal fluorescence micrographs of HEK293T cells transiently expressing NS4B-mCherry and stained with anti-ACBD3 antibodies. Scale bars, 10 µm. Manders’ coefficient between the ACBD3 and NS4B signals is shown on the right-hand side as mean ± SD. (B) Fluorescent SIM images of HEK293T and ACBD3 KO cells transfected with NS4B-GFP and processed using the PLA providing a signal for the close proximity between antibodies against GFP and ACBD3 (ab dilution 1). Quantification of the number of PLA signal events per cell is shown on the right. Ab dilution 1: anti-GFP 1:200, anti-ACBD3 1:500; ab dilution 2: anti-GFP 1:100, anti-ACBD3 1:1000. (C) Confocal fluorescence micrographs (single Z frame) of LGTV-infected (MOI 1, 16 h.p.i.) HEK293T cells and stained with antibodies against ACBD3, GM130, and dsRNA. Scale bar, 1 µm. Manders’ coefficient between the indicated signals is shown on the right-hand side as mean ± SD. (D) SIM fluorescence micrographs (100 nm resolution) of HEK293T cells transiently expressing GFP-ACBD3 and stained with anti-SEC23IP antibodies. Scale bars, 1 µm. (E) SIM fluorescence micrographs (100 nm resolution) of HEK293T cells transiently expressing GFP-ACBD3 at 16 h after LGTV infection (MOI 1) stained with anti-SEC23IP and anti-E antibodies. Scale bars, 1 µm. The left-hand panels show the image stack projected along the Z, Y, and X axes. The right-hand panels show a single Z frame of the inset area.
Fig 3
Fig 3
ACBD3 promotes flavivirus infection. (A) Quantification of the viral titers of the supernatant from LGTV-infected (24 h.p.i.) HEK293T cells and ACBD3 KO cells by focus-forming assay. Mean ± SD of 4 biological replicates. Unpaired t-test, (B) Viral RNA in LGTV-infected (MOI 1) HEK293T and ACBD3 KO cells quantified by RT-qPCR and normalized to actin and to the 2 h post-infection (input) using the ∆∆Ct method and given as fold change. Mean ± SD of 3 biological replicates. Unpaired t-test. (C) Quantification of relative amounts of TBEV and LGTV RNA in infected (MOI 1, 16 h.p.i.) HEK293T cells and ACBD3 KO cells compared to HEK293T cells by RT-qPCR and normalized to actin. Data were normalized to actin as in (B) and to HEK293T cells for comparison. Mean ± SD of 6 biological replicates. Unpaired t-test. (D) Confocal fluorescence micrographs of LGTV-infected (MOI 1, 24 h.p.i.) HEK293T and ACBD3 KO cells stained with anti-E antibodies and DAPI. Scale bar, 10 µm. (E) Quantification of the percentage of HEK293T and ACBD3 KO cells expressing E protein at 24 h after LGTV infection (MOI 1). Mean ± SD of at least seven biological replicates. Unpaired t-test. (F) Confocal fluorescence micrographs of LGTV-infected (MOI 1, 16 h.p.i.) HEK293T and ACBD3 KO cells stained with anti-NS3 antibodies and anti-E antibodies. Yellow lines in the right-hand panels indicate the identified NS3 regions (see Materials and Methods). Scale bar, 10 µm. (G–H) Quantification of the mean fluorescence intensities of NS3 (G) and E (H) within the identified NS3 regions. Data are presented in violin plots with median and quartiles indicated by dashed and dotted lines, respectively. Number of NS3 regions analyzed, HEK293T (n = 95), ACBD3 KO (n = 103). Unpaired t-test. *P < 0.05, **P < 0.005, ****P < 0.0001 in (A–C), (E), and (G–H).
Fig 4
Fig 4
ACBD3 KO does not affect the ultrastructure in infected cells. (A and B) Representative electron micrographs of HEK293T (A) or ACBD3 KO (B) cells infected with TBEV (MOI 1, 24 h.p.i.) shown at two magnifications. The micrographs contain both replication organelles (ROs) (white arrowheads) and viral particles (black arrowheads). Other notable features are indicated. The insets in (B) show close-ups of areas 1 and 2. Scale bars (A): 200 nm, (B): 500 nm. (C) Size quantification of identified virus particles and ROs in HEK293T and ACBD3 KO cells. Quantification was performed along the longest axis, as shown by the white lines in (B) insets 1 and 2.
Fig 5
Fig 5
ACBD3 KO reduces replication and VLP secretion. (A) Fluorescence micrographs of LGTV-infected (MOI 1, 24 h.p.i.) HEK293T and ACBD3 KO cells transfected with TBEV-replicon for 24 h and stained with anti-NS3 and anti-dsRNA antibodies as indicated. Scale bar, 10 µm. (B) Quantification of the total intensity of NS3 and dsRNA stain in TBEV replicon-transfected cells. Mean ± SD of 7 images per condition with 2–12 transfected cells per image from three biological replicates. Unpaired t-test. (C and D) Immunoblot analysis of VLP secretion in HEK293T cells and ACBD3 KO cells transiently co-transfected with C, prM, and E-3xFLAG (24 hours) using antibodies against C, M/prM, and 3×FLAG. Representative blots are shown in (C) and quantification of the densitometric data in (D). Data were normalized to HEK293T + VLP control. Mean ± SD of 3 biological replicates. Unpaired t-test. ns P > 0.05, *P < 0.05, **P < 0.005, ****P < 0.0001 in (B) and (D).
Fig 6
Fig 6
Full-length ACBD3 promotes flavivirus infection independently of PI4KB. (A) Quantification of the percentage of A549 cells positive for dsRNA after infection with LGTV, TBEV (24 h.p.i, MOI 0.1), or PV (6 h.p.i., MOI 10) in the absence or presence of T-00127-HEV1 (1.25 µM). Data were normalized to DMSO-treated infected A549 cells. Mean ± SD of at least five biological replicates from three independent experiments, unpaired t-test. (B) Schematic illustration of ACBD3 domains and the ACBD3 mutants used in the study. (C) Quantification of the percentage of GFP-positive HEK293T and ACBD3 KO cells expressing E protein at 24 h after TBEV infection (MOI 0.1) after transfection with different ACBD3 constructs. Data were normalized to GFP-positive HEK293T cells. Mean ± SD of at least 10 biological replicates from two independent experiments. One-way ANOVA with Dunnett multiple tests. (D) Confocal fluorescence micrographs of ACBD3 KO cells transiently over-expressing GFP-ACBD3 or GFP-GOLD stained with anti-GM130 and NS3 (only in the infection experiment) antibodies either without infection (left) or 16 h after LGTV infection at MOI 1 (right). Scale bar, 10 µm. (E) Quantification of the percentage of NS3 area overlapping with GFP in GFP-ACBD3 or GFP-GOLD-transfected cells. Data are presented in scatter plots with mean ± SD. Number of NS3 areas analyzed, GFP-ACBD3 (n = 130), GFP-GOLD (n = 179). Mann-Whitney test. (F) Confocal fluorescence micrographs of ACBD3 KO cells transiently expressing NS4B-mCherry and GFP-GOLD. Scale bar, 10 µm. (G) Quantification of the percentage of the fluorescence NS4B area overlapping with the fluorescence of GFP-GOLD. Data are presented in a scatter plot with mean ± SD. The number of cells analyzed is indicated. ns P > 0.05, ****P < 0.0001. **P < 0.005, ****P < 0.0001 in (A), (C), (E), and (G).
Fig 7
Fig 7
Model of TERM and ACBD3 function in flavivirus infection. Schematic illustration of the proposed roles of NS4B and ACBD3 in promoting connection sites between the TERM and the cis-Golgi in order to promote secretion of virions. Viral RNA genomes are replicated in TERM-derived ROs, which contain NS4B and other viral and host proteins (1), and the genomes interact with viral structural proteins to form immature virions that bud into the lumen of the TERM (2). The virions are trafficked to the ERES-Golgi contact sites that have been modified by NS4B and host proteins to facilitate the transport of large viral cargoes to the Golgi (3). In the Golgi, it is unknown if the virions are trafficked through the Golgi like canonical exocytic cargoes, or if they are transported straight to the PM for release (4).

Similar articles

References

    1. Postler TS, Beer M, Blitvich BJ, Bukh J, de Lamballerie X, Drexler JF, Imrie A, Kapoor A, Karganova GG, Lemey P, Lohmann V, Simmonds P, Smith DB, Stapleton JT, Kuhn JH. 2023. Renaming of the genus Flavivirus to Orthoflavivirus and extension of binomial species names within the family Flaviviridae. Arch Virol 168:224–227. doi:10.1007/s00705-023-05835-1 - DOI - PubMed
    1. Pierson TC, Diamond MS. 2020. The continued threat of emerging flaviviruses. Nat Microbiol 5:796–812. doi:10.1038/s41564-020-0714-0 - DOI - PMC - PubMed
    1. Barrows NJ, Campos RK, Liao K-C, Prasanth KR, Soto-Acosta R, Yeh S-C, Schott-Lerner G, Pompon J, Sessions OM, Bradrick SS, Garcia-Blanco MA. 2018. Biochemistry and molecular biology of flaviviruses. Chem Rev 118:4448–4482. doi:10.1021/acs.chemrev.7b00719 - DOI - PMC - PubMed
    1. Sager G, Gabaglio S, Sztul E, Belov GA. 2018. Role of host cell secretory machinery in Zika virus life cycle. Viruses 10:559. doi:10.3390/v10100559 - DOI - PMC - PubMed
    1. Fishburn AT, Pham OH, Kenaston MW, Beesabathuni NS, Shah PS. 2022. Let’s get physical: flavivirus-host protein-protein interactions in replication and pathogenesis. Front Microbiol 13:847588. doi:10.3389/fmicb.2022.847588 - DOI - PMC - PubMed

MeSH terms

Substances

LinkOut - more resources