

Single-cell pigment analysis of phototrophic and phyllosphere bacteria using simultaneous detection of Raman and autofluorescence spectra
- PMID: 40207966
- PMCID: PMC12093961
- DOI: 10.1128/aem.00129-25
Single-cell pigment analysis of phototrophic and phyllosphere bacteria using simultaneous detection of Raman and autofluorescence spectra
Abstract
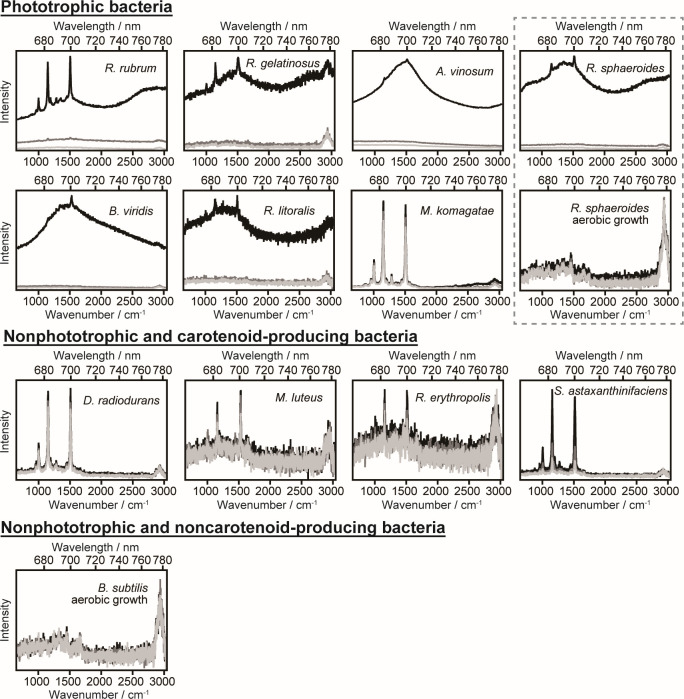
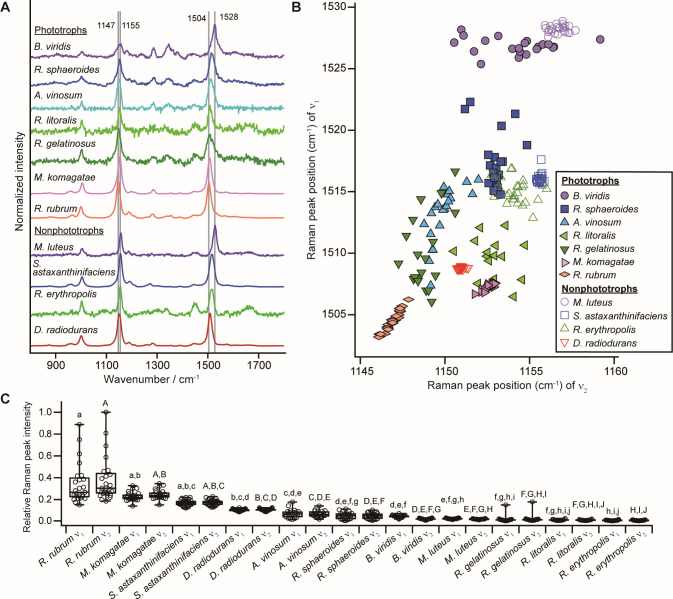
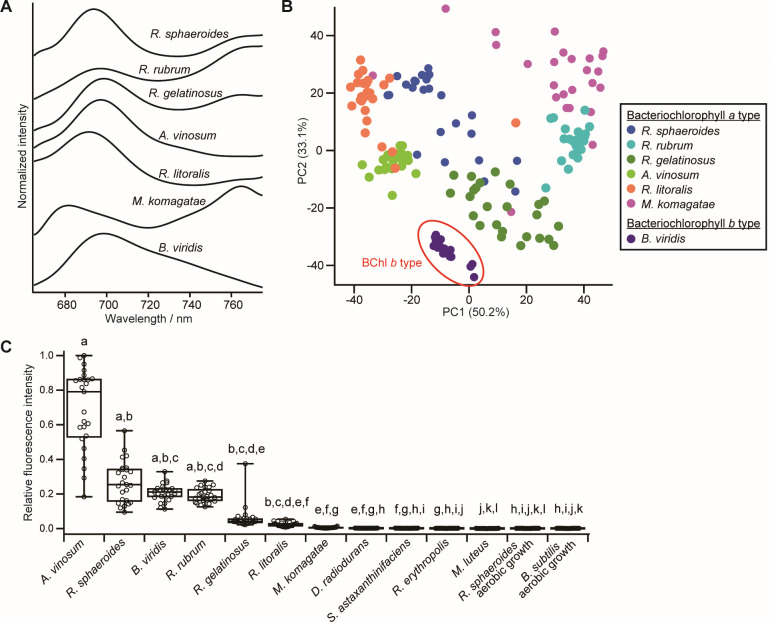
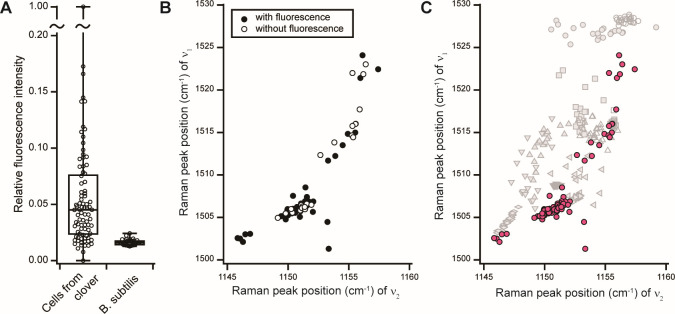
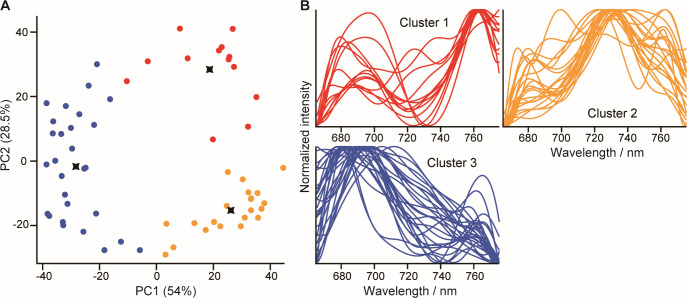
Microbes produce various types of pigments that are essential for their biological activities. Microbial pigments are important for humans because they are used in the food industry and medicine. The visualization and evaluation of the pigment diversity of microbial cells living in natural environments will contribute not only to the understanding of their ecophysiology but also to the screening of useful microbes. Here, we demonstrate the simultaneous, nondestructive detection of the resonance Raman and autofluorescence spectra of pigments in model purple phototrophic bacteria at the single-cell level. The single-cell Raman spectra measured using confocal laser Raman microspectroscopy with 632.8 nm excitation covered the wavenumber range of 660-3,022 cm-1 (corresponding to 661-783 nm), in which the autofluorescence spectra from the pigments can be detected simultaneously as a baseline. The peak position of the resonance Raman spectra of the carotenoids in the cells provided information on the length of the polyene chain and structural characteristics, such as conjugated keto groups and terminal rings. By contrast, the extracted autofluorescence spectra of purple phototrophic bacteria differed in pattern depending on bacteriochlorophyll type (a or b), suggesting that their autofluorescence originates from bacteriochlorophyll-related molecules. In addition, we revealed the pigment diversity in microbial cells on the leaf surface and isolated pigmented bacteria that could contribute to the pigment diversity of the environmental sample. Our study shows that Raman and fluorescence microspectroscopy is a useful tool for finding novel pigmented microbes and uncovering yet unknown relationships between microbes and light.IMPORTANCETo understand the activities of microbes in natural environments, it is important to know the types of biomolecules they express in situ. In this study, we report a method using resonance Raman and autofluorescence signatures to detect and distinguish the types of carotenoid and bacteriochlorophyll pigments in intact, living cells. We have shown that this method can be used to estimate the expression status and pigment types in purple phototrophic bacteria and carotenoid-producing bacteria as well as the diversity of the pigments expressed by microbes on the leaf surface. Our method requires little pretreatment and can analyze pigments without destroying cells, making it a useful tool for visualizing phototrophic activity and searching for unidentified microbes.
Keywords: Methylobacterium; aerobic anoxygenic phototrophic bacteria; autofluorescence; bacteriochlorophyll b; carotenoids; purple phototrophic bacteria; resonance Raman spectroscopy.
Conflict of interest statement
The authors declare no conflict of interest.
Figures
Similar articles
-
[Regulation mechanism of photopigments biosynthesis via light and oxygen in Rhodobacter azotoformans 134K20].Wei Sheng Wu Xue Bao. 2009 Mar;49(3):331-6. Wei Sheng Wu Xue Bao. 2009. PMID: 19623956 Chinese.
-
Biochemical characterization of Gram-positive and Gram-negative plant-associated bacteria with micro-Raman spectroscopy.Appl Spectrosc. 2010 Apr;64(4):433-41. doi: 10.1366/000370210791114293. Appl Spectrosc. 2010. PMID: 20412629
-
Fast outdoor screening and discrimination of carotenoids of halophilic microorganisms using miniaturized Raman spectrometers.Spectrochim Acta A Mol Biomol Spectrosc. 2022 Aug 5;276:121156. doi: 10.1016/j.saa.2022.121156. Epub 2022 Mar 18. Spectrochim Acta A Mol Biomol Spectrosc. 2022. PMID: 35390753
-
Raman spectroscopy of microbial pigments.Appl Environ Microbiol. 2014 Jun;80(11):3286-95. doi: 10.1128/AEM.00699-14. Epub 2014 Mar 28. Appl Environ Microbiol. 2014. PMID: 24682303 Free PMC article. Review.
-
Vibrational techniques applied to photosynthesis: Resonance Raman and fluorescence line-narrowing.Biochim Biophys Acta. 2015 Jan;1847(1):12-8. doi: 10.1016/j.bbabio.2014.09.009. Epub 2014 Sep 28. Biochim Biophys Acta. 2015. PMID: 25268562 Review.
References
-
- Venil CK, Dufossé L, Renuka Devi P. 2020. Bacterial pigments: sustainable compounds with market potential for pharma and food industry. Front Sustain Food Syst 4. doi:10.3389/fsufs.2020.00100 - DOI
-
- Martinez JN, Nishihara A, Lichtenberg M, Trampe E, Kawai S, Tank M, Kühl M, Hanada S, Thiel V. 2019. Vertical distribution and diversity of phototrophic bacteria within a hot spring microbial mat (Nakabusa Hot Springs, Japan). Microbes Environ 34:374–387. doi:10.1264/jsme2.ME19047 - DOI - PMC - PubMed
-
- Thiel V, Tank M, Neulinger SC, Gehrmann L, Dorador C, Imhoff JF. 2010. Unique communities of anoxygenic phototrophic bacteria in saline lakes of Salar de Atacama (Chile): evidence for a new phylogenetic lineage of phototrophic Gammaproteobacteria from pufLM gene analyses. FEMS Microbiol Ecol 74:510–522. doi:10.1111/j.1574-6941.2010.00966.x - DOI - PubMed
MeSH terms
Substances
Grants and funding
LinkOut - more resources
Full Text Sources
