. 2025 Dec;32(1):2490269.
doi: 10.1080/10717544.2025.2490269. Epub 2025 Apr 10.

Reliable high-PAP-1-loaded polymeric micelles for cancer therapy: preparation, characterization, and evaluation of anti-tumor efficacy

Affiliations

Reliable high-PAP-1-loaded polymeric micelles for cancer therapy: preparation, characterization, and evaluation of anti-tumor efficacy

Fang Ye et al. Drug Deliv. 2025 Dec.

Abstract

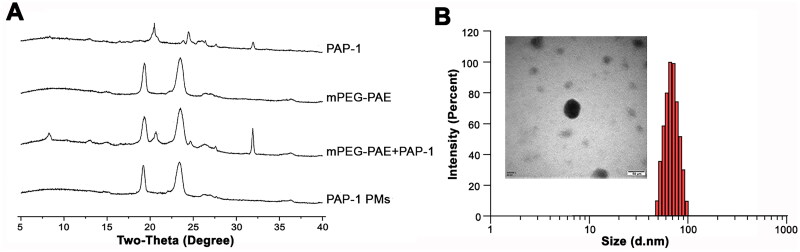
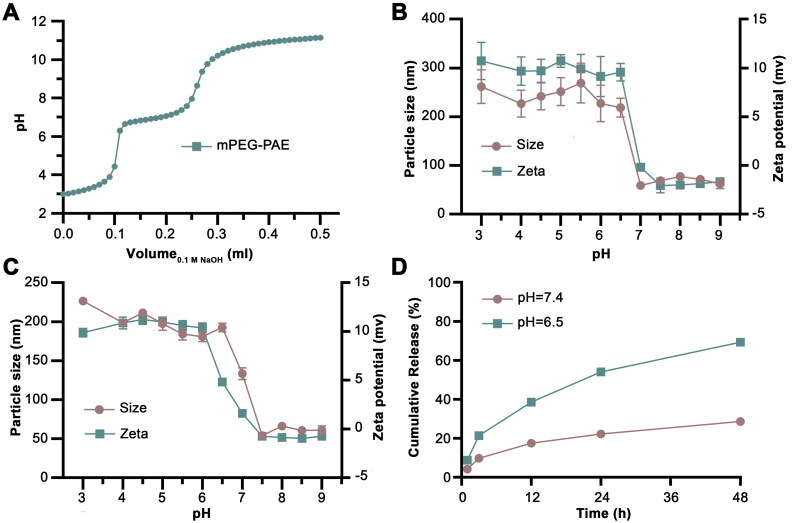
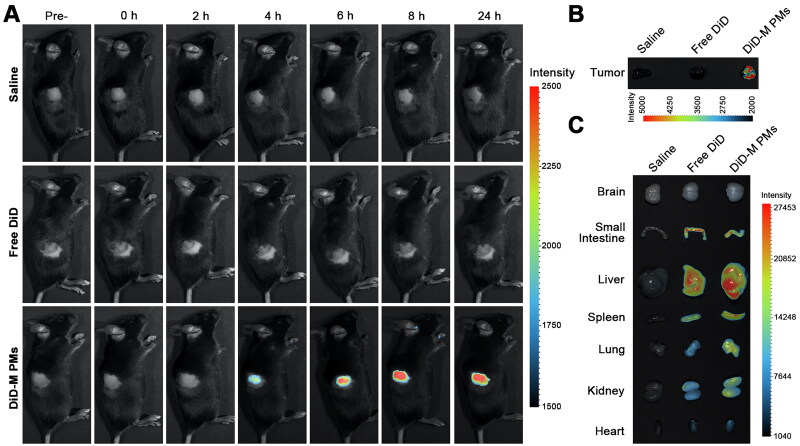
The mitochondrial potassium channel Kv1.3 is a critical therapeutic target, as its blockade induces cancer cell apoptosis, highlighting its therapeutic potential. PAP-1, a potent and selective membrane-permeant Kv1.3 inhibitor, faces solubility challenges affecting its bioavailability and antitumor efficacy. To circumvent these challenges, we developed a tumor-targeting drug delivery system by encapsulating PAP-1 within pH-responsive mPEG-PAE polymeric micelles. These self-assembled micelles exhibited high entrapment efficiency (91.35%) and drug loading level (8.30%). As pH decreased, the micelles exhibited a significant increase in particle size and zeta potential, accompanied by a surge in PAP-1 release. Molecular simulations revealed that PAE's tertiary amine protonation affected the self-assembly process, modifying hydrophobicity and resulting in larger, loosely packed particles. Furthermore, compared to free PAP-1 or PAP-1 combined with MDR inhibitors, PAP-1-loaded micelles significantly enhanced cytotoxicity and apoptosis induction in Jurkat and B16F10 cells, through mechanisms involving decreased mitochondrial membrane potential and elevated caspase-3 activity. In vivo, while free PAP-1 failed to reduce tumor size in a B16F10 melanoma mouse model, PAP-1-loaded micelles substantially suppressed tumors, reducing volume by up to 94.26%. Fluorescent-marked micelles effectively accumulated in mouse tumors, confirming their targeting efficiency. This strategy holds promise for significantly improving PAP-1's antitumor efficacy in tumor therapy.

Keywords: Mitochondrial potassium channel Kv1.3; PAP-1; anti-tumor; pH-responsive; polymeric micelles.


Conflict of interest statement

The authors declare that they have no known competing financial interests or personal relationships that could have appeared to influence the work reported in this paper.

Figures

Figure 1.
Figure 1.
The XRD spectrum, size distribution, and TEM image of PAP-1 PMs. (A). XRD patterns of PAP-1, blank mPEG-PAE micelles, physical mixture of mPEG-PAE + PAP-1, and PAP-1 PMs. (B). Size distribution and transmission electron microscopy micrograph of PAP-1-loaded PMs. Scale bar = 50 nm.
Figure 2.
Figure 2.
The pH responsiveness of the mPEG-PAE polymeric micelles. (A). The potentiometric titration of mPEG-PAE dependent on the different pH values. (B). Particle size and zeta potential of blank mPEG-PAE micelles. (C). Particle size and zeta potential of PAP-1 PMs. (D). In vitro release profiles of PAP-1 from PAP-1 PMs under pH conditions of 7.4 and 6.5.
Figure 3.
Figure 3.
The Assembly process of the PAP-1-loaded mPEG-PAE micelles, encompassing various protonation states of the PAE tertiary amine moieties: minimally protonated (designated as PAP-1 PMs-MinP), partially protonated (designated as PAP-1 PMs-PartP), and fully protonated (designated as PAP-1 PMs-FullP). (a). The images of the three nano assembly systems where PAP-1 and mPEG-PAE were simultaneously placed, with the PAE moieties of mPEG-PAE exhibiting three protonation states: fully protonated, partially protonated, and fully protonated. Each system was placed in an individual TIP3P water box. (B). The assembly process of PAP-1 and the various states of mPEG-PAE (the upper: minimal protonation; the Middle: partial protonation; the bottom: full protonation) observed over a time span of 0 to 100 ns. (C). RMSD. (D). SASA. (E). Radius of gyration.
Figure 4.
Figure 4.
Cytotoxic effect of various PAP-1 formulations on jurkat and B16F10 cells. Cell viability was measured by CCK-8 assay. (A). Cell viability assessment of jurkat cells treated by blank micelles (a), or free PAP-1, free PAP-1 combined with multidrug resistance pump inhibitors (MDRi), and PAP-1 PMs. Cells were treated for 24 hours with diverse PAP-1 formulations, ensuring final PAP-1 concentrations of 1, 10, 20, 30, 40, and 50 μmol/L. The MDRi solution was prepared with a concentration of 4 μmol/L CSH and 100 μmol/L prob. After incubating with CCK-8 solution for 3 hours, absorbance values at 450 nm were measured using a microplate reader to calculate cell viability. (B). B16F10 cells underwent the same treatments as jurkat cells for 24 hours. Data were expressed as mean ± standard deviation (n = 6). (*) p < 0.05, (**) p < 0.01, (***) p < 0.001.
Figure 5.
Figure 5.
Apoptotic-inducing effect of different PAP-1 formulations on jurkat cells and B16F10 cells. (A) Jurkat cell death was analyzed through FACS by employing double staining with Annexin V and PI, utilizing the identical treatments previously described for CCK-8 analysis on cells. Apoptotic cells were quantified by considering annexin-positive cells. (B). B16F10 cells underwent the identical treatments as jurkat cells, enduring the same conditions for 24 hours. (C) Representative scatter plots of jurkat cells (upper) and B16F10 cells (bottom) obtained through FACS analysis demonstrated the effects of various PAP-1 formulations at concentrations of 20 μmol/L and 50 μmol/L for the 24-hour treatment period. Cell death data were expressed as mean ± standard deviation (n = 4). (*) p < 0.05, (**) p < 0.01, (***) p < 0.001.
Figure 6.
Figure 6.
CLSM images of immunofluorescence, depicting caspase-3 activity and the effect apoptosis on jurkat cells exposed to various PAP-1 formulations at a concentration of 50 μmol/L for 24 hours. The cells were stained with GreenNuc caspase-3 and Annexin V-mCherry fluorescent probes. Images were captured using a laser confocal microscope (40×). The presence of red fluorescence from mCherry indicated cell apoptosis, while green fluorescence from GreenNuc signified increased caspase-3 activity in the cells.
Figure 7.
Figure 7.
Detection of JC-1 signals in jurkat cells, which were treated with diverse PAP-1 formulations at a concentration of 50 μmol/L for durations of 2 or 4 hours, subsequently stained with the JC-1 fluorescent probe. Images captured by a laser confocal microscope at 40× magnification revealed red fluorescence emitted by JC-1 aggregates, which denoted a high mitochondrial membrane potential, whereas green fluorescence originating from JC-1 monomers was indicative of a reduction in mitochondrial membrane potential.
Figure 8.
Figure 8.
Antitumor effects of diverse PAP-1 formulations in B16F10 melanoma mouse model. (A) Tumor growth curves of mice treated with different formulations. (B) Tumor burden. (C) Body weight changes. The data were presented as mean ± standard deviation, with a sample size of six (n = 6). Statistical significance was denoted as non-significant (n.s.) for p > 0.05, (*) p < 0.05, (**) p < 0.01, (***) p < 0.001. (D). Hematoxylin/eosin staining from the heart, liver, spleen, lung, kidney, small intestine, and brain in the groups treated by different PAP-1 formulations.
Figure 9.
Figure 9.
In Vivo DiD-marked micelles distribution in B16F10 melanoma tumor-bearing mouse models. (A) Representative photographs of live animals captured at pre-administration and at various time points post-administration (0, 2, 4, 6, 8, and 24 hours) for comparison. The images included the control group treated with saline, as well as groups receiving free DiD or DiD-marked micelles using IVIS®. (B). Ex vivo fluorescent images of the tumors and (C). main organs, including the brain, small intestine, liver, spleen, lung, kidney, and heart of mice after administration of PBS, free DiD, or DiD-marked micelles for 24 hours (n = 3).

Similar articles

References

    1. Abdul, M., and Hoosein, N., 2002. Voltage-gated potassium ion channels in colon cancer. Oncology reports, 9, 961–964. doi: 10.3892/or.9.5.961. - DOI - PubMed
    1. Abdul, M., Santo, A., and Hoosein, N., 2003. Activity of potassium channel-blockers in breast cancer. Anticancer research, 23 (4), 3347–3351. - PubMed
    1. Akhtar, N., et al. , 2011. The emerging role of P-glycoprotein inhibitors in drug delivery: a patent review. Expert opinion on therapeutic patents, 21 (4), 561–576. doi: 10.1517/13543776.2011.561784. - DOI - PubMed
    1. Artym, V.V., and Petty, H.R., 2002. Molecular proximity of Kv1.3 voltage-gated potassium channels and beta(1)-integrins on the plasma membrane of melanoma cells: effects of cell adherence and channel blockers. The journal of general physiology, 120 (1), 29–37. doi: 10.1085/jgp.20028607. - DOI - PMC - PubMed
    1. Bartok, A., et al. , 2014. Margatoxin is a non-selective inhibitor of human Kv1.3 K + channels. Toxicon: official journal of the international society on toxinology, 87, 6–16. doi: 10.1016/j.toxicon.2014.05.002. - DOI - PubMed

LinkOut - more resources