. 2025 Aug;122(2):206-216.
doi: 10.1007/s12185-025-03981-7. Epub 2025 Apr 10.

Synergistic effect of asciminib with reduced doses of ponatinib in human Ph + myeloid leukemia with the T315M mutation

Affiliations

Synergistic effect of asciminib with reduced doses of ponatinib in human Ph + myeloid leukemia with the T315M mutation

Thao Nguyen et al. Int J Hematol. 2025 Aug.

Abstract

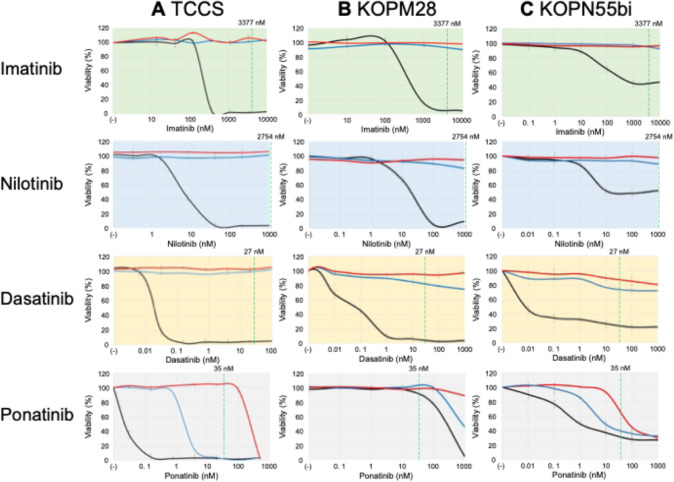
In Philadelphia chromosome-positive (Ph +) leukemia, substitution of threonine at the 315 position of BCR::ABL1 with isoleucine (T315I) induces severe resistance to tyrosine kinase inhibitors (TKIs). Of clinical importance, the substitution of the baseline T315I mutation by methionine (I315M) was reported in a Ph + leukemia patient treated with ponatinib. The resultant T315M mutation induces severe TKI-resistance in a murine Ba/F3 model. Asciminib, an allosteric inhibitor of BCR::ABL1, is reportedly active in ponatinib-resistant patients with the T315I mutation. Although asciminib alone is not active in a murine Ba/F3 model with the T315M mutation, asciminib and ponatinib show synergistic activities. In the present study, we introduced the T315M mutation into the intrinsic BCR::ABL1 gene of two Ph + myeloid and one Ph + lymphoid leukemia cell lines using the CRISPR/Cas9 system to directly verify the utility of the combined asciminib and ponatinib in human models. All three T315M-acquired sublines were more resistant to TKIs including ponatinib than T315I-acquired sublines. Notably, asciminib exhibited a stronger synergistic effect with reduced doses of ponatinib in the T315M-acquired sublines of two myeloid cell lines, but not in the lymphoid cell line. This indicates that the combination of ponatinib and asciminib may have a clinical utility in human Ph + myeloid leukemia.

Keywords: CRISPR/Cas9; Philadelphia chromosome-positive leukemia; Synergistic effect; T315M mutation; Tyrosine kinase inhibitor resistance.


Conflict of interest statement

Declarations. Conflict of interest: The authors declare no conflicts of interest.

Figures

Fig. 1
Fig. 1
Establishment of T315M-acquired sublines in three human Ph + leukemia cell lines. A Schematic diagram of the sgRNA and the ssODN. The top indicates wild-type amino acid and nucleotide sequences, the middle indicates the sequence of sgRNA, and the bottom indicates the sequence of ssODN. In the sgRNA sequence, the PAM site is indicated in bold green. The scissors icon and dotted line indicate the cleave site of Cas 9 nuclease. Codon 315 is highlighted in yellow. Four mutated nucleotides are indicated in bold. B Transfection and selection workflow. C Genomic sequencing of the PCR products of the three T315M-acquired sublines. Wild-type genomic sequences are indicated at the top, and mutated genomic sequences are indicated at the bottom
Fig. 2
Fig. 2
Dose–response curves of TKIs in A TCCS, B KOPM28, and C KOPN55bi. The black, blue, and red lines indicate dose–response curves in the parental cells, the T315I-acquired sublines, and the T315M-acquired sublines, respectively. The horizontal and vertical axes indicate the concentration of TKIs and viability, respectively. Error bars indicate standard errors in triplicated analyses. Green dotted line indicates average steady-state plasma concentration of each TKI
Fig. 3
Fig. 3
Western blot analysis of tyrosine phosphorylation in the parental cells, the T315I-acquired sublines, and the T315M-acquired sublines of A TCCS, B KOPM28, and C KOPN55bi. The cells were cultured in the absence or presence of imatinib at 1 µM, or ponatinib at 40 nM or 100 nM for 12 h. The top panels indicate the blots of anti-phospho-tyrosine antibody, and the bottom panels indicate the blots of anti-alpha Tubulin antibody as internal controls
Fig. 4
Fig. 4
Combination effects of asciminib and other TKIs in the T315M-acquired sublines of A TCCS, B KOPM28, and C KOPN55bi. The cells were treated with asciminib and each TKI as a single agent or in combinations at various concentrations. The left panels indicate the dose–response curves. The horizontal and vertical axes indicate the concentrations of asciminib and cell viabilities, respectively. Concentrations of each TKI are indicated on the right side of each dose-dependent curve. Error bars indicate standard errors in triplicated analyses. The right panels indicate heat maps of ZIP synergy scores. The horizontal and vertical axes indicate the concentrations of asciminib and each TKI. Color scales of the heat map are indicated on the right side of each map
Fig. 4
Fig. 4
Combination effects of asciminib and other TKIs in the T315M-acquired sublines of A TCCS, B KOPM28, and C KOPN55bi. The cells were treated with asciminib and each TKI as a single agent or in combinations at various concentrations. The left panels indicate the dose–response curves. The horizontal and vertical axes indicate the concentrations of asciminib and cell viabilities, respectively. Concentrations of each TKI are indicated on the right side of each dose-dependent curve. Error bars indicate standard errors in triplicated analyses. The right panels indicate heat maps of ZIP synergy scores. The horizontal and vertical axes indicate the concentrations of asciminib and each TKI. Color scales of the heat map are indicated on the right side of each map

References

    1. Apperley JF. Chronic myeloid leukemia. Lancet. 2015;385:1447–59. - PubMed
    1. Ravandi F. How I treat Philadelphia chromosome-positive acute lymphoblastic leukemia. Blood. 2019;133:130–6. - PMC - PubMed
    1. O’Hare T, Zabriskie MS, Eiring AM, Deininger MW. Pushing the limits of targeted therapy in chronic myeloid leukemia. Nat Rev Cancer. 2012;12:513–26. - PubMed
    1. Gorre ME, Mohammed M, Ellwood K, Hsu N, Paquette R, Rao PN, et al. Clinical resistance to STI-571 cancer therapy caused by BCR-ABL gene mutation or amplification. Science. 2001;293:876–80. - PubMed
    1. O’Hare T, Shakespeare WC, Zhu X, Eide CA, Rivera VM, Wang F, et al. AP24534, a pan-BCR-ABL inhibitor for chronic myeloid leukemia, potently inhibits the T315I mutant and overcomes mutation-based resistance. Cancer Cell. 2009;16:401–12. - PMC - PubMed

MeSH terms

Grants and funding

LinkOut - more resources