. 2025 Apr 10;21(4):e1013027.
doi: 10.1371/journal.ppat.1013027. eCollection 2025 Apr.

Efflux pumps and membrane permeability contribute to intrinsic antibiotic resistance in Mycobacterium abscessus

Affiliations

Efflux pumps and membrane permeability contribute to intrinsic antibiotic resistance in Mycobacterium abscessus

Kerry McGowen et al. PLoS Pathog. .

Abstract

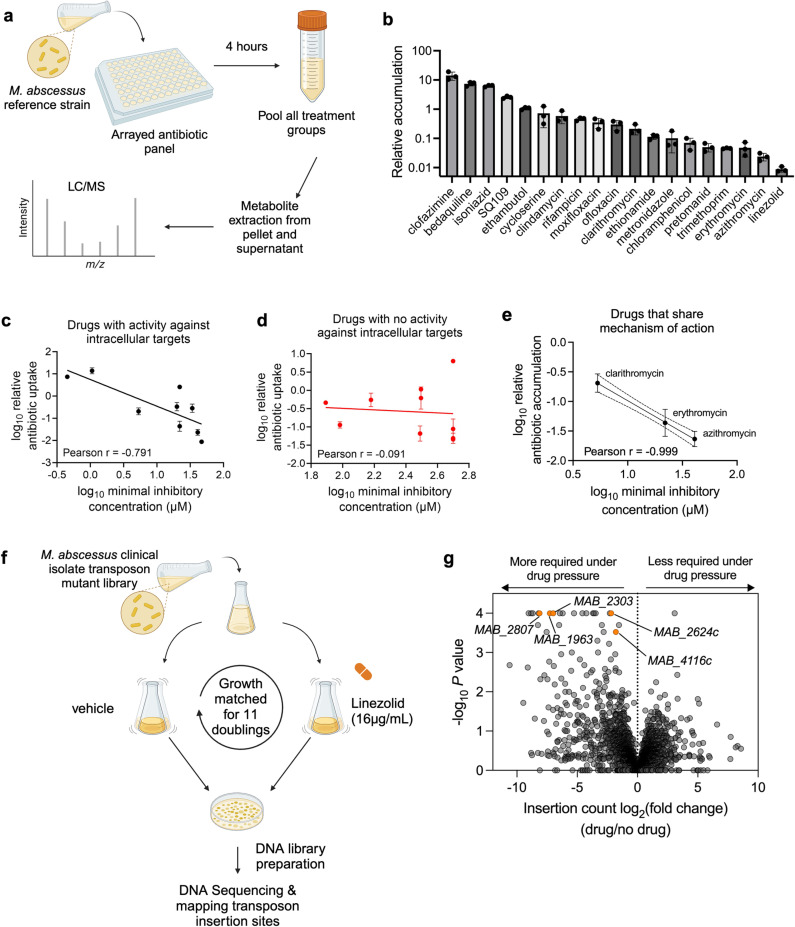
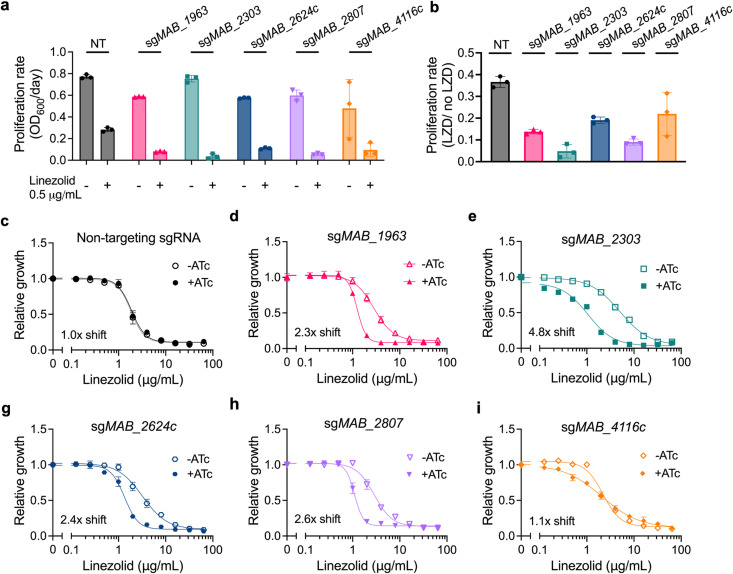
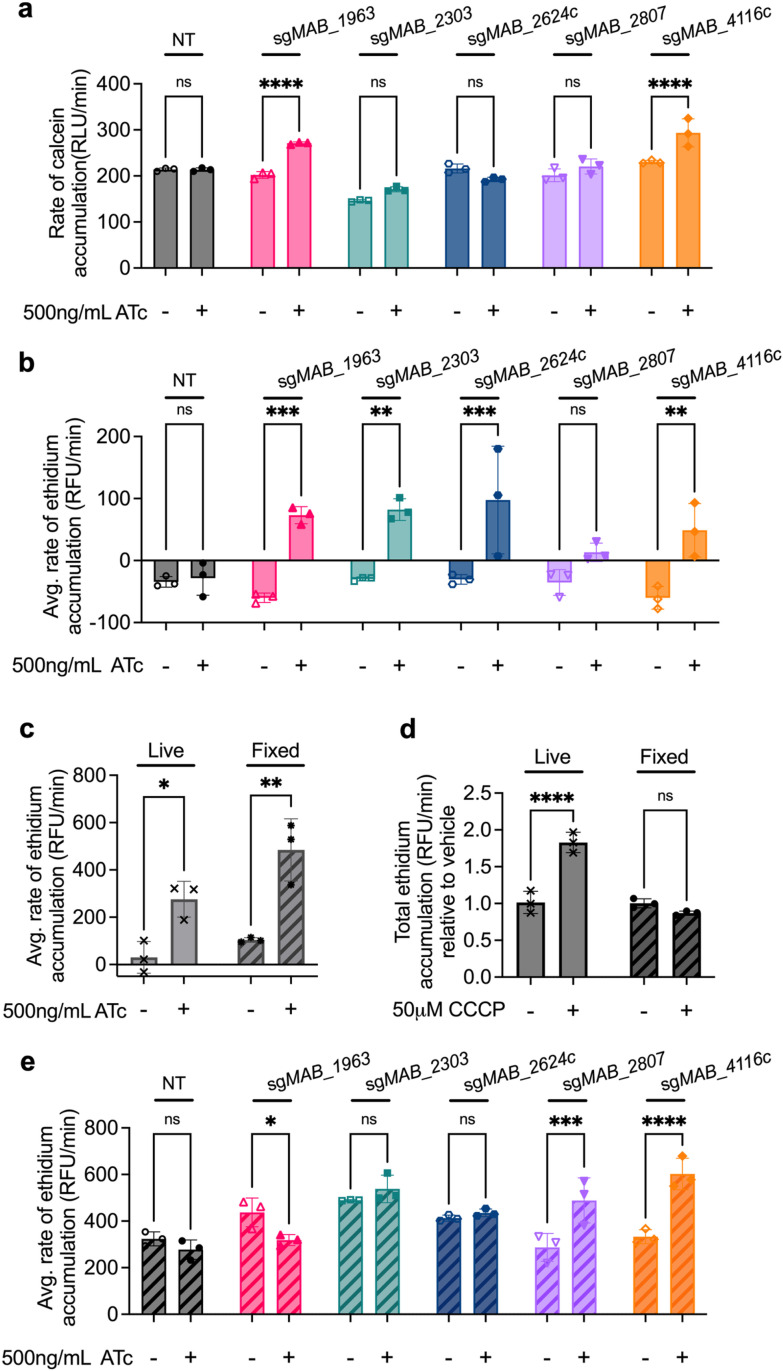
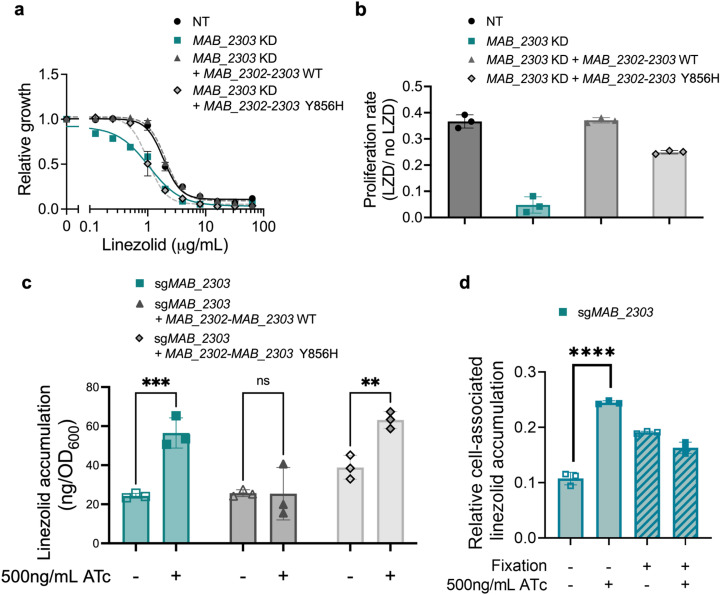
Mycobacterium abscessus is a pulmonary pathogen that exhibits intrinsic resistance to antibiotics, but the factors driving this resistance are incompletely understood. Insufficient intracellular drug accumulation could explain broad-spectrum resistance, but whether antibiotics fail to accumulate in M. abscessus and the mechanisms required for drug exclusion remain poorly understood. We measured antibiotic accumulation in M. abscessus using mass spectrometry and found a wide range of drug accumulation across clinically relevant antibiotics. Of these compounds, linezolid accumulates the least, suggesting that inadequate uptake impacts its efficacy. We utilized transposon mutagenesis screening to identify genes that cause linezolid resistance and found multiple transporters that promote membrane permeability or efflux, including an uncharacterized protein that effluxes linezolid and several chemically related antibiotics. This demonstrates that membrane permeability and drug efflux are critical mechanisms of antibiotic resistance in M. abscessus and suggests that targeting membrane transporters could potentiate the efficacy of certain antibiotics.


Conflict of interest statement

The authors have declared that no competing interests exist.

Figures

Fig 1
Fig 1. TnSeq reveals differential requirement of numerous membrane transporters with linezolid exposure.
a, Schematic of antibiotic accumulation assay. b, LC-MS measurement of relative accumulation of indicated mycobacterial antibiotics in M. abscessus ATC19977 reference strain. Values represent intracellular level of antibiotic after 4 hr incubation normalized to initial antibiotic levels in media prior to incubation. All values are normalized to internal standard and are represented as individual values along with mean ± s.d. n = 3 biological replicates. c, Historical half-maximal minimum inhibitory concentration (MIC50) values of antibiotics with known activity against intracellular enzymes in M. abscessus plotted against the relative antibiotic accumulation values as determined in (b). Each individual data point represents the mean relative accumulation +/- standard deviation for a unique antibiotic, with the x-value for each point determined from historical values. Pearson correlation coefficient (r) = -0.791, with p-value from a two-tailed test = 0.012. Spearman correlation coefficient = -0.803, with p-value from a two-tailed test = 0.011. d, Historical half-maximal minimum inhibitory concentration (MIC50) values of antibiotics with no known activity against intracellular enzymes in M. abscessus plotted against the relative antibiotic accumulation values as determined in (b). Each individual data point represents the mean relative accumulation +/- standard deviation for a unique antibiotic, with the x-value for each point determined from historical values. Pearson correlation coefficient (r) = -0.091, with p-value from a two-tailed test = 0.81. Spearman correlation coefficient = -0.195, with p-value from a two-tailed test = 0.59. e, Historical half-maximal minimum inhibitory concentration (MIC50) values of macrolides plotted against the relative antibiotic accumulation values as determined in (b). Pearson correlation coefficient (r) = -0.999, with a p-value from a two-tailed test = 0.011. Spearman correlation coefficient = -1.00, with p-value from a two-tailed test = 0.33. f, Schematic of TnSeq in M. abscessus clinical isolate upon linezolid exposure. g, log2-fold ratio of transposon insertion counts plotted against significance with linezolid treatment versus no drug. P values derived from two-sided permutation test and are displayed without multiple hypothesis correction. a, f Created with BioRender.com, released under a Creative Commons Attribution-NonCommercial-NoDerivs 4.0 International license.
Fig 2
Fig 2. Knockdown of membrane transporters increases sensitivity to linezolid.
a, Proliferation rates of M. abscessus ATCC19977 CRISPRi strains pre-depleted by treatment with 500 ng mL−1 ATc for 24 hours and then treated with 0.5 μg mL−1 linezolid or vehicle for 48 hours. Proliferation rates calculated from optical density of cultures over time. b, Ratio of proliferation rates of pre-depleted M. abscessus ATCC19977 CRISPRi strains treated with 0.5 μg mL−1 linezolid or vehicle along with ATc for 48 hours. Data are represented as individual values along with mean ± s.d. n = 3 biological replicates. c-i, Half-maximal minimum inhibitory concentration (MIC50) dose responses of pre-depleted M. abscessus ATCC19977 strains as measured by reduction of a colorimetric dye after treatment with indicated concentrations of linezolid along with ±500 ng mL−1 ATc for 24 hours. Values normalized to vehicle only control per strain. All data are represented as individual values along with mean ± s.d. n = 3 biological replicates. NT = non-targeting sgRNA. KD = knockdown. ATc = anhydrotetracycline. LZD = linezolid.
Fig 3
Fig 3. Membrane transporters disrupt general cell permeability or efflux.
a, Rate of calcein accumulation as measured by calcein fluorescence in CRISPRi strains pre-treated with 500ng mL−1 ATc for 24 hours prior to addition of calcein AM. Values normalized to vehicle only control per strain. b, Rate of ethidium accumulation as measured by fluorescence in live membrane transporter CRISPRi strains pre-treated with 500ng mL−1 ATc for 24 hours prior to addition of ethidium bromide in. c, Rate of ethidium accumulation as measured by fluorescence in strains pre-treated with 500ng mL−1 ATc for 24 hours prior to addition of ethidium bromide in live and fixed PBP-lipo CRISPRi strain. d, Rate of ethidium accumulation as measured by fluorescence in live and fixed M. abscessus ATC19977 wildtype treated with 50μM CCCP. e, Rate of ethidium accumulation as measured by fluorescence in live and fixed membrane transporter CRISPRi strains pre-treated with 500ng mL−1 ATc for 24 hours prior to addition of ethidium bromide. All values normalized to vehicle only control per strain. Data for all graphs are represented as individual values along with mean ± s.d. n = 3 biological replicates. Statistical significance was calculated with two-way ANOVA; *P < 0.05, **P < 0.01, ***P < 0.001, ****P < 0.0001. ns = not significant. NT = non-targeting sgRNA. ATc = anhydrotetracycline. CCCP = carbonyl-cyanide m-chlorophenylhydrazone.
Fig 4
Fig 4. MAB_2303 effluxes linezolid.
a, Half-maximal minimum inhibitory concentration (MIC50) dose responses of M. abscessus with non-targeting sgRNA (NT) or sgMAB_2303 complemented with either wildtype (WT) or mutant (Y856H) sgRNA-resistant MAB_2302-2303 treated with indicated concentrations of linezolid in the presence or absence of 500 ng mL−1 ATc for 48 hours. Values normalized to vehicle only control for each strain. b, Ratio of proliferation rates of pre-depleted MAB_2303 knockdown strains complemented with either wild type (WT) or mutant (Y856H) sgRNA-resistant MAB_2302-2303 treated with 0.5 μg mL−1 linezolid in the presence or absence of 500ng mL−1 ATc for 48 hours. Proliferation rates calculated from optical density of cultures over time. c, LC-MS measurement of cell-associated linezolid accumulation in pre-depleted MAB_2303 knockdown strains complemented with either wild type (WT) or mutant (Y856H) sgRNA-resistant MAB_2302-2303. Values are normalized to initial OD600 measurements. d, LC-MS measurement of cell-associated linezolid accumulation in paraformaldehyde-fixed (+ Fixation) versus unfixed (-Fixation) MAB_2303 knockdown strains pre-treated for 18 hr with 500ng mL−1 ATc (+ ATc) or with vehicle (-ATc) prior to fixation, then treated with 20 µM linezolid for 4 hr in the presence or absence of 500ng mL−1 ATc. Relative accumulation indicates the ratio of normalized peak area of cell-associated linezolid after 4 hr incubation to normalized peak area of linezolid in the initial culture medium. All data are represented as individual values along with mean ± s.d. n = 3 biological replicates. Statistical significance was calculated with a Student’s T-test; *P < 0.05, **P < 0.01, ***P < 0.001, ****P < 0.0001. ATc = anhydrotetracycline. NT = non-targeting sgRNA. KD = knockdown. LZD = linezolid.
Fig 5
Fig 5. MAB_2303 effluxes compounds that share similar chemical properties.
a-b, 529 antibiotics represented by (a) multidimensional scaling of atom pair similarity and (b) UMAP dimensional reduction of fragment-based similarity. Panel of mycobacterial antibiotics from Fig 1 are highlighted in orange and labeled. c, LC-MS measurement of intracellular accumulation of indicated antibiotics in pre-depleted (+ATc) sgMAB_2303 CRISPRi M. abscessus strain incubated for 4 hr with antibiotics. Values normalized to internal standard, initial antibiotic levels in media prior to incubation, and to a non-depleted strain control (-ATc). Data are represented as individual values along with mean ± s.d. n = 3 biological replicates. d-f, Half-maximal minimum inhibitory concentration (MIC50) dose responses of pre-depleted MAB_2303 knockdown strain as measured by reduction of a colorimetric dye after treatment with indicated concentrations of (d) chloramphenicol, (e) clarithromycin, and (f) rifampicin in the presence or absence of 500 ng mL−1 ATc for 24 hours. Values normalized to vehicle only control per drug. Data are represented as individual values along with mean ± s.d. n = 3 biological replicates. ATc = anhydrotetracycline.

Update of

Similar articles

Cited by

References

    1. Griffith DE, Aksamit T, Brown-Elliott BA, Catanzaro A, Daley C, Gordin F, et al.. An official ATS/IDSA statement: diagnosis, treatment, and prevention of nontuberculous mycobacterial diseases. Am J Respir Crit Care Med. 2007;175(4):367–416. doi: 10.1164/rccm.200604-571ST - DOI - PubMed
    1. Chen J, Zhao L, Mao Y, Ye M, Guo Q, Zhang Y, et al.. Clinical efficacy and adverse effects of antibiotics used to treat Mycobacterium abscessus pulmonary disease. Front Microbiol. 2019;10:1977. - PMC - PubMed
    1. Kwak N, Dalcolmo M, Daley C, Eather G, Gayoso R, Hasegawa N, et al.. Mycobacterium abscessus pulmonary disease: individual patient data meta-analysis. Eur Respir J. 2019;54(1):1900140. doi: 10.1183/13993003.00140-2019 - DOI - PubMed
    1. Nessar R, Cambau E, Reyrat J, Murray A, Gicquel B. Mycobacterium abscessus: a new antibiotic nightmare. J Antimicrob Chemother 2012;67(4):810–8. - PubMed
    1. Nash KA, Brown-Elliott BA, Wallace RJ Jr. A novel gene, erm(41), confers inducible macrolide resistance to clinical isolates of Mycobacterium abscessus but is absent from Mycobacterium chelonae. Antimicrob Agents Chemother. 2009;53(4):1367–76. doi: 10.1128/AAC.01275-08 - DOI - PMC - PubMed

MeSH terms