. 2025 Apr 10;23(4):e3003086.
doi: 10.1371/journal.pbio.3003086. eCollection 2025 Apr.

A nonenzymatic dependency on inositol-requiring enzyme 1 controls cancer cell cycle progression and tumor growth

Affiliations

A nonenzymatic dependency on inositol-requiring enzyme 1 controls cancer cell cycle progression and tumor growth

Iratxe Zuazo-Gaztelu et al. PLoS Biol. .

Abstract

Endoplasmic-reticulum resident inositol-requiring enzyme 1α (IRE1) supports protein homeostasis via its cytoplasmic kinase-RNase module. Known cancer dependency on IRE1 entails its enzymatic activation of the transcription factor XBP1s and of regulated RNA decay. We discovered surprisingly that some cancer cell lines require IRE1 but not its enzymatic activity. IRE1 knockdown but not enzymatic IRE1 inhibition or XBP1 disruption attenuated cell cycle progression and tumor growth. IRE1 silencing led to activation of TP53 and CDKN1A/p21 in conjunction with increased DNA damage and chromosome instability, while decreasing heterochromatin as well as DNA and histone H3K9me3 methylation. Immunoelectron microscopy detected some endogenous IRE1 protein at the nuclear envelope. Thus, cancer cells co-opt IRE1 either enzymatically or nonenzymatically, which has significant implications for IRE1's biological role and therapeutic targeting.


Conflict of interest statement

The authors have declared that no competing interests exist.

Figures
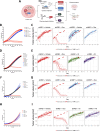
Fig 1
Fig 1. Growth of certain cancer cell lines requires IRE1 but not its enzymatic activity.
(A) Schematic of the characterization of IRE1 dependency in tumor cells using the genetic and pharmacologic disruption of IRE1 or its downstream target XBP1. Created in BioRender. Zuazo-Gaztelu, I. (2025) https://BioRender.com/x33w156. (B) Effect of IRE1 or XBP1 knockdown on in vitro proliferation of AMO1 cells. Cells were stably transfected with plasmids encoding doxycycline (Dox)-inducible short hairpin RNAs (shRNAs) (3 distinct shRNAs in tandem) against either IRE1 (red) or XBP1 (blue) and grown in the absence (closed symbols) or presence (open symbols) of Dox (0.2 μg/ml). Proliferation, depicted as % confluence, was monitored by time-lapse microscopy in an Incucyte instrument. Two independent clones (circles or squares) for each gene knockdown were characterized. Points are means of 15 technical replicates. Representative plot of three independent experiments shown. (C) Effect of IRE1 or XBP1 knockdown on in vivo growth of AMO1 tumor xenografts. C.B-17 SCID mice were implanted subcutaneously with 10 × 106 AMO1 shIRE1 cl.1 or shXBP1 cl.1 cells and allowed to form palpable tumors. Mice were then randomized into treatment groups (n = 10/group) and given either vehicle (5% sucrose) or Dox (0.5 mg/ml in 5% sucrose) in drinking water ad libitum. Tumor growth was monitored every 2–3 days until the last Vehicle-control animal reached endpoint (day 26). Thin lines represent individual mice, whereas thick lines represent group fit, corresponding to the mean growth of each group. The dashed red represents the reference fit of the vehicle group, embedded for comparison in all graphs. (D) Effect of IRE1 or XBP1 knockdown or enzymatic IRE1 inhibition on in vitro proliferation of AMO1 cells. Cells stably transfected with Dox-inducible shRNAs against non-targeting control (NTC, black) or IRE1 (red) or XBP1 (blue) were grown in the absence (closed symbols) or presence (open symbols) of Dox (0.2 μg/ml, circles), without or with IRE1 kinase inhibitor (KI, 3 μM, triangles) or RNase inhibitor (RI, 3 μM, asterisks). Proliferation was analyzed as in A. Data points are means of 5 technical replicates. Representative plot of three independent experiments shown. (E) Effect of IRE1 knockdown or enzymatic inhibition on in vivo growth of AMO1 tumor xenografts. C.B-17 SCID mice were implanted subcutaneously with 10 × 106 AMO1 shIRE1 cl.1 cells and allowed to form palpable tumors. Mice were then randomized into treatment groups (n = 10/group) and given either vehicle (5% sucrose) or Dox (0.5 mg/ml in 5% sucrose) ad libitum, or treated orally bidaily with either vehicle, or IRE1 KI (250 mg/kg) or IRE1 RI (100 mg/kg). Tumor growth was monitored until the last Vehicle-control animal reached endpoint (day 19) and plotted as in B. (F) Effect of IRE1 or XBP1 knockdown on in vitro proliferation of KMS27 cells. Cells stably transfected with plasmids encoding Dox-inducible shRNAs against either IRE1 (red) or XBP1 (blue) or NTC (black) were grown, treated, and analyzed as in A. One independent clone was characterized for each gene (cl.9 for shIRE1 and cl.13 for shXBP1). Data points are means of 15 technical replicates. Representative plot of three independent experiments shown. (G) Effect of IRE1 or XBP1 knockdown on in vivo growth of KMS27 tumor xenografts. C.B-17 SCID mice were implanted subcutaneously with 10 × 106 KMS27 shIRE1 cl.9 or shXBP1 cl.13 cells and allowed to form palpable tumors. Mice were then randomized, treated, and monitored as in B for 21 days. Tumor growth was plotted as in B. (H) Effect of IRE1 or XBP1 knockdown or enzymatic IRE1 inhibition on in vitro proliferation of KMS27 cells. Cells stably transfected with plasmids encoding Dox-inducible shRNAs against IRE1 (red) or XBP1 (blue) were grown in the absence (closed symbols) or presence (open symbols) of Dox (0.2 μg/ml, circles), without or with IRE1 KI (KI2, 3 μM, triangles). Proliferation was analyzed as in A. Data points are means of 6 technical replicates. Representative plot of three independent experiments shown. (I) Effect of IRE1 knockdown or enzymatic inhibition on in vivo growth of KMS27 tumor xenografts. C.B-17 SCID mice were implanted subcutaneously with 10 × 106 KMS27 shIRE1 cl.9 cells and allowed to form palpable tumors. Mice were then randomized, treated, and monitored as in D. Tumor growth was monitored during 12 days and plotted as in B. See also S1 Fig. All raw data can be found in S1 Data.
Fig 2
Fig 2. IRE1 depletion induces cell cycle arrest independently of apoptosis.
(A) AMO1 shIRE1 cl.1 (left) or shXBP1 cl.1 (center) cells were incubated in the absence (dark gray) or presence (light gray) of Dox (0.2 μg/ml) for 72 h. Cells were stained with propidium iodide (PI) and analyzed by flow cytometry to determine cell cycle phases by DNA content (see schematics on the right). Created in BioRender. Zuazo-Gaztelu, I. (2025) https://BioRender.com/u45y577. Sub-G1, G0/G1, S, and G2/M peaks are annotated for the shIRE1 histograms. Representative plot of three independent experiments shown. (B) AMO1 shIRE1 cl.1 or shXBP1 cl.1 cells were incubated with Dox (0.2 μg/ml) for the indicated time, analyzed as in A, and cell frequencies by cell cycle phase were depicted as stacked bar graphs. Representative plot of 3 independent experiments shown. (C) AMO1 shNTC, shIRE1 cl.1 or shXBP1 cl.1 were treated for 48 h with Dox (0.2 μg/ml), or with IRE1 kinase (KI) or RNase (RI) inhibitors at 3 μM. Cells were analyzed and as in A and results were graphed as in B. Representative plot of three independent experiments is shown. (D) Flow cytometry histograms representing AMO1 shIRE1 cell proliferation after 12 (left) or 48 (right) h culture in the presence or absence of Dox (0.2 μg/ml) measured by CFSE staining. Generations following cell division are color-coded and represented in the schematics on the right. Created in BioRender. Zuazo-Gaztelu, I. (2025) https://BioRender.com/a54m564. Representative plot of three independent experiments shown. (E) Validation of caspase activity and QVD-mediated inhibition. AMO1 shIRE1 cl.1 or shXBP1 cl.1 cells treated for the indicated time with Dox (0.2 μg/ml) and QVD (30 μM) and analyzed by IB. (F) AMO1 shIRE1 cl.1 cells were treated as in E, analyzed as in A, and graphed as in B. Representative plot of three independent experiments is shown. See also S2 Fig. All raw data can be found in S1 Data and the FCS files associated with the FACS experiments in https://zenodo.org/records/14928071.
Fig 3
Fig 3. IRE1 silencing downregulates cell cycle genes and engages TP53 and specific CDK inhibitors.
(A) Effect of IRE1 or XBP1 knockdown on mRNA expression of genes involved in Protein Processing in the ER or in cell cycle control. AMO1 shIRE1 cl.1 or cl.3 cells and shXBP1 cl.1 and cl.18 cells were incubated for the indicated time with Dox (0.2 μg/ml) in triplicates and subjected to bulk RNA sequencing. Shown are heat maps indicating scaled expression of distinctly regulated mRNAs encoded by KEGG pathway gene sets. (B) Effect of IRE1 or XBP1 knockdown on mRNA expression of genes involved in the S phase of the cell cycle, calculated as the S phase gene score. Score for samples in A shown. (C) Effect of IRE1 or XBP1 knockdown on mRNA expression of genes involved in the G2 and M phases of the cell cycle, calculated as the G2/M phase gene score. Score for samples in A shown. (D) RNAseq data for mRNAs specifically regulated upon IRE1 knockdown but not upon XBP1s at 24 h were queried by Gene Set Enrichment Analysis (GSEA). Enrichment plots from the most significantly downregulated Hallmark gene sets shown. (E) Enrichment plots as in D for Gene Ontology (GO) gene sets. (F) Effect of IRE1 vs. XBP1 knockdown on the proteome of AMO1 cells. AMO1 shIRE1 cl.1 or cl.3 cells and shXBP1 cl.1 and cl.18 cells were incubated for 24 h with Dox (0.2 μg/ml) in triplicates and analyzed for protein abundance by MS/MS. Depicted is a volcano plot showing estimated log2 fold change in protein abundance as a function of −log10 of the adjusted p value, comparing 24 h over 0 h for shIRE1 vs. shXBP1. Most significantly altered proteins implicated in cell cycle regulation are labeled. (G) Effect of IRE1 or XBP1 knockdown on CDKN1A/p21 mRNA (left) and protein (right) levels. Data depicted are from RNAseq and proteomics analyses described in A and F, respectively. Data points are mean ± SE for all biological and technical replicates normalized to t = 0 h for each cell line. (H) Effect of IRE1 or XBP1 knockdown on p53 and p21 protein levels. AMO1 shIRE1 cl.1 or shXBP1 cl.1 cells were incubated for the indicated time with Dox (0.2 μg/ml) and analyzed by IB. Representative blot of 3 independent experiments shown. (I) Effect of IRE1 knockdown on p53 and phospho-p53 (pP53) levels. AMO1 shIRE1 cl.1 cells were incubated for the indicated time in the absence or presence of Dox (0.2 μg/ml) and analyzed by IB. Representative blot of three independent experiments shown. (J) Effect of IRE1 or XBP1 knockdown on p53 and p21 mRNA levels. Cells as in I were analyzed by RT-qPCR. Data points are one biological replicate normalized to its untreated counterpart. Representative plot of three independent experiments shown. See also S3 Fig. All raw data can be found in S1 Data.
Fig 4
Fig 4. IRE1 depletion increases chromosome instability.
(A) Effect of IRE1 or XBP1 knockdown on frequency of micronuclei and mitotic events. AMO1 shIRE1 cl.1 and shXBP1 cl.1 were cultured in the presence or absence of Dox (0.2 μg/ml) for 24 h, stained with Hoechst DNA dye, and analyzed by fluorescence microscopy. Images representative of at least 10 fields examined per condition of three independent experiments. Blue circles indicate examples of cells with micronuclei, while red arrows indicate mitotic cells. A schematic of both is shown on the right. Created in BioRender. Zuazo-Gaztelu, I. (2025) https://BioRender.com/a54w687 Scale bar = 20 μm. (B) Quantification of annotated events in A normalized per total amount of cells per field. Ten fields per condition with at least 100 cells were counted for n = 3 independent experiments. Mean ± SEM of the fold change to untreated controls for each cell line. Mann–Whitney U statistical test. (C) Quantification of mitotic cells exemplified in A per total amount of cells per field. Ten fields per condition with at least 100 cells were counted for three independent experiments. Mean ± SEM of the fold change to untreated controls for each cell line. Mann–Whitney U statistical test. (D) Effect of IRE1 knockdown on chromosome numbers. AMO1 shIRE1 cl.1 cells were incubated for the indicated time with Dox (0.2 μg/ml) or with RI (3 μM) and metaphase spreads were prepared and quantified for chromosome count. Each datapoint indicates one metaphase spread. Mean ± SEM for three independent experiments. Kruskal-Wallis with Dunn’s multiple comparisons statistical test. (E) Effect of IRE1 or XBP1 knockdown on DNA content. AMO1 shIRE1 cl.1 and shXBP1 cl.1 were treated for 24 h with QVD (30 μM) in the presence or absence of Dox (0.2 μg/ml) or RI (3 μM), stained with the DNA dye Hoechst, and analyzed by flow cytometry. Fold change to untreated controls of the DNA content per total amount of live cells is depicted. Mean ± SEM for five independent experiments for shIRE1 and three for shXBP1. Mann–Whitney U statistical test. *p < 0.05; **p < 0.005; ***p < 0.001; ****p < 0.00001 consensus. A p value > 0.05 was considered non-significant (ns). See also S4 Fig. All raw data can be found in S1 Data.
Fig 5
Fig 5. IRE1 depletion decreases heterochromatin, DNA and H3K9me3 methylation, and UHRF1.
(A) Effect of IRE1 or XBP1 knockdown on heterochromatin density. AMO1 shIRE1 cl.1 and shXBP1 cl.1 cells were incubated for 24 h with Dox (0.2 μg/ml). Cells were then analyzed by electron microscopy (EM). Images depict 6000X magnification. Representative heterochromatin, euchromatin, and nucleoli are indicated in top-left image. (B) AMO1 cells as in A were analyzed by EM to determine the frequency of nuclei with electron-dense heterochromatin (HC, left) or dispersed euchromatin (EC, right) per total nucleated cell count. For each sample, four fields were analyzed at 1000× magnification with approximately 30 cells per field. Mean ± SEM. Mann–Whitney U statistical test. (C) Effect of IRE1 knockdown on DNA methylation. AMO1 shIRE1 cl.1 and shXBP1 cl.1 were cultured in the presence or absence of Dox (0.2 μg/ml) for 24 h and gDNA was extracted. Global DNA methylation levels were quantified by 5-methylcytosine (5-mc) ELISA, normalized by gDNA amount, and shown as fold change to the untreated control. Mean ± SEM for four independent experiments for shIRE1 and 3 for shXBP1. Mann–Whitney U statistical test. *p < 0.05. A p value > 0.05 was considered non-significant (ns). (D) Effect of IRE1 knockdown on H3K9 trimethylation. AMO1 shIRE1 cl.1 cells were incubated for 24 h in the absence (closed symbols) or presence (open symbols) of Dox (0.2 μg/ml) with the indicated concentration of 5-azacytidine (5-aza). H3K9me3 levels were quantified by IB against H3K9me3 as compared to total H3 levels (IB images are shown in S6C Fig; the 5-aza concentrations of 0, 3, and 10 μM are depicted in the graph). (E) Effect of IRE1 knockdown and 5-aza treatment on proliferation. AMO1 shIRE1 cl.1 cells were incubated for the indicated time in the absence (closed symbols) or presence (open symbols) of Dox (0.2 μg/ml), without (circles) or with (triangles) 5-aza (1 μM). Data points represent the means of five technical replicates. Representative plot of three independent experiments shown. (F) Effect of IRE1 or XBP1 knockdown on UHRF1 mRNA (left) and protein (right) levels. Data depicted are from RNAseq and proteomics analyses described in Fig 3A and 3F, respectively. Mean ± SE for all biological and technical replicates normalized to t = 0 h for each cell line. (B) Effect of IRE1 knockdown on UHRF1 protein levels. AMO1 shIRE1 cl.1 and KMS27 shIRE1 cl.9 cells were incubated for the indicated time with Dox (0.2 μg/ml) and analyzed by IB. Representative blots of three independent experiments. See also S5 Fig. All raw data can be found in S1 Data.
Fig 6
Fig 6. IRE1 depletion downregulates multiple cell cycle proteins in synchronized cells.
(A) Effect of IRE1 knockdown during G1 synchronization on cell cycle progression. Stacked bar graphs showing cell frequencies by cell cycle phase for AMO1 shIRE1 cl.1 cells incubated with CDK4/6 inhibitor (1 μM) for 24 h in the absence or presence of Dox (0.2 μg/ml). Cells were washed to resume cycling in the absence or presence of Dox and at the indicated time points stained with PI and analyzed by flow cytometry to determine cell cycle phases by DNA content. Mitosis (M) was distinguished from G2 by phospho-H3 staining. Representative plot of 3 independent experiments shown. (B) Effect of IRE1 knockdown during G1 synchronization on the abundance of cell cycle proteins. AMO1 shIRE1 cl.1 cells were synchronized as in A in the absence or presence of Dox (0.2 μg/ml), washed to resume cycling in the absence or presence of Dox, and analyzed at the indicated time points by IB. Representative blot of 3 independent experiments shown. (C) Effect of IRE1 knockdown during late G2 synchronization on cell cycle progression. AMO1 shIRE1 cl.1 cells were incubated with CDK1 inhibitor (9 μM) for 20 h in the absence or presence of Dox (0.2 μg/ml). Cells were washed to resume cycling in the absence or presence of Dox and at the indicated time points stained and anlyzed as in A. Representative plot of 3 independent experiments shown. (D) Effect of IRE1 knockdown during late G2 synchronization on abundance of cell cycle proteins. AMO1 shIRE1 cl.1 cells were synchronized as in C in the absence or presence of Dox (0.2 μg/ml), washed to resume cycling in the absence or presence of Dox and analyzed at the indicated time points by IB. Representative blot of three independent experiments shown. See also S6 Fig. All raw data can be found in S1 Data.
Fig 7
Fig 7. Endogenous IRE1 protein can localize to the nuclear envelope.
(A) AMO1 cells were subjected to subcellular fractionation and analyzed by IB. WCL, whole-cell lysate. WCL-Nuc: Whole-cell lysate lacking the nuclear fraction. Nuc, nuclear fraction. The nuclear protein Lamin B1 and the Golgi marker 58K were used to confirm the purity of the nuclear fraction. (B) Detection of endogenous Halo-tagged IRE1 and non-tagged Lamin B1 by confocal microscopy. U2OS HaloTag cells, containing a C-terminal HaloTag into the endogenous IRE1 gene locus [9], were examined. Cells were cultured in the presence of Janelia 646 HaloTag ligand (green), fixed, stained with anti-Lamin-B1 (red) antibodies, and analyzed by confocal microscopy. Left: Merge field of IRE1 (red), Lamin B1 (green), and nucleus (blue) is shown. Scale bar = 5 μm. Right: Close up of the nuclear envelope where each channel is shown separately and merged. Scale bar = 2 μm. Pixel size = 48 nm. Representative image of two independent experiments shown. (C) Immuno-EM analysis of Halo-tagged endogenous IRE1 in AMO1 cells. A C-terminal HaloTag was inserted into the endogenous IRE1 gene locus in AMO1 cells as previously described [9]. Cells were fixed, stained with anti-HaloTag and protein-A-Gold 10 nm conjugate (protein-A-Gold10), and analyzed by EM. Arrowheads and arrows indicate gold particles detected in association with ER membranes or nuclear envelope membranes, respectively. N = nucleus. Images from two different cells are shown. See also S7 Fig.

References

    1. Walter P, Ron D. The unfolded protein response: from stress pathway to homeostatic regulation. Science. 2011;334(6059):1081–6. doi: 10.1126/science.1209038 - DOI - PubMed
    1. Hetz C, Chevet E, Oakes SA. Proteostasis control by the unfolded protein response. Nat Cell Biol. 2015;17(7):829–38.doi: 10.1038/ncb3184 - DOI - PMC - PubMed
    1. Wang M, Kaufman RJ. Protein misfolding in the endoplasmic reticulum as a conduit to human disease. Nature. 2016;529(7586):326–35. doi: 10.1038/nature17041 - DOI - PubMed
    1. Acosta-Alvear D, Harnoss JM, Walter P, Ashkenazi A. Homeostasis control in health and disease by the unfolded protein response. Nat Rev Mol Cell Biol. 2025;26(3):193–212. doi: 10.1038/s41580-024-00794-0 - DOI - PubMed
    1. Lee KPK, Dey M, Neculai D, Cao C, Dever TE, Sicheri F. Structure of the dual enzyme Ire1 reveals the basis for catalysis and regulation in nonconventional RNA splicing. Cell. 2008;132(1):89–100.doi: 10.1016/j.cell.2007.10.057 - DOI - PMC - PubMed