. 2025 Apr 15;122(15):e2419468122.
doi: 10.1073/pnas.2419468122. Epub 2025 Apr 10.

Arf1 and ARFGEF2/Sec71 control neuroblast polarity by anchoring nonmuscle myosin II

Affiliations

Arf1 and ARFGEF2/Sec71 control neuroblast polarity by anchoring nonmuscle myosin II

Mahekta R Gujar et al. Proc Natl Acad Sci U S A. .

Abstract

Neural stem cells (NSCs) can self-renew and undergo differentiation via asymmetric division. Dysregulation in the balance between self-renewal and differentiation can lead to tumor formation or neurodevelopmental disorders. However, the regulation of phosphatidylinositol transfer protein (PITP)-dependent PI(4)P pools and myosin localization during asymmetric division in dividing cells is not well established. Here, we show that the Golgi proteins Arf1 and ARFGEF2/Sec71 control asymmetric division of Drosophila NSCs by facilitating the localization of myosin II regulatory light chain, Sqh, to the NSC cortex. Arf1 can physically associate with Sqh and Vibrator, a type I PITP that stimulates phospholipid PI4K activity for PI(4)P production. Further, Arf1 and Sec71 facilitate PI(4)P localization to the cell cortex of neuroblasts. Our data provide evidence that the Golgi proteins Arf1 and its GEF Sec71 facilitate neuroblast polarity through phospholipid-dependent nonmuscle myosin II cortical localization.

Keywords: Drosophila; Golgi; asymmetric cell division; nonmuscle myosin II; phosphatidylinositol lipids.


Conflict of interest statement

Competing interests statement:The authors declare no competing interest.

Figures

Fig. 1.
Fig. 1.
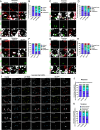
Arf1 and Sec71 are required for asymmetric protein localization in neuroblasts. (A) Metaphase neuroblasts of control, UAS-arf1 RNAi, and UAS-sec71 RNAi. (A′) Quantification of aPKC localization in metaphase neuroblasts for (A). Control, Strong crescent = 100%, n = 56; arf1 RNAi, Strong crescent = 41%, Weak crescent = 33.4%, Absent = 17.9%, Cytoplasmic = 7.7%, n = 40; sec71 RNAi, Strong crescent = 50%, Weak crescent = 31.4%, Absent = 8.8%, Cytoplasmic = 7.1%, Cortical = 2.7%, n = 70. (B) Metaphase neuroblasts of control, UAS-Arf1T31N, and UAS-Sec71DN. (B′) Quantification of aPKC localization in metaphase neuroblasts for (B). Control, Strong crescent = 100%, n = 45; Arf1T31N, Strong crescent = 53.4%, Weak crescent = 31.1%, Absent = 2.2%, Cytoplasmic = 13.3%, n = 45; Sec71DN, Strong crescent = 30.2%, Weak crescent = 39.5%, Absent = 11.6%, Cytoplasmic = 14%, Cortical = 4.7%, n = 43. (C) Metaphase neuroblasts of control, UAS-arf1 RNAi, and UAS-sec71 RNAi. (C′) Quantification of Mira localization in metaphase neuroblasts for (C). Control, Strong crescent=100%, n = 56; arf1 RNAi, Strong crescent = 33.3%, Weak crescent = 41%, Absent = 7.7%, Cytoplasmic = 10.3%, Cortical = 7.7%, n = 40; sec71 RNAi, Strong crescent = 30%, Weak crescent = 40%, Absent = 20%, Cytoplasmic = 4.3%, Basal + Lateral = 5.7%, n = 70. (D) Metaphase neuroblasts of control, UAS-Arf1T31N, and UAS-Sec71DN. (D′) Quantification of Mira localization in metaphase neuroblasts for (D). Control, Strong crescent = 100%, n = 45; Arf1T31N, Strong crescent = 40%, Weak crescent = 33.3%, Absent = 26.7%, n = 45; Sec71DN, Strong crescent = 34.8%, Weak crescent = 28%, Absent = 18.6%, Cytoplasmic = 18.6%, n = 43. (E) Metaphase neuroblasts of control and UAS-arf1 RNAi. (E′) Quantification of Baz localization in metaphase neuroblasts for (E). Control, Strong crescent = 100%, n = 53; arf1 RNAi, Strong crescent = 41.7%, Weak crescent = 31.3%, Absent = 20.8%, Apical+Lateral = 6.2%, n = 48. (F) Metaphase neuroblasts of control and UAS-arf1 RNAi. (F′) Quantification of Par6 localization in metaphase neuroblasts for (F). Control, Strong crescent = 100%, n = 42; arf1 RNAi, Strong crescent = 51.2%, Weak crescent = 26.8%, Absent = 2.5%, Cytoplasmic = 19.5%, n = 41. (G) Metaphase neuroblasts of control and UAS-arf1 RNAi. (G′) Quantification of Gαi localization in metaphase neuroblasts for (G). Control, Strong crescent = 100%, n = 32; arf1 RNAi, Strong crescent = 52.8%, Weak crescent = 30.6%, Absent = 5.5%, Cytoplasmic = 11.1%, n = 36. (H) Metaphase neuroblasts of Control and UAS-Sec71DN. (H′) Quantification of Baz localization in metaphase neuroblasts for (H). Control, Strong crescent = 100%, n = 41; Sec71DN, Strong crescent = 42.2%, Weak crescent = 35.6%, Absent = 22.2%, n = 45. (I) Metaphase neuroblasts of control and UAS-Sec71DN driven by insc-Gal4, tub -Gal80ts were labeled with Par6 (red) and DNA (gray). (I′) Quantification of Par6 localization in metaphase neuroblasts for (I). Control, Strong crescent = 100%, n = 31; Sec71DN, Strong crescent = 47.3%, Weak crescent = 23.7%, Absent = 7.9%, Cytoplasmic = 21.1%, n = 38. (J) Metaphase neuroblasts of control and UAS-Sec71DN. (J′) Quantification of Gαi localization in metaphase neuroblasts for (J). Control, Strong crescent = 100%, n = 32; Sec71DN, Strong crescent=51.3%, Weak crescent = 25.6%, Disorganized = 7.7%, Cytoplasmic = 15.4%, n = 39. (K) Metaphase neuroblasts of control and UAS-arf1 RNAi. (K′) Quantification of Insc localization in metaphase neuroblasts for (K). Control, Strong crescent = 100%, n = 35; arf1 RNAi, Strong crescent = 52.4%, Weak crescent = 21.4%, Absent = 9.5%, Cytoplasmic = 16.7%, n = 42. (L) Metaphase neuroblasts of control and UAS-arf1 RNAi. (L′) Quantification of Numb localization in metaphase neuroblasts for (L). Control, Strong crescent = 100%, n = 32; arf1 RNAi, Strong crescent = 40.7%, Weak crescent = 28.1%, Absent = 15.6%, Cytoplasmic = 15.6%, n = 32. (M) Metaphase neuroblasts of control and UAS-Sec71DN. (M′) Quantification of Insc localization in metaphase neuroblasts for (M). Control, Strong crescent = 100%, n = 30; Sec71DN, Strong crescent = 52.6%, Weak crescent = 18.4%, Absent = 13.2%, Cytoplasmic = 15.8%, n = 38. (N) Metaphase neuroblasts of control and UAS-Sec71DN. (N′) Quantification of Numb localization in metaphase neuroblasts for (N). Control, Strong crescent = 100%, n = 25; Sec71DN, Strong crescent = 33.3%, Weak crescent = 26.7%, Absent = 13.3%, Cytoplasmic = 23.3%, Basal+Lateral = 3.3%, n = 30. Knockdown of arf1 and sec71 RNAi driven by insc-Gal4. Overexpression of Arf1T31N and Sec71DN driven by insc-Gal4, tub-Gal80ts. The means of analyzed phenotypes are shown within each column. (Scale bars, 5 µm.)
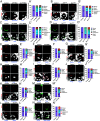
Fig. 2.
Fig. 2.
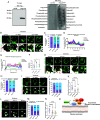
Nonmuscle myosin II localization is disrupted in loss of arf1 and sec71 neuroblasts. (A) Metaphase neuroblasts of control, UAS-arf1 RNAi, and UAS-sec71 RNAi. (B) Quantification graph of genotypes in (A). Control, Cortical = 91.8%, Weak cortical = 8.2%, n = 49; arf1 RNAi, Cortical = 35.6%, Weak cortical = 40%, Absent = 24.4%, n = 45; sec71 RNAi, Cortical = 30%, Weak cortical = 32%, Absent = 34%, Cytoplasmic = 4%, n = 50. (C) Telophase neuroblasts of control, UAS-arf1 RNAi, and UAS-sec71 RNAi. (D) Quantification graph of genotypes in (C). Control, CF = 90.7%, Weak = 9.3%, n = 43; arf1 RNAi, CF = 45.2%, Weak = 31%, Absent = 23.8%, n = 42; sec71 RNAi, CF = 36.8%, Weak = 27.3%, Absent = 20.5%, Cytoplasmic = 5.9%, n = 44. (E) Metaphase neuroblasts of control, UAS-Arf1T31N, and UAS-Sec71DN. (F) Quantification graph of genotypes in (E). Control, Cortical = 93.5%, Weak cortical = 6.5%, n = 46; Arf1T31N, Cortical = 25%, Weak cortical = 47.7%, Absent = 9.1%, Cytoplasmic = 18.2%, n = 44; Sec71DN, Cortical = 29.7%, Weak cortical = 31.7%, Absent = 38.6%, n = 41. (G) Telophase neuroblasts of control, UAS-Arf1T31N, and UAS-Sec71DN. (H) Quantification graph of genotypes in (G). Control, CF = 95.5%, Weak = 4.5%, n = 44; Arf1T31N, CF = 33.3%, Weak = 28.2%, Absent = 20.5%, Cytoplasmic = 18%, n = 39; Sec71DN, CF = 22.5%, Weak = 25%, Absent = 37.5%, Cytoplasmic = 15%, n = 40. (I) Time series of a neuroblast in ex vivo larval brain at 48 ALH labeled by insc-Gal4; Sqh-GFP in control, arf1 RNAi, and Sec71DN. Orange arrow heads point to strong localization of endogenous Sqh during division. Blue arrow heads point to cytoplasmic localization of endogenous Sqh during neuroblast division. Yellow arrowheads point to weak endogenous Sqh localization during neuroblast division. (J) Quantification of the percentage of metaphase neuroblast with cortical Sqh localization in (I). Control, Cortical = 100%, n = 24; arf1 RNAi, Strong cortical = 50%, Weak cortical = 30%, Cytoplasmic = 20%, n = 20; Sec71DN, Strong cortical = 54.2%, Weak cortical = 29.2%, Cytoplasmic = 16.6%, n = 24. (K) Quantification of the percentage of telophase neuroblast with Sqh localization at the CF in (I). Control, Strong enrichment = 100%, n = 24; arf1 RNAi, Strong enrichment = 60%, Weak = 30%, No enrichment = 10%, n = 20; Sec71DN, Strong enrichment = 58.3%, Weak = 29.2%, No enrichment = 12.5%, n = 24. For A, C, E, and G; Panels 1 and 2, show Sqh localization and panels 3 and 4 show Mira localization. AD Knockdown of arf1 and sec71 RNAi driven by insc-Gal4. EH Overexpression of Arf1T31N and Sec71DN driven by insc-Gal4, tub-Gal80ts. The means of analyzed phenotypes are shown within each column. (Scale bars, 5 µm for A, C, E, and G and 10 µm for I.)
Fig. 3.
Fig. 3.
Arf1 physically associates with Sqh in larval brain neuroblasts. (A) In vitro BiFC assay between Sqh and various forms of Arf1 (WT, Q71L, and T31N). S2 cells that were triple transfected with actin-Gal4, UAS-CYFP-HA-Sqh (or UAS-CYFP-HA as a control), and UAS-NYFP-Myc-Arf1 (or UAS-NYFP-Myc-Arf1Q71L or UAS-NYFP-Myc-Arf1T31N or UAS-NYFP-Myc as a control). Cell outlines were observed using differential interference contrast (DIC) imaging. (B) Quantification graph of the average pixel intensity of YFP (A.U.) in S2 cells for (A). NYFP-Myc and CYFP-HA, 0.003, n = 106; NYFP-Myc and CYFP-HA-Sqh, 0.009, n = 102; NYFP-Myc-Arf1WT and CYFP-HA, 0.01, n = 81; NYFP-Myc-Arf1WT and CYFP-HA-Sqh, 4.5, n = 88; NYFP-Myc-Arf1T31N and CYFP-HA, 0.01, n = 111; NYFP-Myc-Arf1T31N and CYFP-HA-Sqh; 3.8, n = 92; NYFP-Myc-Arf1Q71L and CYFP-HA, 0.004, n = 103, and NYFP-Myc-Arf1Q71L and CYFP-HA-Sqh, 0.007, n = 56. (C) In vivo BiFC assay between Sqh and various forms of Arf1 (WT, Q71L, and T31N). UAS-CYFP-HA-Sqh and UAS-NYFP-Myc-Arf1, UAS-NYFP-Myc-Arf1Q71L or UAS-NYFP-Myc-Arf1T31N were coexpressed in neuroblasts by insc-Gal4. Controls were NYFP-Myc-Arf1/ NYFP-Myc -Arf1Q71L or UAS-NYFP-Myc-Arf1T31N with CYFP-HA control and CYFP-HA-Sqh with NYFP-Myc control. (D) Quantification graph of the average pixel intensity of YFP (A.U.) in neuroblasts for (C). NYFP-Myc and CYFP-HA, 0.18, n = 26 metaphase neuroblasts; NYFP-Myc and CYFP-HA-Sqh, 3.1, n = 26 metaphase neuroblasts; NYFP-Myc-Arf1WT and CYFP-HA, 1.05, n = 23 metaphase neuroblasts; NYFP-Myc-Arf1WT and CYFP-HA-Sqh, 31.4, n = 31 interphase neuroblasts; 34.6, n = 21 metaphase neuroblasts; 33.8, n = 14 telophase neuroblasts; NYFP-Myc-Arf1T31N and CYFP-HA, 2.7, n = 21 metaphase neuroblasts; NYFP-Myc-Arf1T31N and CYFP-HA-Sqh; 25.6, n = 30 interphase neuroblasts; 29.9, n = 21 metaphase neuroblasts; 34.4; n = 16 telophase neuroblasts; NYFP-Myc-Arf1Q71L and CYFP-HA, 1.7, n = 24 metaphase neuroblasts; and NYFP-Myc-Arf1Q71L and CYFP-HA-Sqh, 1.1, n = 33 interphase neuroblasts; 1.1, n = 25 metaphase neuroblasts; 1.2, n = 11 telophase neuroblasts. The means of analyzed phenotypes are shown above each column (with SD). Statistical significances were determined by one-way ANOVA. ****P =0.0001, ns; nonsignificant. (Scale bars, 5 µm.)
Fig. 4.
Fig. 4.
Arf1 facilitates the localization of phosphoinositide PI(4)P to cell cortex in neuroblasts. (A) Western Blot (Left) and lipid binding assay (Right) for Control (empty Flag vector) and Flag-Arf1 lysates from S2 cells. (B) Interphase neuroblasts of control, UAS-arf1 RNAi, and UAS-sec71 RNAi. (C) Quantification graph of genotypes in (B). Control, Cortical = 100%, n = 50; arf1 RNAi, Cortical = 30%, Membrane aggregates = 26%, Cytoplasmic aggregates = 44%%, n = 50; sec71 RNAi, Cortical = 36.7%, Membrane aggregates = 38.8%, Cytoplasmic aggregates = 24.5%, n = 39. (D) Line scan intensity plot of PI(4)P-GFP at the cortex during interphase for genotypes in (B). (E) Line scan intensity plot of PI(4)P-GFP through the neuroblast cell during interphase for genotypes in (B). (F) Quantification graph of genotypes in (B). Mean cortical intensity (A.U.) of interphase neuroblasts in Control, 60.4 ± 4.2, n = 24; arf1 RNAi, 81.21 ± 5.6, n = 22, and sec71 RNAi, 75.5 ± 3.5, n = 23. (G) Interphase neuroblasts of control, UAS-Arf1T31N, and UAS-Sec71DN. (H) Quantification graph of genotypes in (I). Control, Cortical = 100%, n = 46; Arf1T31N, Cortical = 26%, Membrane aggregates = 54%, Cytoplasmic aggregates = 20%, n = 50; Sec71DN, Cortical = 30.9%, Membrane aggregates = 47.3%, Cytoplasmic aggregates = 21.8%, n = 55. (I) Telophase neuroblasts of control, UAS-arf1 RNAi, and UAS-sec71 RNAi. Yellow boxes define the regions at which apical and CF intensities were measured. (J) Quantification graph of genotypes in (F). Control, Enriched at CF = 80.5%, Not enriched = 19.5%, n = 41; arf1 RNAi, Enriched at CF = 28.1%, Not enriched = 71.9%, n = 32; sec71 RNAi, Enriched at CF = 32.3%, Not enriched = 67.7%, n = 31. (K) Quantification graph showing the ratio of PI(4)P-GFP fluorescence intensity at CF or basal cortex to apical cortex for genotypes in (F). Control, 3.1 ± 1.2, n = 41; arf1 RNAi, 1.4 ± 0.7, n = 32; sec71 RNAi, 1.8 ± 0.9, n = 36. (L) Telophase neuroblasts of control, UAS-Arf1T31N, and UAS-Sec71DN. Yellow boxes define the regions at which apical and CF intensities were measured. (M) Quantification graph of genotypes in (L). Control, Enriched at CF = 81.6%, Not enriched = 18.4%, n = 38; Arf1T31N, Enriched at CF = 41.9%, Not enriched = 58.1%, n = 43; Sec71DN, Enriched at CF = 44%, Not enriched = 56%, n = 41. (N) Quantification graph showing the ratio of PI(4)P-GFP intensity at CF or basal cortex to apical cortex for genotypes in (L). Control, 2.83 ± 1, n = 40; Arf1T31N, 1.71 ± 0.9, n = 42; Sec71DN, 1.54 ± 0.7, n = 49. (O) A working model. Arf1 can regulate asymmetric division of neuroblasts through phospholipid-dependent nonmuscle myosin II cortical localization in neuroblasts. The means of analyzed phenotypes are shown within each column. For F, K, and N, the means of analyzed phenotypes are shown above each column (with SD). Statistical significances were determined by one-way ANOVA. *P = 0.05, **P = 0.01, ****P = 0.0001, ns=nonsignificant. (Scale bars, 5 µm.)

References

    1. Doe C. Q., Neural stem cells: Balancing self-renewal with differentiation. Development 135, 1575–1587 (2008). - PubMed
    1. Bowman S. K., et al. , The tumor suppressors Brat and Numb regulate transit-amplifying neuroblast lineages in Drosophila. Dev. Cell 14, 535–546 (2008). - PMC - PubMed
    1. Bello B. C., Izergina N., Caussinus E., Reichert H., Amplification of neural stem cell proliferation by intermediate progenitor cells in Drosophila brain development. Neural. Dev. 3, 5 (2008). - PMC - PubMed
    1. Boone J. Q., Doe C. Q., Identification of Drosophila type II neuroblast lineages containing transit amplifying ganglion mother cells. Dev. Neurobiol. 68, 1185–1195 (2008). - PMC - PubMed
    1. Eroglu E., et al. , SWI/SNF complex prevents lineage reversion and induces temporal patterning in neural stem cells. Cell 156, 1259–1273 (2014). - PubMed

MeSH terms

Substances

LinkOut - more resources