. 2025 Apr 15;122(15):e2320138122.
doi: 10.1073/pnas.2320138122. Epub 2025 Apr 10.

Downregulation of Nesprin1 by Runx2 deficiency is critical for the development of skeletal laminopathy-like pathology

Affiliations

Downregulation of Nesprin1 by Runx2 deficiency is critical for the development of skeletal laminopathy-like pathology

Akiko Saito et al. Proc Natl Acad Sci U S A. .

Abstract

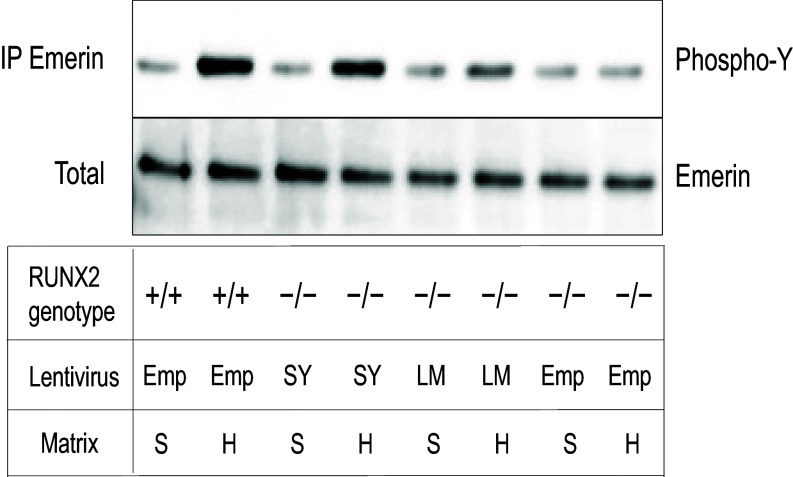
Runx2 is a master regulator of bone formation, and its dysfunction causes cleidocranial dysplasia (CCD) in humans. When iPS cells were generated from patients with CCD and Runx2-deficient iPS cells were generated using gene-editing techniques, abnormal laminopathy-like nuclei were observed. Runx2-deficient cells showed reduced Lamin A/C expression, but not protein levels. However, in Runx2-deficient cells, both the gene expression and protein levels of Nesprin1 were reduced, perinuclear actin fibers were sparser, and nuclear stiffness was reduced. Forced expression of Lamin A/C increased nuclear stiffness but did not improve nuclear morphology. In contrast, the induction of Nesprin1 expression alone normalized nuclear stiffness and restored nuclear morphology and perinuclear actin distribution. In Runx2-null cells, mechanical stress-induced phosphorylation of emerin was not observed. In contrast, forced expression of Nesprin1 in Runx2-null cells resulted in phosphorylation of emerin, indicating the restoration of intracellular tension. These observations were confirmed by atomic force microscopy. Therefore, the intracellular tension was inferred to pull the nuclear membrane into its normal shape. CUT&RUN assay and single RNA-seq analysis showed that an aberrant nuclear membrane caused loss of nuclear lamina gene regulation machinery, making the progression of normal osteogenic differentiation impossible; however, supplementation with Nesprin1 restored gene regulation mechanisms and promoted preosteoblast formation with normal nuclear morphology. Nesprin1 expression induced by Runx2 is essential for epigenetic regulation of the nuclear lamina. We propose CCD as a type of laminopathy involving defective expression of Nesprin1 regulated by Runx2.

Keywords: cleidocranial dysplasia; iPS cells; laminopathy; nuclear membrane; osteoblast differentiation.


Conflict of interest statement

Competing interests statement:The authors declare no competing interest.

Figures

Fig. 1.
Fig. 1.
Analyses of nuclear membrane structure in human and mouse iPS-derived osteoblasts. (AF) Nuclear morphology was examined using fluorescence microscopy (Keyence Corp., Osaka, Japan). For visualization of the nuclear membrane, cells were stained with anti-Lamin B1 antibody. (AF) Human iPS-derived cells on day 14 of OBM induction. (DF) Highmagnification images. Red arrows indicate nuclei with abnormal morphology. (G) Transmission electron microscopy (TEM) images of human iPS-derived cells on day 14 of OBM induction. Red arrows indicate nuclei with abnormal entrapment. (H) Percentage of aberrant nuclei in human iPS-derived cells on days 0, 7, and 14 of OBM induction. Values are presented as mean ±SD (n = 3 to 4). *P < 0.05 and **P < 0.01. †P < 0.01 vs RUNX2+/+ d7. ‡P < 0.01 vs RUNX2+/+ d14. (I) Percentage of aberrant nuclei in mouse iPS-derived cells on days 0 and 14 of OBM induction. Values are presented as mean ± SD (n = 3 to 4). n.s. means not significant. (J) Mouse iPS-derived cells on days 0 and 14 of OBM induction.
Fig. 2.
Fig. 2.
Gene expression of nuclear membrane proteins in human and mouse iPS-derived osteoblasts. (A) RT-qPCR analysis was performed on human iPS cells before (Pre) and after (Post) treatment with OBM. Gene expression of LMNA and SYNE1. Values are presented as mean ± SD (n = 4). *P < 0.01. (B) Gene expression of Lmna and Syne1 in mouse cells. Values are presented as the mean ± SD (n = 4). *P < 0.01. (C) Gene expression of LMNB1, LBR, SYNE2, LEMD2, LEMD3, BAF, TMPO, and SUN1 in human cells after treatment with OBM. Values are presented as the mean ± SD (n = 4). *P < 0.05 and **P < 0.01. (D) Gene expression of Syne2, Lmnb1, and Lbr in mouse cells after treatment with OBM. Values are presented as the mean ± SD (n = 4). *P < 0.05 and **P <0.01. (E) Percentage of abnormal nuclei in human RUNX2-deficient iPS cells and osteoblasts with forced expression of LMNA and SYNE1. A cell population in which only empty vectors have been introduced is defined as “Empty.” Values are presented as mean ± SD (n = 3 to 4). *P < 0.05, **P < 0.01. †P < 0.05 or ‡P < 0.01, vs RUNX2+/+ Empty. (F) Nuclear morphology of human Runx2 −/− iPS-derived cells with forced expression of LMNA or SYNE1 or Runx2 +/+ iPS-derived cells after 14 d of induced osteoblast differentiation was examined by fluorescence microscopy. To visualize the nuclear membrane, cells were stained with anti-LaminB1 antibody. (G) RUNX2, OSX, LMNA, and SYNE1 expression over time during osteoblast differentiation from human RUNX2+/+, RUNX2±, and RUNX2−/− iPS cells. Values are presented as mean ± SD (n = 4).
Fig. 3.
Fig. 3.
Analysis of microstructure and mechanical properties in human iPS-derived osteoblasts using AFM. (A) Merged images of phase contrast and nuclear staining with Hoechst 33342 (Left side), surface topography images (Middle), and surface elastic modulus map images (Right side). (B) Elastic modulus of nuclei isolated from cells after induction of osteoblast differentiation. Values are presented as mean ± SD (n = 22 to 25). *P < 0.05. #P < 0.05 vs RUNX2+/+ Empty. A group in which only the empty vector was introduced into the cells is defined as Empty. (C) Elastic modulus of the cell surface after induction of osteoblast differentiation. Values are presented as mean ± SD (n = 50). *P <0.05. #P < 0.05 vs RUNX2+/+ Empty. (B and C) AFM analyses were also performed on RUNX2± and RUNX2−/− cells with forced expression of LMNA or SYNE1.
Fig. 4.
Fig. 4.
Intracellular distribution of actin. (A) Lamin B1 (green) and F-actin (red) expression in human iPS-derived osteoblasts was confirmed via immunofluorescence staining. White arrows indicate nuclei with abnormal morphology. The Upper Right corner of each image shows a high-magnification image. (B) F-actin area per cell. Values are presented as mean ± SD (n = 11). *P < 0.01. (C) Lamin B1 (green) and F-actin (red) expression in RUNX2-deficient osteoblasts with forced expression of LMNA and SYNE1 confirmed via immunofluorescence staining. White arrows indicate nuclei with abnormal morphology. The Upper Right corner of each image shows a high-magnification image. (D) F-actin area per cell. Values are presented as mean ± SD (n = 11 to 13). *P < 0.01.
Fig. 5.
Fig. 5.
Emerin phosphorylation. Emerin tyrosine phosphorylation was analyzed using western blotting after immunoprecipitation (IP) in cells with different conditions cultured on matrices with varying stiffness. Emp, Empty; SY, SYNE1; LM, LMNA; S, soft matrix; H, hard matrix.
Fig. 6.
Fig. 6.
Lamin A/C-DNA interaction and transcriptional regulation of rRNA by RUNX2 in human iPS-derived osteoblasts. (A) CUT&RUN analysis in human iPS-derived osteoblasts. Metagene analysis of the distribution of Lamin A/C occupancy on −3 kb to +3 kb around the TSS. (B) Pre-rRNA synthesis was analyzed by RT-qPCR in human iPS-derived osteoblasts.
Fig. 7.
Fig. 7.
Single-cell RNA-seq of human iPS-derived osteoblasts. (A) UMAP with streamline RNA velocity calculated by scVelo. Clusters were annotate as the follows; Cluster 0: Multipotent stem cell -1(MSC-1), Cluster 1: Embryonic stem cell (ESC), Cluster 2: Chondroblast progenitor cell (CBP), Cluster 3: Metaphyseal mesenchymal progenitor like cell (MMP), Cluster 4: Multipotent stem cell-2 (MSC-2), Cluster 5: Mesenchymal progenitor cell (MPB), Cluster 6: OCR stem cell (OCR), Cluster 7: Osteoblast progenitor cell (OBP), Cluster 8: Unknown. (B) Dot plot of gene expressions identifying clusters. Clusters 0, 1, 3, and 8 with high expression of ESC markers (Lin28, Nanog, POU5F1, and Sox2) are immature stem cell populations close to iPS cells. On the other hand, cluster 7, which is positive for mesenchymal stem cell markers NT5E and THY1, osteochondroreticular (OCR) cell marker GREM1, and osteoblast markers (Col1A1 and Runx2), represents an immature osteoblast lineage. (C) Cumulative bar plot of samples in each cluster. Cluster 7 has a strongly increased fraction only in Runx2+/+ cells or Runx2−/− +Syne1 cells after induction of osteoblast differentiation. (D) Dot plot of gene set scores calculated by decoupler. (E) Cumulative bar plot of clusters in each sample. Cluster 7 is highlighted in chain rectangles and low transparency.
Fig. 8.
Fig. 8.
Summary of regulatory mechanisms of osteoblastic differentiation via nuclear membrane maintenance by Lamin A/C and Nesprin1 with RUNX2 at the Top.

References

    1. Turgay Y., et al. , The molecular architecture of lamins in somatic cells. Nature 543, 261–264 (2017). - PMC - PubMed
    1. Evangelisti C., Cenni V., Lattanzi G., Potential therapeutic effects of the MTOR inhibitors for preventing ageing and progeria-related disorders. Br. J. Clin. Pharmacol. 82, 1229–1244 (2016). - PMC - PubMed
    1. Osmanagic-Myers S., Dechat T., Foisner R., Lamins at the crossroads of mechanosignaling. Genes Dev. 29, 225–237 (2015). - PMC - PubMed
    1. Dechat T., et al. , Nuclear lamins: Major factors in the structural organization and function of the nucleus and chromatin. Genes Dev. 22, 832–853 (2008). - PMC - PubMed
    1. Camozzi D., et al. , Diverse lamin-dependent mechanisms interact to control chromatin dynamics focus on laminopathies. Nucleus 5, 427–440 (2014). - PMC - PubMed

MeSH terms

LinkOut - more resources