. 2025 Apr 24;68(8):8484-8496.
doi: 10.1021/acs.jmedchem.5c00071. Epub 2025 Apr 10.

Development of Galectin-7-Specific Nanobodies: Implications for Immunotherapy and Molecular Imaging in Cancer

Affiliations

Development of Galectin-7-Specific Nanobodies: Implications for Immunotherapy and Molecular Imaging in Cancer

Rita Nehmé et al. J Med Chem. .

Abstract

Galectins play significant roles in regulating immune responses, posing challenges for cancer immunotherapy. The development of galectin inhibitors has been limited by their high structural homology and the lack of noninvasive imaging tools to identify potential responsive patients. We developed 12 galectin-7-specific inhibitors using nanobodies (Nbs) and identified G7N8 as the lead Nb. G7N8 was conjugated with the NOTA chelator, labeled with copper-64 ([64Cu]Cu), and used as a radiotracer for PET imaging in a triple-negative breast cancer (TNBC) mouse model. Nbs demonstrated high affinity for galectin-7, with no binding activity for other galectins tested. The lead Nbs inhibited galectin-7 binding to T-cell glycoreceptors and reduced subsequent apoptosis. PET imaging with [64Cu]Cu-NOTA-G7N8 showed selective radiotracer accumulation at 20 h (P = 0.001). We developed galectin-7-specific Nbs that inhibit T-cell apoptosis and enable PET imaging of TNBC, providing novel tools for investigating immune regulation and enhancing cancer immunotherapy.


Conflict of interest statement

The authors declare the following competing financial interest(s): D.C., N.D., and Y.S.P. are co-inventors on multinational patent applications by Institut National de la Recherche Scientifique (INRS) related to this work, all dealing with the use of nanobodies and their use to inhibit a biological, physiological, and/or pathological process that involves GAL-7. All other authors report no conflicts.

Figures

Figure 1
Figure 1
Generation, production, and purification of GAL-7 VHH. (A) Schematic representation of VHH selection using a synthetic library and production in E. coli expression systems. (B) SDS–PAGE analysis of the imidazole gradient following Nbs purification. (C) SDS–PAGE analysis of the 12 selected and purified VHHs. (B,C) Molecular weight (MW) markers are shown in kilodaltons (kDa). Results are representative of at least three independent experiments. Gel images were cropped for clarity.
Figure 2
Figure 2
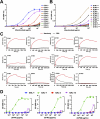
Binding affinity and specificity of Nbs to GAL-7 and other GALs. (A) Binding of Nbs to human GAL-7 directly coated on ELISA plates. *P < 0.001. (B) Binding of Nbs to GAL-7 bound to ASF-coated ELISA plates. *P < 0.05; ***P < 0.001. (C) BLI analysis of Nbs binding to GAL-7. (D) Binding of lead Nbs (G7N1, G7N2, and G7N8) to GAL-1, GAL-3, GAL-7, and GAL-13, measured by ELISA. *P < 0.001. (A–D) Results are representative of at least three independent experiments. (A,B,D) Data are presented as mean ± standard deviation (SD). Analyses were performed using one-way ANOVA followed by Dunnett’s multiple comparisons test and statistical significance was assessed at the highest tested concentration for each experiment.
Figure 3
Figure 3
Characterization of Nbs and cross-reactivity with mouse GAL-7. (A) Dose–response inhibition of GAL-7-induced apoptosis of Jurkat T cells by the 12 Nbs. *P < 0.05 by two-tailed t-test. (B) Apoptosis of Jurkat T cells induced by human GAL-1 or GAL-7 preincubated with lead Nbs (G7N1, G7N2, G7N8, and G7N10) at 50 μM. Controls include cells incubated with GAL-1 or GAL-7 alone (GAL) and with lactose as a positive inhibition control. ***P < 0.001 by two-way ANOVA. (C) Dose–response inhibition of FITC-labeled GAL-7 binding to Jurkat cells after preincubation with the lead Nbs (G7N1, G7N2, G7N8, and G7N10). *P < 0.001 by two-tailed t-test. (D) Binding of the 12 Nbs to mouse GAL-7, as measured by ELISA. *P < 0.05; **P < 0.01; ***P < 0.001 by one-way ANOVA, followed by Dunnett’s multiple comparisons test. (E) Dose–response inhibition of mouse GAL-7-induced apoptosis of Jurkat T cells by the selected lead Nbs G7N2, G7N8 and G7N10. *P < 0.001 by one-way ANOVA, followed by Dunnett’s multiple comparisons test. (A–E) Results are representative of three independent experiments. Data are presented as mean ± SD (A,C–E) Statistical significance was assessed at the highest tested concentration for each experiment. (F) Structural comparison between human and mouse GAL-7. Differences in primary structure are mapped onto the 3D structure of human GAL-7 (PDB 2GAL). Identical residues between mice and human GAL-7 are shown in white, while distinct residues are colored blue. Galactose molecules in the GBS are shown as red sticks. Most primary structure differences are observed at the dimer interface, while the GBS environment is largely identical in both proteins.
Figure 4
Figure 4
AlphaFold3-predicted epitopes targeted by the 12 Nbs on the surface of the GAL-7 homodimer. All AlphaFold3 predictions confirmed the expected back-to-back homodimer architecture of GAL-7 (dark blue), consistent with its crystal structure. The 12 distinct Nbs were found to bind different epitopes on the surface of GAL-7, with preferred sites determined from statistical analysis of 120 independent predictions (see the Experimental section for details). (A) Schematic side-view representation of a GAL-7 homodimer (dark blue), with GBS residues of protomer A shown as red sticks. The preferred Nb binding epitopes on the surface of GAL-7 clustered into six primary regions, ranked by occurrence (Table 2): (1) at the bottom of the GAL-7 dimer interface (54/120 predictions), (2) near the GBS of protomer A (34/120), (3) in front of the GAL-7 homodimer (13/120), (4) at the back of the GAL-7 homodimer (15/120), and (5) near the GBS of protomer B (2/120). (B) AlphaFold3-predicted formation of structural complexes between GAL-7 and the 12 individual Nbs. Each panel displays an overlay of 10 distinct AlphaFold3 predictions. The GAL-7 homodimer is shown in blue, with GBS residues of protomer A in red sticks. For clarity, Nb binding predictions with distinct orientations and/or unique GAL-7 epitopes are color-coded differently in each panel (yellow, green, cyan, orange, magenta, brown), though colors are not consistent across panels. Some Nbs exhibit highly consistent and reproducible binding predictions (e.g., G7N1, G7N2, and G7N8), while other Nbs randomly scatter across multiple epitopes on the surface of GAL-7 (e.g., G7N5, and G7N12).
Figure 5
Figure 5
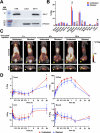
In vivo and ex vivo distribution of [64Cu]Cu-NOTA-G7N8 and PET imaging in a TNBC mouse model overexpressing GAL-7. (A) GAL-7 expression in E0771 cells was analyzed by Western blot (captured image was cropped). Recombinant GAL-7 was used as a positive control (CTRL), and Jurkat cells were used as a negative control. (B) Biodistribution of [64Cu]Cu-NOTA-G7N8 in unblocked and blocked mice (coinjection of 17 nmol cold G7N8) at 20 h postinjection (n = 4 for unblocked mice and n = 6 for blocked mice). *P < 0.05 by two-tailed t-test. (C) Axial and coronal views of mice showing the accumulation of [64Cu]Cu-NOTA-G7N8 in unblocked and blocked mice (coinjection of cold G7N8 at 17 nmol) at 1, 4, and 20 h postinjection. Arrows indicate E0771 tumors. (D) Time-activity curves of unblocked and blocked [64Cu]Cu-NOTA-G7N8 in the tumor, kidney, liver, and muscle. *P < 0.001 by two-tailed t-test. (B,D) Data are presented as mean ± SD.

References

    1. Cummings R. D.; Liu F. T.; Rabinovich G. A.; Stowell S. R.; Vasta G. R.. Galectins. In Essentials of Glycobiology, 4th ed.; Varki A., Cummings R. D., Esko J. D., Stanley P., Hart G. W., Aebi M., Mohnen D., Kinoshita T., Packer N. H., Prestegard J. H., Schnaar R. L., Seeberger P. H., Eds.; Cold Spring Harbor Laboratory Press: Cold Spring Harbor: NY, 2022; Chapter 36.
    1. Liu F. T.; Rabinovich G. A. Galectins as Modulators of Tumour Progression. Nat. Rev. Cancer 2005, 5 (1), 29–41. 10.1038/nrc1527. - DOI - PubMed
    1. Gordon-Alonso M.; Hirsch T.; Wildmann C.; van der Bruggen P. Galectin-3 Captures Interferon-γ in the Tumor Matrix Reducing Chemokine Gradient Production and T-Cell Tumor Infiltration. Nat. Commun. 2017, 8 (1), 793.10.1038/s41467-017-00925-6. - DOI - PMC - PubMed
    1. Girotti M. R.; Salatino M.; Dalotto-Moreno T.; Rabinovich G. A. Sweetening the Hallmarks of Cancer: Galectins as Multifunctional Mediators of Tumor Progression. J. Exp. Med. 2020, 217 (2), e2018204110.1084/jem.20182041. - DOI - PMC - PubMed
    1. Sanjurjo L.; Broekhuizen E. C.; Koenen R. R.; Thijssen V. L. J. L. Galectokines: The Promiscuous Relationship between Galectins and Cytokines. Biomolecules 2022, 12 (9), 1286.10.3390/biom12091286. - DOI - PMC - PubMed