. 2025 Apr 11;388(6743):eadq1709.
doi: 10.1126/science.adq1709. Epub 2025 Apr 11.

Rules of engagement for condensins and cohesins guide mitotic chromosome formation

Affiliations

Rules of engagement for condensins and cohesins guide mitotic chromosome formation

Kumiko Samejima et al. Science. .

Abstract

We used Hi-C, imaging, proteomics, and polymer modeling to define rules of engagement for SMC (structural maintenance of chromosomes) complexes as cells refold interphase chromatin into rod-shaped mitotic chromosomes. First, condensin disassembles interphase chromatin loop organization by evicting or displacing extrusive cohesin. Second, condensin bypasses cohesive cohesins, thereby maintaining sister chromatid cohesion as sisters separate. Studies of mitotic chromosomes formed by cohesin, condensin II, and condensin I alone or in combination lead to refined models of mitotic chromosome conformation. In these models, loops are consecutive and not overlapping, implying that condensins stall upon encountering each other. The dynamics of Hi-C interactions and chromosome morphology reveal that during prophase, loops are extruded in vivo at ∼1 to 3 kilobases per second by condensins as they form a disordered discontinuous helical scaffold within individual chromatids.


Conflict of interest statement

Competing interests: J.D. is a member of the advisory board of Arima Genomics (San Diego, CA, USA) and Omega Therapeutics (Cambridge, MA, USA). J.D. is inventor on patent application US 12,146,186 B2 held by the University of Massachusetts Chan Medical School, Harvard College, the Whitehead Institute for Biomedical Research and the Massachusetts Institute of Technology that covers Hi-C technology. Other authors declare no competing interests.

Figures

Fig. 1
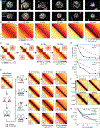
Fig. 1. Dynamics of chromatin bound cohesin and condensin during mitotic entry.
(A) Representative live cell imaging of a DT40 CDK1as_Halo-lamin B1_3xGFP-NES cell released from G2 block with 1NM-PP1. DNA:grey; Halo-lamin B1: magenta; 3xGFP-NES: green. Seven z-sections (1 μm interval) were taken every 1.5 min. A single section is shown for each timepoint. Scale bar = 5 μm. 3XGFP enters nuclei a few minutes prior to visible nuclear lamina disruption (NEB, t= 10–11 min). Intensity of lines under the images illustrates the relative amount of the indicated complexes on chromatin at each time point. Green arrow indicates cytoplasmic GFP entering the nucleus before nuclear envelope breakdown. (B) Relative nuclear GFP fluorescence intensity (cytosolic GFP intensity = 1) from experiment of Fig. 1A. (C) Chromatin enrichment for proteomics (ChEP) analysis of WT CDK1as cells (SILAC analysis). Log2 SILAC ratio normalized against G2 is shown for cohesin (average of SMC1, SMC3, and RAD21), condensin I (CAP-H, CAP-G, and CAP-D2) and condensin II complexes (CAP-H2, CAP-G2, and CAP-D3). t= 0 is after completion of 1NM-PP1 washout, n= 6. (D) Estimated number of chromatin-associated cohesin, condensin I and condensin II complexes (per Mb DNA) during mitotic entry in wild type CDK1as cells. Average iBAQ number from ChEP analysis for subunits as listed in C was normalized relative to values for Histone H4, n= 6. (E) Absolute quantification of SMC3 (cohesin subunit), CAP-H (condensin I subunit) and CAP-H2 (condensin II subunit) on chromatin (per Mb DNA). Protein numbers are calculated following ChEP analysis of corresponding Halo-tagged cell lines normalized using purified spike-in Halo-Histone H4 protein (n= 4).
Fig. 2.
Fig. 2.. Condensin facilitates disassembly of interphase chromatin organization during mitotic entry.
(A) Representative images of DAPI-stained SMC2-AID cells used to prepare Hi-C samples. Nocodazole was added 30 minutes prior to 1NM-PP1 washout. Top row: cells from control culture (no auxin treatment). Bottom row: cells from culture treated with auxin during the G2 block and release into mitosis. Scale bar = 5 μm. (B) Hi-C contact maps of wild-type cells (WT) and SMC2-AID cells treated with auxin (+auxin) from cell populations shown in panel A. A region from chromosome 3 (position 20–70 Mb) is shown. Bottom triangle of each Hi-C map displays Hi-C data obtained with control cells; top triangle displays Hi-C data obtained with auxin treated cells. The checkerboard pattern, readily observed in G2 cells, reflects compartmentalization. Compartments disappeared quickly in WT cells but remained in SMC2-depleted mitotic cells. (C) Same as in panel B, but zoomed in for chromosome 3 (region 33–36 Mb). Insets show the distance-normalized contact enrichment at detected dots genome-wide. TADs and dots persist in SMC2-depleted mitotic cells. (D) Quantification of features shown in panel B (compartments) and panel C (dots). Compartment and dot strength were normalized to their values in G2-arrested cells, which was set at 1. (E) Outline of four possible simulated scenarios of collisions between cohesin and condensins in prophase (left) and the corresponding simulated Hi-C maps (right, on log scale). (F) Same simulated Hi-C maps as in panel E, but in linear scale to better emphasize cohesin-dependent features including lines and dots. (G) Quantification of dots in panel E as predicted by the 4 simulated scenarios shown in panel E and in comparison to WT experimental Hi-C data. Dot strength was normalized to G2, which was set at 1.
Fig. 3.
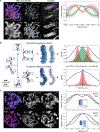
Fig. 3.. Condensin bypasses cohesin to establish separated but cohesive sister chromatids.
(A) Localization of cohesin (SMC3) and condensin (SMC2) in prometaphase knock-in SMC3-clover/SMC2-Halo CDK1as cells 30 minutes after release from G2 block. JFX646-Halo (1/1,000) was added to visualize SMC2-Halo. To remove chromatin-unbound SMC3, cells were fixed with 4% formaldehyde plus 0.5 % Triton. (left), Maximum projection of the full stack of z-sections. (right), Zoom of region in the white rectangle (single z-section). Line scans across chromosomes in the single z-section images (yellow box) were used to quantify the relative fluorescence intensities of SMC3-clover, SMC2-Halo, and DNA (plot to the right). Plots were centered around the position with the highest SMC3 intensity. Data obtained with 10 chromosomes each for two replicate experiments were averaged. Shaded envelopes around main lines represent standard deviations. (B) Polymer models of chromatid compaction of pairs of cohesive sister chromatids through condensin-mediated loop extrusion. Left: two mechanisms of interactions between condensin and cohesive cohesins are modeled (top: condensins bypassing cohesive cohesins; bottom: condensins stalling at cohesive cohesins). Polymers of sisters are shown in shades of blue, cohesive cohesins in green, and extruding condensins in red. Middle: simulated outcomes of configurations of sister chromatids obtained with bypassing (top) or stalling models. Right: histograms present the localization of cohesin, condensin, and DNA for cross-sections of pairs of sister chromatids (as in panel A, right). (C, left) Representative images of prometaphase SMC3-AID/SMC2-Halo cells without or with auxin treatment to remove cohesin prior to mitotic entry. Cells at t= 30 min after release from G2 block were fixed with formaldehyde and SMC2-Halo was visualized with JFX549-Halo (1/10,000). DNA was stained with Hoechst 33542. Max projections of z sections are shown; scale bar = 5 μm. (right) Line-scan quantification of relative fluorescence intensities of DNA and SMC2 across pairs of sister chromatids (no auxin) or single chromatids (+ auxin). Positions with lowest SMC2 intensity (no auxin, marks the point where sister chromatids touch) or highest (auxin, the midpoint of a single chromatid) were aligned in the middle. n = 10 chromosomes for each condition in two replicate experiments. Shadow colors show standard deviation. The calculation of the chromatid/chromosome width is described in the Method section.
Fig. 4.
Fig. 4.. Cohesin impedes helical coiling of mitotic chromosomes.
(A) Representative images of DAPI-stained SMC3-AID cells used to prepare Hi-C samples. Top row: cells from control culture (no auxin treatment). Bottom row: cells from culture treated with auxin during the G2 block and release into mitosis. Scale bar = 5 μm. (B) Hi-C contact maps for SMC3-AID CDK1as cells treated as in panel A. Chromosome 3, position 20–70 Mb is shown. Compartmentalization (checkerboard pattern in Hi-C maps) was stronger in G2 cells, and the second diagonal band appeared sharper, and positioned at larger genomic distance in prometaphase, in SMC3-depleted CDK1as cells (black arrow) compared to those of non-depleted control cells. (C) Quantification of Hi-C data shown in panel B: contact frequency P plotted as a function of genomic separation (s). P(s) curves reveal position and prominence of the second diagonal band visible in Hi-C maps (arrow) from all chromosome arms greater than 100 Mb.
Fig. 5.
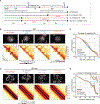
Fig. 5.. Cohesive and not extrusive cohesin impedes helical coiling of mitotic chromosomes.
(A) Double synchronization procedure for SMC3-AID CDK1as cells. Cells were collected and cross-linked in G2 or at 5, 15, 30 minutes after release from G2 block. FACS-sorted cells were used for subsequent analysis. GFP-positive cells (labeled “all cohesin” and “extrusive cohesin only”) contained those respective SMC3 populations. In GFP -negative cells (“no cohesin, G2” and “no cohesin, S + G2”) SMC3 was depleted in the indicated cell cycle phases. (B, D) Images of DAPI-stained SMC3-AID cells used to prepare Hi-C samples and corresponding Hi-C interaction maps at G2 (B) and t= 30 min (D). Scale bar = 5 μm. Hi-C interaction maps are shown in log (top right) and linear scales (bottom left). (C, E) Contact frequency P(s) vs. genomic separation (s) for maps shown in B and D. Inset in (E) shows the magnified view of the region of P(s) corresponding to the second diagonal band visible in Hi-C interaction maps. Arrows point the difference in the position and prominence of the second diagonal band.
Fig. 6.
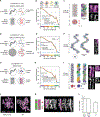
Fig. 6.. Structure of chromosomes assembled by single SMC complexes.
(A) SMC3-AID, SMC3-AID/CAP-H-AID, SMC3-AID/CAP-H2-AID, SMC3-AID/SMC2-AID cells treated with auxin during G2 arrest were released into mitosis and DAPI-stained cells imaged at t= 30 min (prometaphase). Scale bar = 5 μm. Hi-C was performed on the same cultures at t= 30 min. Hi-C interaction maps for a portion of chromosome 3 is shown for each cell line. (B) Plots showing contact frequency P as a function of genomic separation (s) for Hi-C data shown in A, as well as for SMC2-depleted cells. (C) Chromosome spreads of DAPI-stained WT and SMC3-AID, SMC3-AID/CAP-H-AID, SMC3-AID/CAP-H2-AID cells plus auxin. Cells in G2 block were treated with 0.5 μg/ml nocodazole for 30 minutes prior to release into mitosis for an additional 30 min. Cells were harvested and hypotonically swollen with 75 mM KCl for 10 minutes prior to ice-cold methanol-acetic acid (3:1) fixation and spreading. (D) Length of the longest chromosome (Chr 1) of each cell line treated with auxin in the previous G2 measured using cells processed at t= 30 min post release from G2 (prometaphase) as shown in panel C. n ≥16 chromosomes or chromatids measured in 3 independent experiments. Average and standard deviation are shown. (E) As in (C) but cells were rinsed with PBS prior to ice-cold methanol-acetic acid (3:1) fixation and spreading (no nocodazole, no hypotonic treatment). (F) 3D Reconstruction of prometaphase chromosomes of WT, SMC3-AID, SMC3-AID/CAP-H-AID and SMC3-AID/CAP-H2-AID cells treated with auxin in G2, and then released into mitosis (t= 30 minutes). Each image represents a 3D reconstruction of an entire mitotic cell obtained by SBF-SEM. Each chromosome is represented as a different color. Chromosome 1 of each cell line is shown in orange. The total volume of the chromosomes and the length of chromosome 1 are indicated. Scale bar = 2 μm. (G) Correlation between DNA content vs. chromosome volume, derived from images shown in panel G. Chromosomes 1–5 and Z of each cell line are annotated in the graph. The slope of the line is calculated for WT, SMC3-AID, and SMC3-AID/CAP-H2-AID. (H) Chromatid width quantification of large chromosomes in each mutant. Each point represents a measurement, and 10 measurements were taken per chromosome. n= 10 chromosomes, *** p<0.001.
Fig. 7.
Fig. 7.. Polymer modeling reveals the internal organization of chromosomes built by single condensin complexes.
(A-C) Model of SMC3-AID/CAPH-AID (condensin II-only) prometaphase (t=30 min) chromosomes. (A) The four modeling assumptions. (B) Contact frequency P as a function of genomic separation s for the best-fitting model (orange line, model parameters are listed in the plot), in comparison to experimental data (blue line). Dotted line indicates upper limit of the background interaction frequency in experiments, estimated from the average inter-chromosomal interaction frequency. The colored circles (top) and color bars (bottom) indicate levels of genomic organization and their characteristic sizes in base pairs. (C) Left: Simulated chromosome conformation in one modeling replicate in longitudinal projection (top) and a cross-section (bottom). DNA is shown in gray, condensins II shown as red spheres. Gray and red arrows indicate diameter of the chromatid and the condensin scaffold respectively. Middle: Same, but with a few selected loops stained in different colors. Right: A microscopy image of SMC3-AID/CAP-H-AID/Halo-CAP-H2 chromosome. Halo-JFX549 (green) is added to the medium >30 min prior to 1NM-PP1 washout to stain Halo-tagged proteins. Cells were treated with 1NM-PP1 for 13 h and fixed with formaldehyde 30 minutes after 1NM-PP1 washout, and DNA was stained with Hoechst (magenta). Scale bar = 1 μm. (D-F) Same as (A-C) but for SMC3-AID/CAPH2-AID (condensin I-only) prometaphase chromosomes. In (F), the two left images show positions of condensins I as blue spheres. In the middle image, a few selected loops are colored. Right: Microscopy images of SMC3-AID/CAP-H2-AID/SMC2-Halo chromosomes, stained with DAPI and Halo. (G-I) Same as (A-C) but for SMC3-AID (condensin I+II) chromosomes. In (I), SMC3-AID/SMC2-Halo (left) shows DNA plus all condensins, SMC3-AID/Halo-CAP-H2 (right) shows DNA plus only condensin II. (J) SMC3-AID and WT chromosome spreads in which EdU is incorporated into one sister chromatid after two cycles of DNA replication. The harlequin appearance is caused by sister-chromatid exchanges. EdU (green), DNA (magenta). Scale bar = 5 μm. (K) Enlarged images from (J). EdU (green), DNA (magenta). Scale bar = 1 μm. Cartoon shows the criteria used to select partial exchanges to measure the height of an EdU-labeled gyre. Arrow heads indicate gyres matching criteria (L) Size of gyre calculated from EdU height in wild type and SMC3-AID (cohesin depleted) sister-chromatid exchanges and the average gyre size used for modeling. n=4, total 92 measurements (SMC3-AID), n=3, total 81 measurements (WT).

Update of

Similar articles

Cited by

References

    1. Fudenberg G, Imakaev M, Lu C, Goloborodko A, Abdennur N, Mirny LA, Formation of Chromosomal Domains by Loop Extrusion. Cell Rep 15, 2038–2049 (2016). - PMC - PubMed
    1. Hirano T, Condensin-Based Chromosome Organization from Bacteria to Vertebrates. Cell (2016). - PubMed
    1. Yatskevich S, Rhodes J, Nasmyth K, Organization of Chromosomal DNA by SMC Complexes. Annu Rev Genet (2019). - PubMed
    1. Hoencamp C, Rowland BD, Genome control by SMC complexes. Nat Rev Mol Cell Biol (2023). - PubMed
    1. Naumova N, Imakaev M, Fudenberg G, Zhan Y, Lajoie BR, Mirny LA, Dekker J, Organization of the mitotic chromosome. Science (2013). - PMC - PubMed

Publication types

MeSH terms

LinkOut - more resources