. 2025 Jun 1;214(6):1123-1132.
doi: 10.1093/jimmun/vkaf016.

A frameshift-generated cancer neoepitope that controls tumor burden in prophylaxis as well as therapy

Affiliations

A frameshift-generated cancer neoepitope that controls tumor burden in prophylaxis as well as therapy

Mariam M George et al. J Immunol. .

Abstract

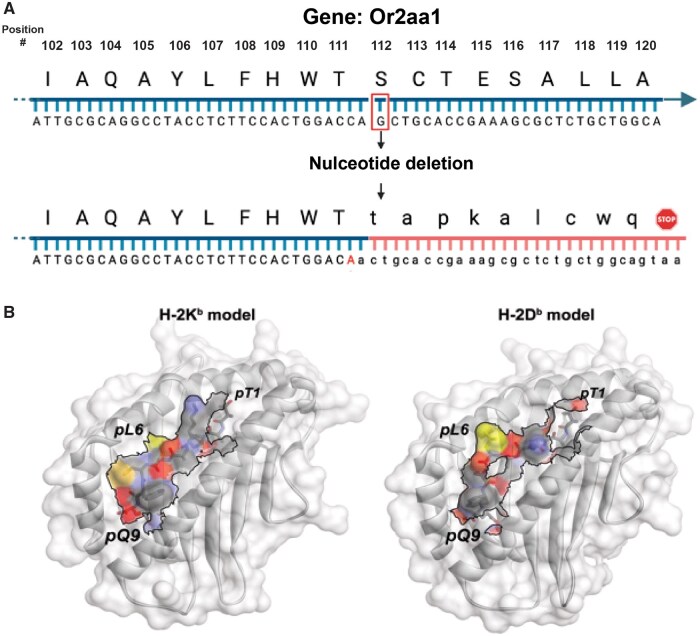
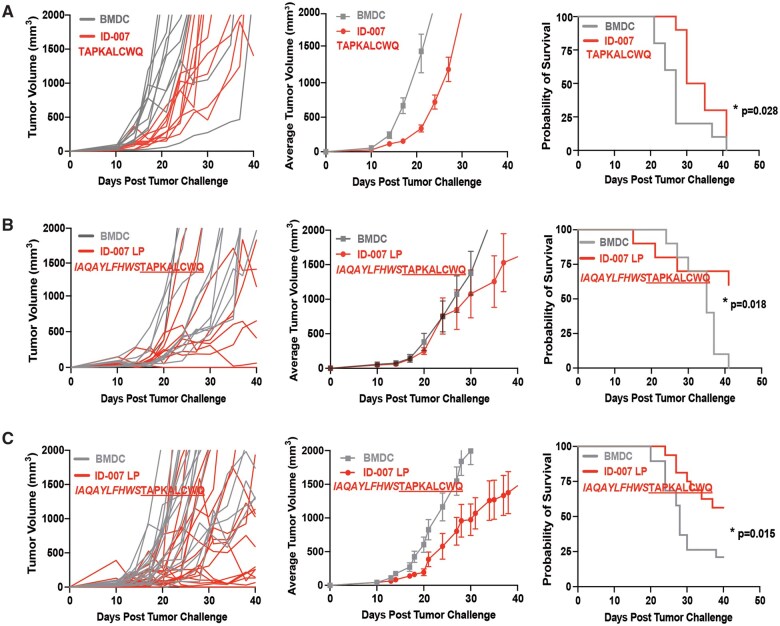
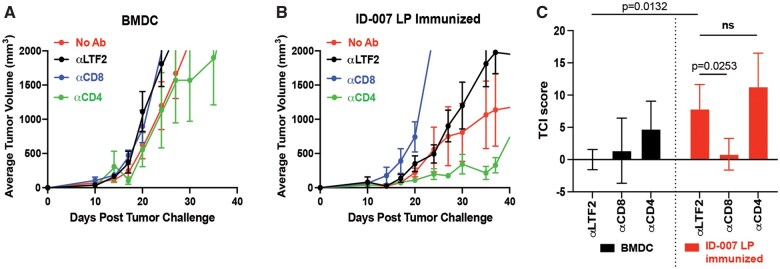
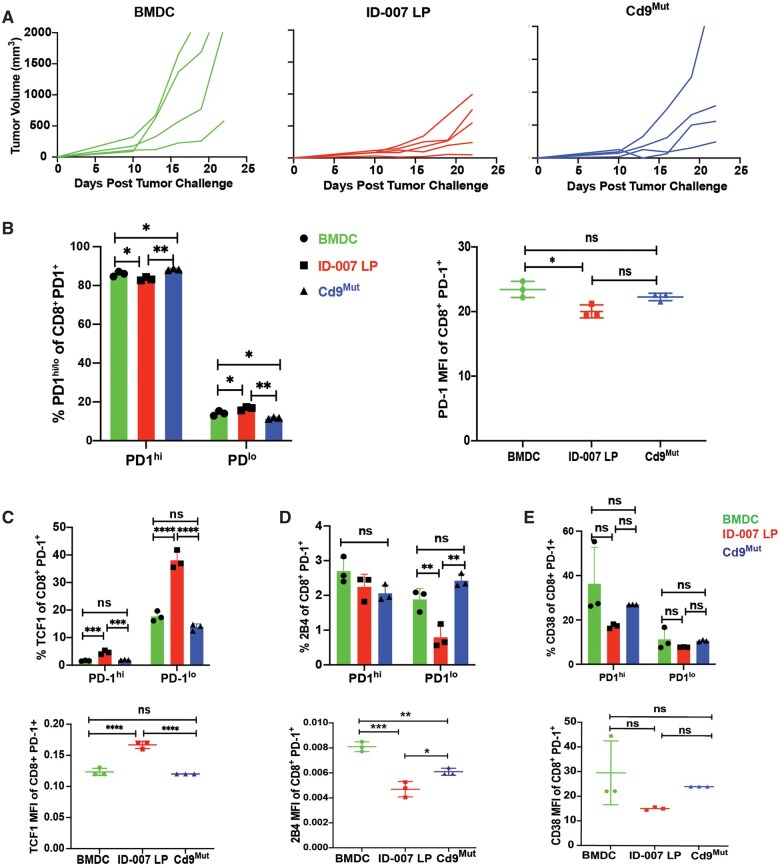
Insertion or deletion of one or two base pairs within a coding region causes a frameshift, which has the potential to generate neoepitopes (InDel-generated neoepitopes) that lack a self-counterpart and are entirely novel. Despite the obvious appeal of InDel-generated neoepitopes, and the demonstration of such candidate neoepitopes that can elicit a CD8 T-cell response, no InDel-generated neoepitopes that actually control tumors in vivo have been reported thus far. Here, in a mouse colon carcinoma line, we identify 11 InDels, only one of which generates a neoepitope that elicits tumor control in vivo in models of prophylaxis as well as therapy. Although this neoepitope has no self-counterpart, it has a low affinity (IC50 33,937.60 nM) for its MHC I allele. Despite its low affinity for MHC I, this neoepitope elicits antitumor activity in vivo through CD8 T cells. Furthermore, CD8 T cells elicited by this InDel-generated neoepitope, like the neoepitopes created by point mutations, show notably less exhaustion than classical immunogenic epitopes. Ironically, this InDel-generated neoepitope follows the same rules as noted for most of the tumor control-mediating neoepitopes generated by point mutations that have a poor affinity for MHC I alleles.

Keywords: InDel; cancer antigen; cancer vaccine; neoantigen; tumor-specific antigen.


Conflict of interest statement

P.K.S. is a founder of Agenus and a founder, board member, and stock owner of Life Science Pharmaceuticals. The other authors declare no competing interests.

Figures

Figure 1.
Figure 1.
Sequences and MHC class I–binding properties of InDel-007. (A) Amino acid sequence (starting at amino acid 102) and corresponding DNA sequence of ID-007 indicating WT (top) and mutated frameshift (bottom) sequences. The stop codon is indicated in red. (B) Structural models of the TAPKALCWQ neoepitope bound to H-2Kb (left) and H-2Db (right). The solvent-exposed surface of the peptide in the binding groove is illustrated, with the surface of the position 6 leucine colored yellow. In the H-2Db model, the leucine is fully solvent exposed, whereas it is mostly buried in the H-2Kb model. The solvent-accessible surface area of the side chain in the Db model is 97 Å2, whereas it is only 25 Å2 in the Kb model.
Figure 2.
Figure 2.
Tumor control activity of ID-007 and ID-007 LP. Tumor growth curves of C57BL/6 mice immunized prophylactically or therapeutically as indicated. Each line shows tumor growth kinetics of a single mouse; n = 10 to 20 mice/group. Tumor growth in mice immunized with peptide-pulsed BMDC is shown in red and with control unpulsed BMDC in grey. Amino acid sequences of the precise ID-007 and ID-007 LP are shown in corresponding graphs. The unaltered sequences are shown in italics, and the neoepitope resulting from the frameshift is underlined. (A) Left: Tumor growth curves of mice immunized therapeutically with ID-007 or unpulsed BMDC. Middle: Average tumor growth curves of mice shown in the left panel. Data are represented as means ± SEM. Right: Percentage survival of mice shown in left and middle panels. (B) Left: Tumor growth curves of mice immunized therapeutically with ID-007 LP or unpulsed BMDC. Middle: Percentage survival of mice shown in the left panel. Data are represented as means ± SEM. Right: Percentage survival of mice shown in the left and middle panels. (C) Left: Tumor growth curves of mice immunized prophylactically with ID-007 LP or unpulsed BMDC. Middle: Percentage survival of mice shown in the left panel. Data are represented as means ± SEM. Right: Percentage survival of mice shown in the left and middle panels. Experiments were repeated 3 times. Statistical analysis for survival curves was performed using the log-rank (Mantel–Cox) test.
Figure 3.
Figure 3.
Tumor control activity of ID-007 is CD8 dependent. (A, B) Mice were prophylactically immunized with unpulsed BMDCs (A) or ID-007 LP–pulsed BMDCs (B) and depleted of CD8 or CD4 cells as indicated and as described in Materials and methods or treated with an isotype control antibody (αLTF2) or not treated at all. Mice were challenged with tumor cells as in Fig. 2. Average tumor growth curves (n = 5 per group) are shown. Data are represented as means ± SEM. (C) TCI scores of mice in A, B are plotted. Data are represented as means ± SD. Experiments were repeated 3 times. Statistical analysis was performed using 2-way ANOVA (Tukey multiple comparisons test); *P < 0.05, **P < 0.01, ***P < 0.001.
Figure 4.
Figure 4.
Phenotypes of CD8+ TILs from mice immunized therapeutically with ID-007 LP. Mice (n = 5 mice per group) were challenged with MC38-FABF and immunized on days 10 and 17 after tumor challenge with unpulsed BMDCs (green) or BMDCs pulsed with peptides ID-007 LP (red) or Cd9MUT (an inactive neoepitope, blue). Tumors were harvested day 23 post–tumor challenge and CD8+ TILs isolated. (A) Tumor growth of mice immunized with each group. (B) (Left), Bar graph representing the proportion of PD1hi and PD1lo cells in CD8+ PD1+ cells. (Right), Quantification of MFI of PD-1 in CD8+ TILs. (C) Bar graphs representing percentage of cells (top) and quantification of MFI (bottom) of TCF1+ cells in CD8+PD1+ cells. (D) Bar graphs representing percentage of cells (top) and MFI (bottom) of 2B4+ cells in CD8+PD1+ cells. (E) Bar graphs representing percentage of cells (top) and quantification of MFI (bottom) of CD38+ cells in CD8+PD1+ cells. Data represented as mean ± SD; n = 5 mice per group where isolated CD8+ TILs were pooled and tested as 3 technical replicates; *P < 0.05, **P < 0.01, ***P < 0.001, ****P < 0.0001 analyzed by one-way ANOVA with Tukey multiple comparison test. Experiments were repeated 3 times.
Figure 5.
Figure 5.
Phenotypes of CD8+ TILs from mice immunized prophylactically with ID-007 LP. Mice (n = 5 mice per group) were immunized with unpulsed BMDCs (green) or BMDCs pulsed with peptides ID-007 LP (red) or Cd9MUT (an inactive neoepitope, blue) and challenged with MC38-FABF. Tumors were harvested day 17 post–tumor challenge and CD8+ TILs isolated. (A) Tumor growth of mice immunized with each group. (B) (Left) Bar graph representing the proportion of PD1hi and PD1lo cells in CD8+PD1+ cells. (Right), Quantification of MFI of PD-1 in CD8+ TILs. (C) Bar graphs representing percentage of cells (top) and quantification of MFI (bottom) of TCF1+ cells in CD8+PD1+ cells. (D) Bar graphs representing percentage of cells (top) and MFI (bottom) of 2B4+ cells in CD8+PD1+ cells. (E) Bar graphs representing percentage of cells (top) and quantification of MFI (bottom) of CD38+ cells in CD8+PD1+ cells. Data represented as mean ± SD; n = 5 mice per group where isolated CD8+ TILs were pooled and tested as 4 technical replicates; *P < 0.05, **P < 0.01, ***P < 0.001, ****P < 0.0001 analyzed by one-way ANOVA with Tukey multiple comparison test. Experiments were repeated 3 times.

Similar articles

References

    1. Srivastava PK. Cancer neoepitopes viewed through negative selection and peripheral tolerance: a new path to cancer vaccines. J Clin Invest. 2024;134:e176740. - PMC - PubMed
    1. Townsend A et al. Source of unique tumour antigens. Nature. 1994;371:662. - PubMed
    1. Linnebacher M et al. Frameshift peptide-derived T-cell epitopes: a source of novel tumor-specific antigens. Int J Cancer. 2001;93:6–11. - PubMed
    1. Hansen UK et al. Tumor-infiltrating T cells from clear cell renal cell carcinoma patients recognize neoepitopes derived from point and frameshift mutations. Front Immunol. 2020;11:373. - PMC - PubMed
    1. Huang J et al. T cells associated with tumor regression recognize frameshifted products of the CDKN2A tumor suppressor gene locus and a mutated HLA class I gene product. J Immunol. 2004;172:6057–6064. - PMC - PubMed