. 2025 Mar 24;166(5):bqaf054.
doi: 10.1210/endocr/bqaf054.

Impact of Excess Activin A on the Lipids, Metabolites, and Steroids of Adult Mouse Reproductive Organs

Affiliations

Impact of Excess Activin A on the Lipids, Metabolites, and Steroids of Adult Mouse Reproductive Organs

Jennifer C Hutchison et al. Endocrinology. .

Abstract

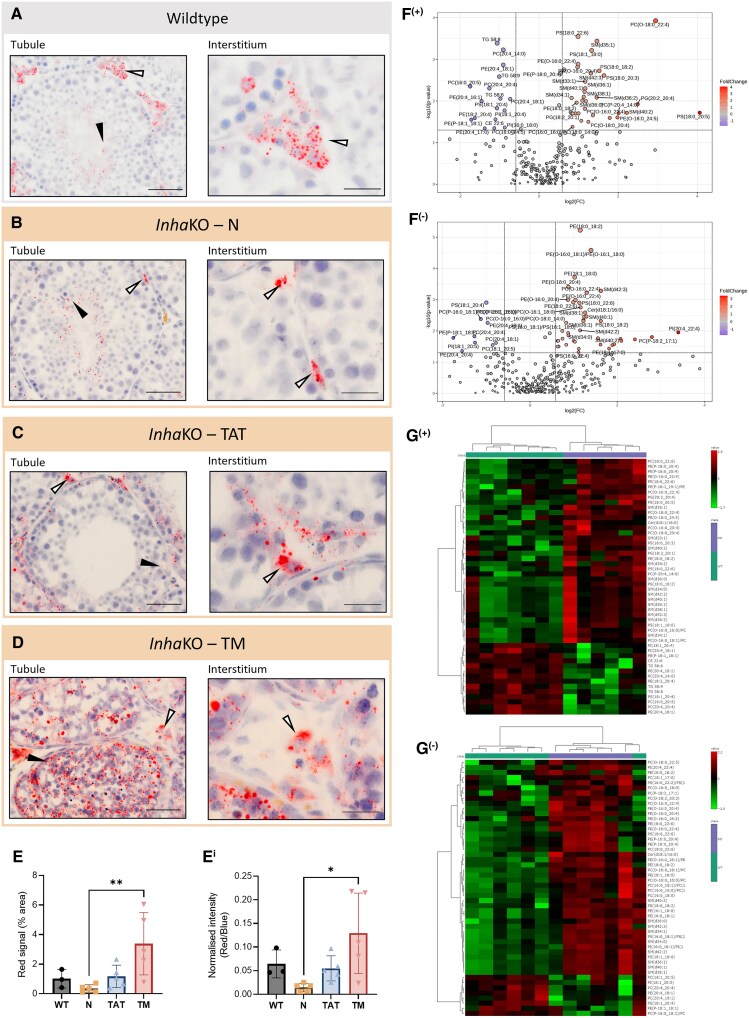
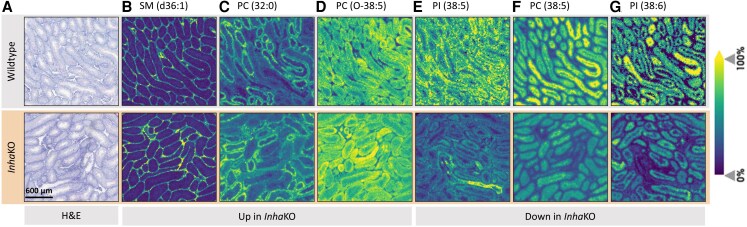
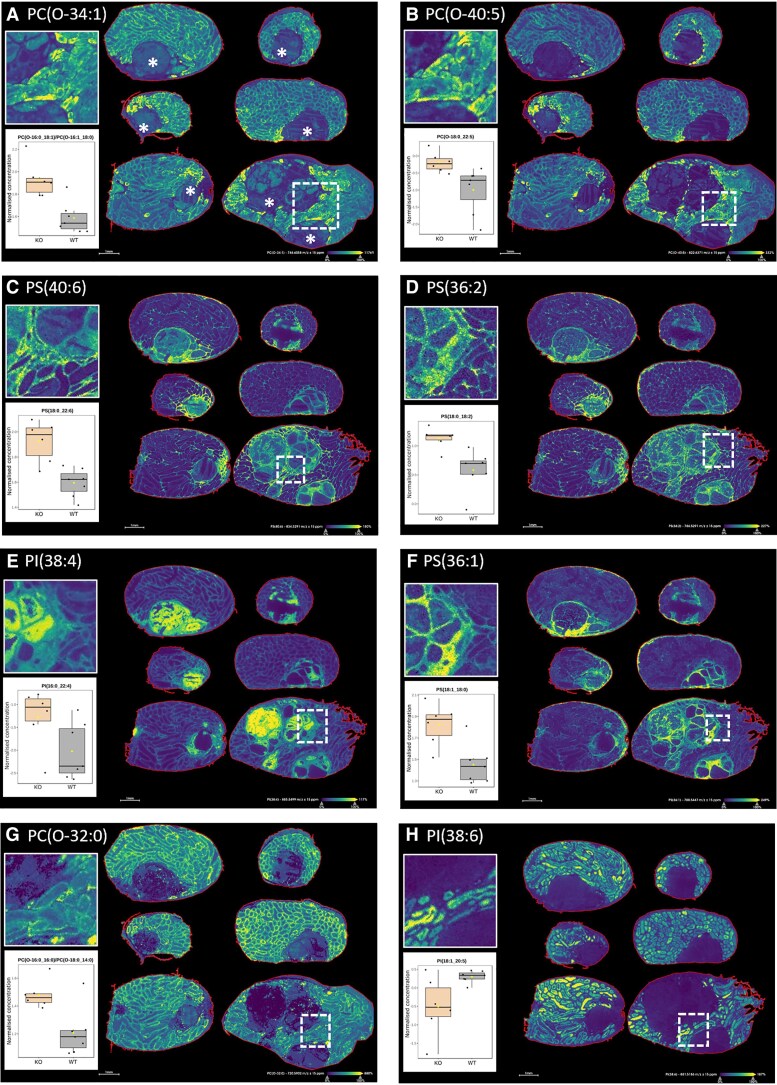
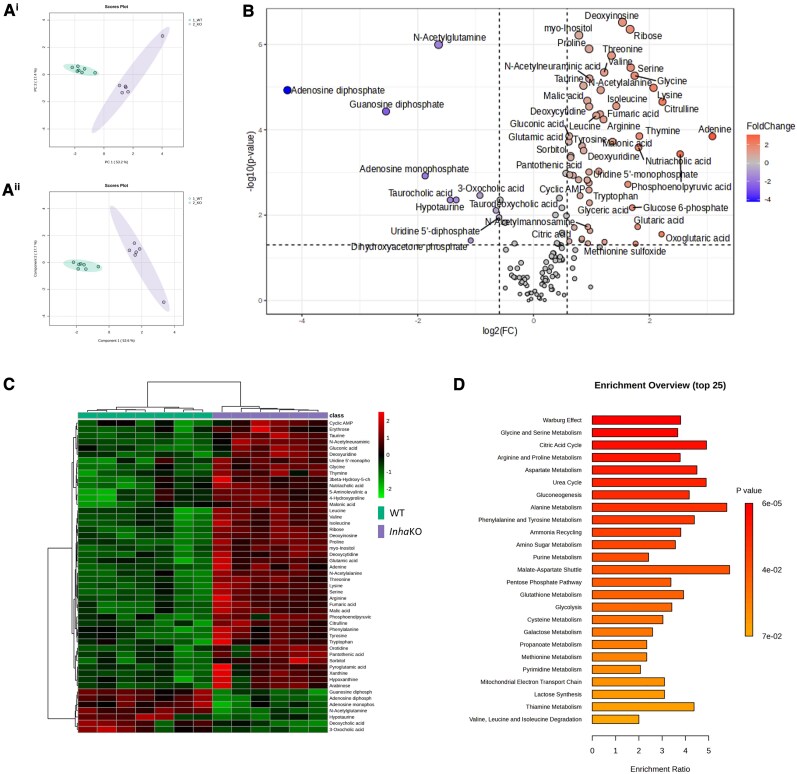
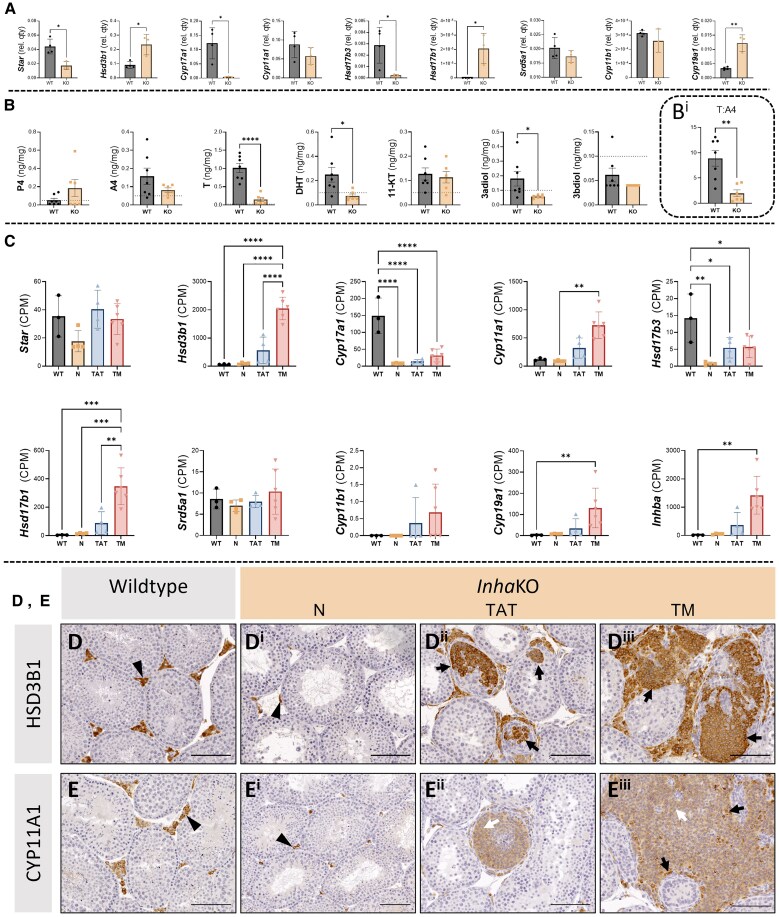
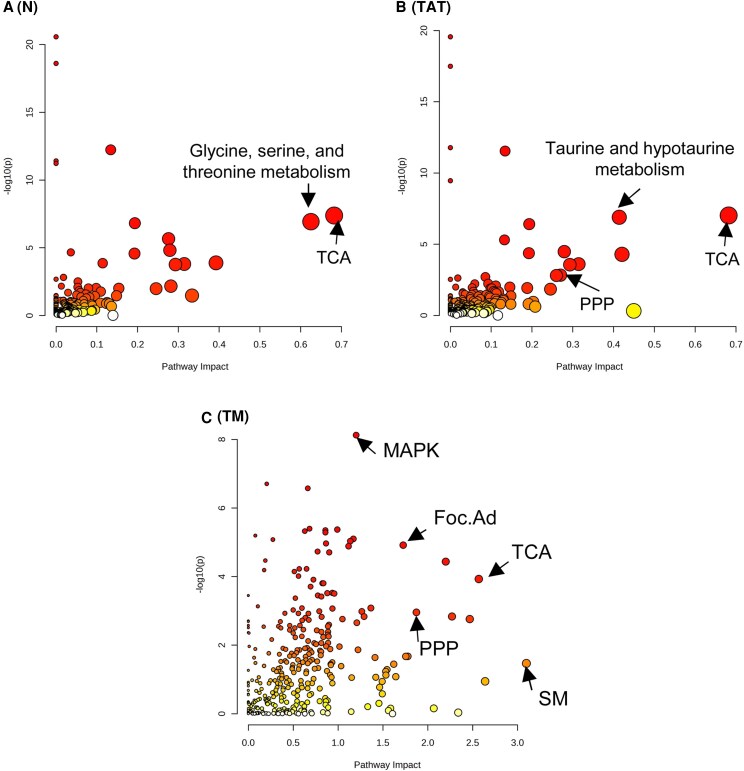
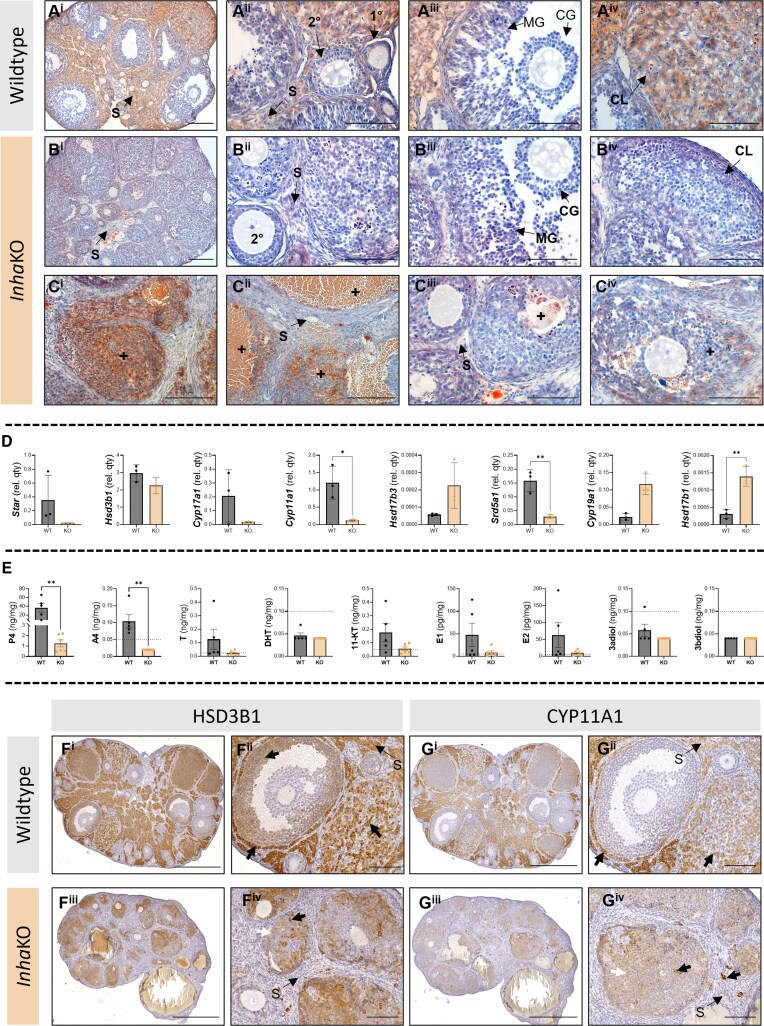
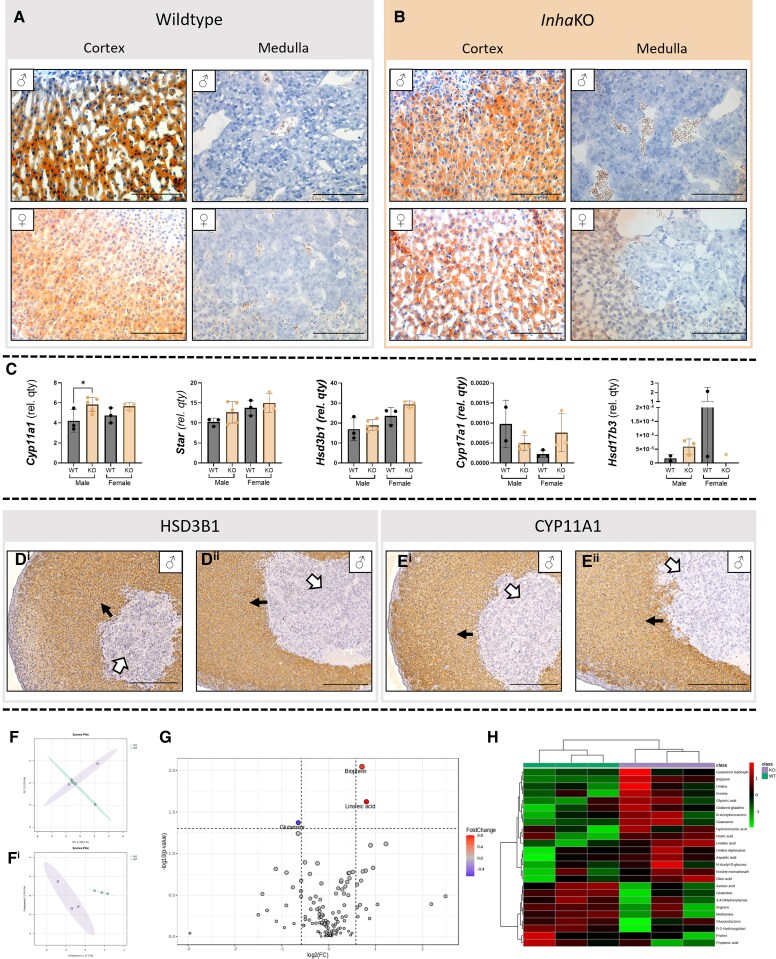
Bioactivity of the hormone and growth factor activin A is central to fertility and health. Dysregulated circulating activin levels occur with medication usage and multiple pathological conditions. The inhibin-alpha knockout mouse (InhaKO) models chronic activin elevation and unopposed activin A bioactivity. In InhaKO fetal testes, lipid droplet, steroid profiles, and seminiferous cords are abnormal; adults develop gonadal and adrenal tumors due to chronic activin A excess exposure. Here we address how this exposure affects lipid, metabolite, and steroid composition in whole testes, ovaries, and adrenals of adult InhaKO mice using histological, transcriptomic, and mass spectrometry (MS) methods, including MS imaging (matrix-assisted laser desorption/ionization-MS imaging). Matrix-assisted laser desorption/ionization-MS imaging delineated spatial lipid profiles within interstitial, inner cord, and outer cord regions containing normal spermatogenesis; these differed between wild-type and KO samples. In proximity to tumors, lipids showed distinctive distribution patterns both within and adjacent to the tumor. Significantly altered lipids and metabolic profiles in whole InhaKO testes homogenates were linked to energy-related pathways. In gonads and adrenal glands of both sexes, steroidogenic enzyme transcription, and steroids are different, as expected. Lipid profiles and steroidogenic enzyme proteins, HSD3B1 and CYP11A1, are affected within and near gonadal tumors. This documents organ-specific effects of chronic activin A elevation on lipid composition and cellular metabolism, in both histologically normal and tumor-affected areas. The potential for activin A to influence numerous steroidogenic processes should be considered in context and with spatial precision, particularly in relationship to pathologies.

Keywords: activin A; adrenal gland; lipid metabolism; mass spectrometry; ovary; steroids; testis; testosterone.


Figures

Figure 1.
Figure 1.
Testicular lipid profile is affected by chronic activin A excess. (A) In WT testes (n = 3), lipid droplet (LDs) are prominent in in spermatids (tubule) and Leydig cells (interstitium). In InhaKO testes (n = 5), LDs are present in spermatids in “normal” tubules (N) and in the interstitium (B). Tubules adjacent to tumors (TATs) exhibit lipid droplets in the interstitium and tubule perimeter (C). Lipid droplets are abundant through tumorigenic regions (TM, D). Scale bars represent 50 µm (tubule) and 20 µm (interstitium). Black arrowheads indicate intratubular lipid droplet accumulations, and white arrowheads indicate interstitial lipid droplets. (E) Red signal (lipid droplets) is significantly elevated in the TM regions of InhaKO mice compared with N (P = .0077), including when normalized to nuclear area (Ei; P = .0115). (F) LC-MS lipidomic analysis identified differentially abundant lipids between WT (n = 7) and InhaKO (n = 6) whole testes (fold-change [FC] 1.5, P < .05). (G) The top 50 differentially abundant lipids distinguish WT and InhaKO testes (green and purple, respectively). In F and G, (+) and (−) indicate data acquired in positive and negative ion mode, respectively.
Figure 2.
Figure 2.
MALDI-MSI reveals intratesticular localization of differentially abundant lipids in morphologically normal regions of InhaKO testes. Lipids altered in the InhaKO (n = 2) testes compared with WT (n = 2) are visualized in the interstitial space (B), tubule perimeter (C, D, E), and intratubular space (F, G). A stage-specific distribution of certain tubular lipids is apparent (C, F, G). Section images showing (A) hematoxylin and eosin staining and (B-G) each identified lipid, m/z ± 15 mDa: (B) SM (d36:1), m/z = 731.6062, fold change InhaKO vs WT (FC) = 2.336 (P = .0048); (C) PC (32:0), m/z = 734.5694 FC = 1.779 (P = .0277); (D) PC (O-38:5), m/z = 794.6058, FC = 4.212 (P = .0180); (E) PI (38:5), m/z = 883.5342, FC = 0.546 (P = .0169); (F) PC (38:5), m/z = 808.5851, FC = 0.584 (P = .0242); (G) PI (38:6), m/z = 881.5186, FC = 0.418 (P = .0237). Scale bar represents 600 µm.
Figure 3.
Figure 3.
MALDI-MSI and whole testis homogenates identify differentially abundant lipids in InhaKO vs WT testes, shown in relationship to tumor proximity. Testis section images show individual lipids, m/z ± 15 ppm, and tentative lipid identification. Inset box and whisker plots show MetaboAnalyst-normalized LC-MS peak areas from whole testis homogenates. White dotted box indicates enlarged area shown above plots. Tumor regions for each of the 6 testis sections are indicated in A by white asterisks. (A) PC(O-34:1), m/z = 746.6058, inset PC(O-16:0_18:1)/PC(O-16:1_18:0); (B) PC(O-40:5), m/z = 822.6371, inset PC(O-18:0_22:5); (C) PS(40:6), m/z = 834.5291, inset PS(18:0_22:6); (D) PS(36:2), m/z = 786.5291, inset PS(18:0_18:2); (E) PI(38:4), m/z = 885.5499, inset PI(16:0_22:4); (F) PS(36:1), m/z = 788.5447, inset PS(18:1_18:0); (G) PC(O-32:0), m/z = 720.5902, inset PC(O-16:0_16:0)/PC(O-18:0_14:0); (H) PI(38:6), m/z = 881.5186, inset PI(18:1_20:5). Scale bars = 1 mm. N = 6 testes from n = 3 biologically independent mice. Each row contains 1 section from each of a pair of testes.
Figure 4.
Figure 4.
Excess activin A changes testicular metabolism. (A) PCA (Ai) and PLSDA (Aii) show discrete profiles of metabolites detected in WT (green, n = 7) and InhaKO (purple, n = 6) testes. (B) Fifty-four metabolites were significantly higher in InhaKO testes, and 10 were lower. (C) Heat map analysis shows hierarchical clustering and different profiles between the 2 genotypes. (D) Enrichment analysis showing the top 25 significantly enriched pathways represented by differentially abundant metabolites elevated in InhaKO testes.
Figure 5.
Figure 5.
Chronic activin A elevation results in regionally altered testis steroid production. (A) Transcripts encoding steroidogenic enzymes measured by qRT-PCR. Graphs show mean ± SD transcript quantity normalized to Rplp0 in the whole WT (n = 4; grey) and InhaKO testis (n = 3; orange). (B) Intratesticular steroid levels. Mean ± SEM steroid hormone concentrations in WT (n = 6; grey) and InhaKO samples (n = 7; orange). Dashed line represents limit of quantitation. (Bi) T:A4 ratio is significantly lower in InhaKO compared to WT testes. (C) RNAseq of microdissected InhaKO and WT testes (data adapted from Whiley et al, 2023 (28)). Mean ± SD counts per million (CPM) of RNA-seq quantified transcripts. Morphologically normal (N), tumor associated tubules (TAT), and tumorigenic (TM), regions of the InhaKO testis demonstrate dysregulation of steroidogenic transcripts in comparison to wild-type (WT). Inhba, Hsd17b3, and Cyp11a1 from Whiley et al (2023) (28). (D) Immunoreactive HSD3B1 was identified in WT testis interstitial cells (black arrowhead). InhaKO testes exhibit fewer immunoreactive cells in the interstitium of morphologically normal regions (Di, black arrowhead). HSD3B1+ cells were identified in discrete patches inside seminiferous tubules, and within established focal lesions (Dii, Diii; black arrows). (E) Interstitial CYP11A1+ cells in the WT testis (black arrowhead). Fewer immunoreactive cells were visible in morphologically normal regions of InhaKO testes (Ei; black arrowhead), and signals of varying intensities could be seen within abnormal testis cords and focal lesions (Eii, Eiii, black and white arrows indicate greater and lower signal intensities, respectively). Scale bars represent 100 µm. Negative controls provided in Fig. S4 (29). Individual data points represent biologically independent replicates. *P < .05, **P < .01, ***P < .001, and ****P < .0001.
Figure 6.
Figure 6.
Proximity to the InhaKO tumors influences the pathways enriched in gene expression and cell metabolism relative to WT testes. Visual representation of joint pathway analysis utilizing the differentially abundant whole testis metabolites in conjunction with unique DEGs of the morphologically normal regions (A; 104 DEGs), tumor associated tubules (B; 109 DEGs), and the tumorigenic regions (C; 6070 DEGs) of InhaKO testes. TCA, the citric acid cycle; PPP, pentose phosphate pathway; MAPK, MAP kinase signaling pathway; Foc.Ad, focal adhesions; SM, sphingolipid metabolism.
Figure 7.
Figure 7.
Abnormal lipid deposition and steroid production phenotype in InhaKO ovaries. (A) In WT ovaries (n = 4), Oil Red O staining identifies lipid deposition in the stroma (S; Ai), granulosa cells of primary and secondary follicles (1°, 2°, respectively; Aii), and in the mural, but not cumulus, granulosa cells of the antral follicle (MG, CG, respectively; Aiii). The corpus luteum (CL) is rich in lipid droplets (Aiv). (B) The InhaKO ovarian stroma (n = 3) appears to have lower density of Oil Red O accumulation (Bi, Cii, Ciii). Secondary follicles (Bii) contain Oil Red O–identified lipid droplets. The mural granulosa cells appear to have fewer lipid droplets in antral follicles than WT (Biii). The corpus luteum also has reduced Oil Red accumulation (Biv). (C) Morphologically abnormal regions (+) of InhaKO ovaries accumulate lipid droplets (Ci-Ciii are biologically independent samples). (D) Steroidogenic transcripts measured by qRT-PCR. Mean ± SD transcript level normalized to Rplp0 in WT (grey) and InhaKO ovary (orange). (E) Intraovarian hormone concentrations. Mean ± SEM in WT (grey) and InhaKO ovary (orange). (F) HSD3B1 is observed in the stroma (S), corpora lutea, thecal, and mural granulosa cells (black arrows) of the WT ovary (Fi, Fii). In the InhaKO (Fiii, Fiv), HSD3B1 signal is observed in morphologically abnormal follicles at varying signal intensity (black and white arrows) and appears much reduced in the stroma comparted to WT. (G) CYP11a1 signal is observed in the stroma, thecal cells, and corpora lutea of the WT ovary (Gi, Gii). Variable CYP11a1 signal intensity is seen in morphologically abnormal follicles of the InhaKO ovary, and in some stromal cells (Giii, Giv; black and white arrowheads indicate differing signal intensity). Negative controls are provided in Fig. S4 (29). Scale bars represent 500 µm (Fi, Fiii, Gi, Giii), 200 µm (Ai, Bi, Ci, Cii, Ciii); 100 µm (Aii, Aiii, Aiv, Biii, Biv, Ci-iv, Fii, Fiv, Gii, Giv). *P < .05, **P < .01. Individual data points represent biologically independent replicates.
Figure 8.
Figure 8.
Excess activin A affects adrenal gland reveals subtle effects of excess activin A on cell metabolism. (A) In the wild type adrenal gland, lipid droplets accumulate in the cortex, but are sparse in the adrenal medulla, and the InhaKO adrenal (B) was not obviously different. (C) Transcripts encoding steroidogenic enzymes measured by qRT-PCR. Mean ± SD transcript level normalized to Rplp0 in InhaKO and WT adrenals glands, individual data points represent biologically independent samples, n ≥ 3 used for statistical analyses. Cyp11a1 was significantly higher in the male but not female InhaKO adrenal glands (P = .0437, P = .0200 respectively). (D) HSD3B1 immunoreactivity in the adrenal cortex of the WT (Di) and KO (Dii) was similar (black arrows, n = 4 WT, n = 3 InhaKO). (E) Cyp11A1 was also present in the adrenal cortex of WT (Ei) and KO (Eii) adrenals with no overt difference (black arrow, n = 3 each). HSD3B1 and CYP11A1 were absent from the medulla (white arrow). Negative controls are provided in Fig. S4 (29). PCA (F) and PLSDA (Fi) analyses demonstrate clustering of WT (green) and InhaKO (red) adrenal gland metabolic profiles. (G) Volcano plot demonstrates 2 metabolites were significantly higher in the InhaKO adrenal glands, and 1 was significantly lower compared to WT. (H) Heatmap analysis shows discrete metabolomic profiles of the InhaKO (purple) and WT (green) adrenal glands. All metabolomic analyses performed on male adrenal glands. Scale bars represent 100 µm (A, B) or 200 µm (D, E). ♂ and ♀: male and female respectively.

Similar articles

References

    1. Wijayarathna R, de Kretser DM. Activins in reproductive biology and beyond. Hum Reprod Update. 2016;22(3):342‐357. - PubMed
    1. Reis F. Activin A in mammalian physiology. Physiol Rev. 2019;99(1):739‐780. - PubMed
    1. Bellissima V, Visser GHA, Ververs TF, et al. Antenatal maternal antidepressants drugs affect activin A concentrations in maternal blood, in amniotic fluid and in fetal cord blood. J Matern Fetal Neonatal Med. 2011;24(sup2):31‐34. - PubMed
    1. Spencer K, Cowans NJ, Nicolaides KH. Maternal serum inhibin-A and activin-A levels in the first trimester of pregnancies developing pre-eclampsia. Ultrasound Obstet Gynecol. 2008;32(5):622‐626. - PubMed
    1. Hardy JT, Buhimschi IA, McCarthy ME, et al. Imbalance of amniotic fluid activin-A and follistatin in intraamniotic infection, inflammation, and preterm birth. J Clin Endocrinol Metab. 2016;101(7):2785‐2793. - PMC - PubMed