. 2025 Apr 10;21(4):e1011655.
doi: 10.1371/journal.pgen.1011655. eCollection 2025 Apr.

Genomic regions of current low hybridisation mark long-term barriers to gene flow in scarce swallowtail butterflies

Affiliations

Genomic regions of current low hybridisation mark long-term barriers to gene flow in scarce swallowtail butterflies

Sam Ebdon et al. PLoS Genet. .

Abstract

Many closely related species continue to hybridise after millions of generations of divergence. However, the extent to which current patterning in hybrid zones connects back to the speciation process remains unclear: does evidence for current multilocus barriers support the hypothesis of speciation due to multilocus divergence? We analyse whole-genome sequencing data to investigate the speciation history of the scarce swallowtails Iphiclidespodalirius and I . feisthamelii, which abut at a narrow ( ∼ 25 km) contact zone north of the Pyrenees. We first quantify the heterogeneity of effective migration rate under a model of isolation with migration, using genomes sampled across the range to identify long-term barriers to gene flow. Secondly, we investigate the recent ancestry of individuals from the hybrid zone using genome polarisation and estimate the coupling coefficient under a model of a multilocus barrier. We infer a low rate of long-term gene flow from I . feisthamelii into I . podalirius - the direction of which matches the admixture across the hybrid zone - and complete reproductive isolation across ≈ 33% of the genome. Our contrast of recent and long-term gene flow shows that regions of low recent hybridisation are indeed enriched for long-term barriers which maintain divergence between these hybridising sister species. This finding paves the way for future analysis of the evolution of reproductive isolation along the speciation continuum.


Conflict of interest statement

The authors have declared that no competing interests exist.

Figures
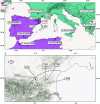
Fig 1
Fig 1. (A) Sampling locations and ranges of I. feisthamelii (purple) and I. podalirius (teal) butterflies.
The samples collected from the hybrid zone (HZ) are shown in yellow. (B) Sampling locations of butterflies from the Iphiclides HZ. The dashed line represents the approximate HZ center, based on samples collected by Lafranchis et al. [66]. The circular samples resemble I. feisthamelii (HI < 0.1), the triangular samples are intermediate hybrids (HI > 0.1). Maps were generated using the Python ‘basemap’ package with Natural Earth’s 10m country and coastline datasets (available here), and a relief layer from the ArcGIS Rest Service [90]. The basemap plotting code is available here.
Fig 2
Fig 2. (A) The background demographic history of species divergence and gene flow, the height and width of populations, is relative to the maximum likelihood estimates under the IM2,pod model (Table 2).
This figure was generated using demes [91]. (B) PCA of Iphiclides sampled across Europe; I. feisthamelii and I. podalirius samples are shown in purple and teal respectively. Samples from the HZ are shown in yellow: PC1 captures differences between the two taxa, PC2 geographic structure, particularly the separation between North African and European I. feisthamelii.
Fig 3
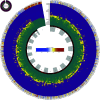
Fig 3. Circular representation of the location of barriers identified using gIMble and the polarity of diagnostic markers for each sample across linkage groups.
The inner ring shows the location of each chromosome in alternating grey and white. Moving outwards, the next ring indicates the location of barriers to gene flow (in red) and non-barrier/migrating regions (in black). The remaining rings show the genotype of each sample at each diagnostic marker. Teal bars are diagnostic of I. podalirius, purple bars are diagnostic of I. feisthamelii, and yellow bars are heterozygous for markers diagnostic of each species. The outermost ring shows the density of high DI sites. The location of each megabase of sequence for each chromosome is indicated on the outside of the circle.
Fig 4
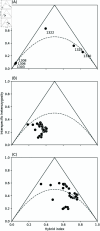
Fig 4. Hybrid index (HI) versus interspecific heterozygosity (H) for samples collected from the Iphiclides hybrid zone (HZ).
(A) Mean values for each HZ sample. (B) Mean values for each chromosome including all samples from the HZ. (C) Mean values for each chromosome excluding the three I. feisthamelii-like samples (1303, 1306 and 1308, HI  ≈  0). The dashed line indicates the expectation under Hardy-Weinberg equilibrium.
Fig 5
Fig 5. The distributions of D¯, the number of unique ancestry junctions, and the number of strongly diagnostic sites (A/C/E) across gIMble barrier windows (grey) and non-barrier/migrating windows (yellow) and their corresponding bootstrap results (B/D/F).
The latter two metrics have been corrected for window span. Both D¯ calculated per window (A and B, circular bootstrap, p<0.001) and the number of highly diagnostic markers (E and F, circular bootstrap, p<0.001) is greater within long-term barriers than in non-barrier windows. The number of unique ancestry junctions is lower within long-term barriers than in non-barrier windows (C and D, circular bootstrap, p<0.001). Null distributions of D¯ were generated using four different resampling schemes (B). In each instance, random values of D¯ were drawn without replacement from the empirical distribution of window-wise D¯ to generate datasets corresponding to the number of barrier windows. We repeat each resampling 1,000 times and compare the distribution of mean D¯ to the observed value. Firstly, we sample datasets from the entire genome with (green) and without (black) circularising (see methods). Secondly, we resample per-chromosome accounting for differences in the number of outliers between chromosomes, also with (blue) and without (grey) circularising. We only show the most conservative test - the circular bootstrap accounting for chromosome-of-origin - for the number of junctions (D) and the number of strongly diagnostic sites (F).
Fig 6
Fig 6. Distribution of sizes of (purple points) I. feisthamelii tracts introgressing into I. podalirius, and (teal points) I. podalirius tracts into I. feisthamelii, on a log-log scale.
Note, as most introgression is heterozygous, the introgressing tracts largely correspond to the yellow tracts in Fig 3. These are compared to theoretical predictions (solid lines) for exchange between two infinite demes (S1 Appendix A-5). Introgression into I. podalirius is plotted for [M, S, R, T= 15, 0.11, 0.25, 150]. Introgression into I. feisthamelii is plotted for [M, S, R, T = 1.5, 0.0, 0.25, 275]. The difference in gradients on the right indicates stronger coupling (S ∕ R) of the I. podalirius background despite more migrants M per generation. The distribution of small blocks towards the left does not match theory (see Results), making the time-since-contact estimates T lower bounds only.

Similar articles

References

    1. Campbell C, Poelstra J, Yoder A. What is speciation genomics? The roles of ecology, gene flow, and genomic architecture in the formation of species. Biol J Linnean Soc. 2018;124(4):561–83.
    1. Bush GL. Sympatric speciation in animals: new wine in old bottles. Trends Ecol Evol 1994;9(8):285–8. doi: 10.1016/0169-5347(94)90031-0 - DOI - PubMed
    1. Dieckmann U, Doebeli M. On the origin of species by sympatric speciation. Nature 1999;400(6742):354–7. doi: 10.1038/22521 - DOI - PubMed
    1. Nosil P. Speciation with gene flow could be common. Mol Ecol 2008;17(9):2103–6. doi: 10.1111/j.1365-294X.2008.03715.x - DOI - PubMed
    1. Feder JL, Egan SP, Nosil P. The genomics of speciation-with-gene-flow. Trends Genet 2012;28(7):342–50. doi: 10.1016/j.tig.2012.03.009 - DOI - PubMed

LinkOut - more resources