. 2025 Jun;104(2):151488.
doi: 10.1016/j.ejcb.2025.151488. Epub 2025 Apr 4.

Galectin-8 drives ERK-dependent mitochondrial fragmentation, perinuclear relocation and mitophagy, with metabolic adaptations for cell proliferation

Affiliations

Galectin-8 drives ERK-dependent mitochondrial fragmentation, perinuclear relocation and mitophagy, with metabolic adaptations for cell proliferation

Adely de la Peña et al. Eur J Cell Biol. 2025 Jun.

Abstract

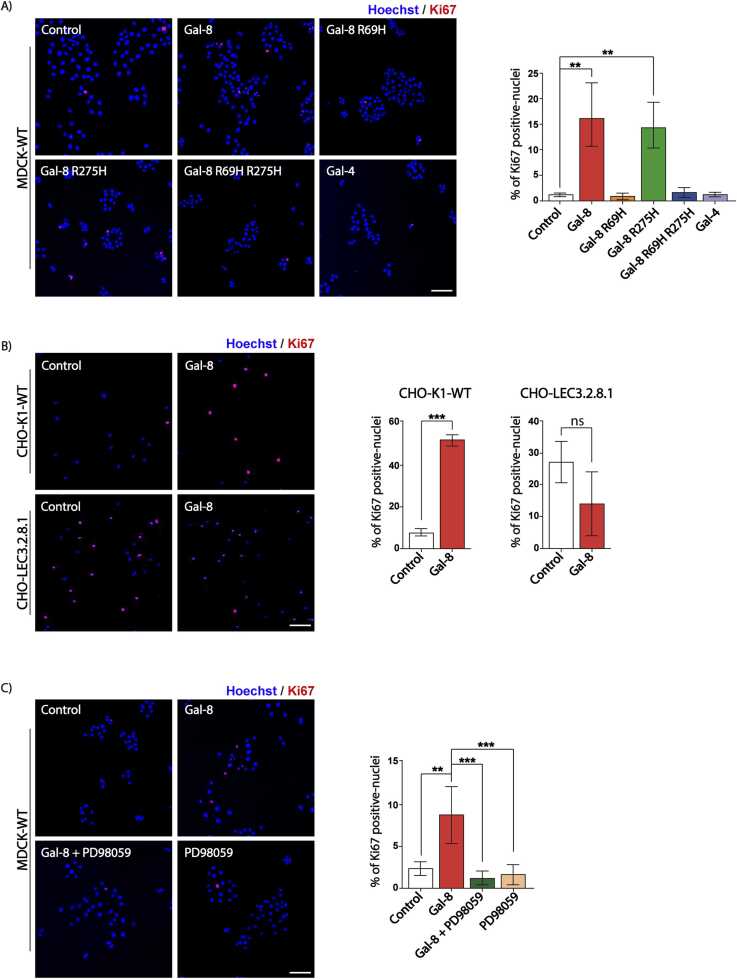
Mitochondria adapt to the cell proliferative demands induced by growth factors through dynamic changes in morphology, distribution, and metabolic activity. Galectin-8 (Gal-8), a carbohydrate-binding protein that promotes cell proliferation by transactivating the EGFR-ERK signaling pathway, is overexpressed in several cancers. However, its impact on mitochondrial dynamics during cell proliferation remains unknown. Using MDCK and RPTEC kidney epithelial cells, we demonstrate that Gal-8 induces mitochondrial fragmentation and perinuclear redistribution. Additionally, mitochondria adopt donut-shaped morphologies, and live-cell imaging with two Keima-based reporters demonstrates Gal-8-induced mitophagy. ERK signaling inhibition abrogates all these Gal-8-induced mitochondrial changes and cell proliferation. Studies with established mutant versions of Gal-8 and CHO cells reveal that mitochondrial changes and proliferative response require interactions between the N-terminal carbohydrate recognition domain of Gal-8 and α-2,3-sialylated N-glycans at the cell surface. DRP1, a key regulator of mitochondrial fission, becomes phosphorylated in MDCK cells or overexpressed in RPTEC cells in an ERK-dependent manner, mediating mitochondrial fragmentation and perinuclear redistribution. Bafilomycin A abrogates Gal-8-induced cell proliferation, suggesting that mitophagy serves as an adaptation to cell proliferation demands. Functional analysis under Gal-8 stimulation shows that mitochondria maintain an active electron transport chain, partially uncoupled from ATP synthesis, and an increased membrane potential, indicative of healthy mitochondria. Meanwhile, the cells exhibit increased extracellular acidification rate and lactate production via aerobic glycolysis, a hallmark of an active proliferative state. Our findings integrate mitochondrial dynamics with metabolic adaptations during Gal-8-induced cell proliferation, with potential implications for physiology, disease, and therapeutic strategies.

Keywords: Galectin-8; Glycosylation; Mitochondrial dynamics; Mitophagy; Proliferation.


Conflict of interest statement

Declaration of Competing Interest The authors declare that they have no known competing financial interests or personal relationships that could have appeared to influence the work reported in this paper.

Figures

Fig. 1
Fig. 1
Gal-8 induces mitochondrial fragmentation and redistribution in a carbohydrate-dependent manner. MDCK cells were treated with Gal-8, Gal-8-R69H, Gal-8-R275H, Gal-8-R69H-R275H (50 µg/ml), or CCCP (10 μM) for 24 hours and then incubated with MitoTracker CMTMRos to visualize mitochondria. Images were acquired using a confocal microscope and Z-stacks were deconvolved in 3D, surface rendered, and analyzed with Huygens Essential software. A) Representative images of control, Gal-8 and CCCP treated cells. Graphs show the following mitochondrial characteristics: B) number, C) length and surface, D) number of donut-shaped mitochondria (indicated by white arrows), E) distribution within the cell based on the distance from the nuclear perimeter. F) Representative images of mitochondria in control, Gal-8, Gal-8-R69H, Gal-8-R275H, Gal-8-R69H-R275H treated cells. G) and H) graphs show the indicated quantification and the statistical significance in each condition (Mean ± s.d., n = 3, 25 cells per experiment, One-Way ANOVA with a posterior Tukey, ***p < 0.001). Scale bar = 10μm.
Fig. 2
Fig. 2
Gal-8-induced fragmentation and perinuclear distribution of mitochondria require surface sialylated glycoconjugates. CHO-K1-WT and CHO-LEC3.2.8.1 cells were treated with Gal-8 (50 μg/ml) for 24 hours and then labeled with MitoTracker CMTMRos and Hoechst. Z-stacks of confocal images were deconvolved, surface rendered, and analyzed with Huygens Essential software. A) Representative images of CHO-K1-WT and CHO-LEC3.2.8.1 cells. B) Graphs showing the length and surface of mitochondria. C) Percentage of mitochondria within 3 μm of the nucleus. (Mean ± s.d., n = 3, 25 cells per experiment, One-Way ANOVA with a posterior Tukey, *p < 0.05, **p < 0.01, ***p < 0.001). Scale bar = 10μm.
Fig. 3
Fig. 3
Comparing the effects of Gal-8 with other galectins on mitochondrial fragmentation and redistribution MDCK cells were treated with Gal-1, −3, −4, or −8 (50 μg/ml) for 24 hours were then labeled with MitoTracker CMTMRos and images were acquired by confocal microscopy. Z-stacks, deconvolved, surface rendered, and analyzed with Huygens Essential software. A) Representative images of MDCK cells after each treatment. B) Graphs showing the length and surface of mitochondria. C) Percentage of mitochondria within 3 μm of the nucleus. (Mean ± s.d., n = 3, 25 cells per experiment, One-Way ANOVA with a posterior Tukey, ***p < 0.001). Scale bar = 10μm.
Fig. 4
Fig. 4
Gal-8 promotes cell proliferation in a carbohydrate- and ERK-dependent manner. Ki67 positive cell rate in A) MDCK cells treated with Gal-8, Gal-8-R69H, Gal-8-R275H, Gal-8-R69H-R275H or Gal-4 (50 µg/ml) for 24 hours, B) CHO-K1-WT and CHO-LEC3.2.8.1 cells treated with Gal-8 (50 μg/ml) for 24 hours, and C) MDCK cells treated with Gal-8 (50 μg/ml) in the presence or absence of MEK inhibitor PD98059 (25 μM) for 24 hours. (Mean ± s.d., n = 3, 300 cells per experiment, One-Way ANOVA with a posterior Tukey, *p < 0.05, **p < 0.01, ***p < 0.001). Scale bar = 100μm.
Fig. 5
Fig. 5
Gal-8-induced fragmentation and redistribution of mitochondria to the perinuclear zone depend on ERK-mediated DRP1 phosphorylation. MDCK cells treated with Gal-8 (50 μg/ml) in the presence or absence of MEK inhibitor PD98059 (25 μM) for 24 hours were stained with MitoTracker CMTMRos and Hoechst. Z-stacks of images acquired by confocal microscopy were deconvolved, surface rendered and analyzed with Huygens Essential software. A) Representative images. B) Graphs showing the length and surface of mitochondria. C) Percentage of mitochondria within 3 μm of the nucleus. D) Immunoblots of pS616-DRP1, DRP1, pERK, and ERK of MDCK cells treated as indicated. The graphs show the increase in the phosphorylation rate relative to the control. E) Immunoblot shows the level of DRP1 in RPTEC-Sh-Control and RPTEC-Sh-DRP1. F) Representative images of RPTEC-Sh-Control and RPTEC-Sh-DRP1 in the presence or absence of Gal-8. G) Graphs showing the length and surface of mitochondria of RPTEC-Sh-Control and RPTEC-Sh-DRP1. H) Percentage of mitochondria within 3 μm of the nucleus of RPTEC-Sh-Control and RPTEC-Sh-DRP1 in the presence or absence of Gal-8. (Mean ± s.d., n = 3, 15 cells per experiment, One-Way ANOVA with a posterior Tukey or Kruskal–Wallis with a posterior Dunn's test *p < 0.05, **p < 0.01, ***p < 0.001). Scale bar = 10μm.
Fig. 6
Fig. 6
Gal-8 promotes mitophagy in carbohydrate- and ERK activity-dependent manners impacting on cell proliferation. A) Live-cell imaging confocal microscopy of MDCK-FIS1-Keima cells treated with Gal-8, Gal-8-R69H, Gal-8-R275H, or Gal-8-R69H-R275H (50 µg/ml) for 24 hours. B) Graph showing the quantification of mitochondria in mitophagy (red). C) Live-cell imaging confocal microscopy of MDCK-MT-Keima treated with Gal-8 (50 μg/ml) in the presence or absence of MEK inhibitor PD98059 (25 μM) for 24 hours, using CCCP as inducer of mitophagy. (D) Graph showing the quantification of mitochondria in mitophagy (red). E) Ki67 positive cell rate in MDCK cells treated with Gal-8 (50 μg/ml) in the presence or absence of Bafilomycin A (100 nM) for 24 hours. (Mean ± s.d., n = 3, 15 cells per experiment for mitophagy, 300 cells per experiment for proliferation, One-Way ANOVA with a posterior Tukey, **p < 0.01, ***p < 0.001). Scale bar = 10μm for A-C) and 100μm for E).
Fig. 7
Fig. 7
Gal-8 promotes a glycolytic state with no variation on the basal OCR. A) Profile of Seahorse XFp Cell Mito Stress Test assay in MDCK cells treated with vehicle or Gal-8 (50 µg/ml) for 24 hours. The graph shows the relative values of parameters in (A). B) Graph showing the basal ECAR measurement obtained using the Seahorse XFp assay. C) Lactate levels in MDCK cell lysates. D) TMRE fluorescence intensity in MDCK cells. (Mean ± s.d., n = 3 or 4, T-student, **p < 0.01, ***p < 0.001, One-Way ANOVA with a posterior Tukey, **p < 0.01, ***p < 0.001). Scale bar = 10μm.

References

    1. Adebayo M., Singh S., Singh A.P., Dasgupta S. Mitochondrial fusion and fission: the fine-tune balance for cellular homeostasis. FASEB J. 2021;35(6) doi: 10.1096/fj.202100067R. - DOI - PMC - PubMed
    1. Ahmad T., Aggarwal K., Pattnaik B., Mukherjee S., Sethi T., Tiwari B.K., Kumar M., Micheal A., Mabalirajan U., Ghosh B., Sinha Roy S., Agrawal A. Computational classification of mitochondrial shapes reflects stress and redox state. Cell Death Dis. 2013;4(1) doi: 10.1038/cddis.2012.213. - DOI - PMC - PubMed
    1. Albornoz N., Alvarez-Indo J., de la Pena A., Arias-Munoz E., Coca A., Segovia-Miranda F., Kerr B., Budini M., Criollo A., Garcia-Robles M.A., Morselli E., Soza A., Burgos P.V. Targeting the immunoproteasome in hypothalamic neurons as a novel therapeutic strategy for high-fat diet-induced obesity and metabolic dysregulation. J. Neuroinflamm. 2024;21(1):191. doi: 10.1186/s12974-024-03154-z. - DOI - PMC - PubMed
    1. Al-Mehdi A.B., Pastukh V.M., Swiger B.M., Reed D.J., Patel M.R., Bardwell G.C., Pastukh V.V., Alexeyev M.F., Gillespie M.N. Perinuclear mitochondrial clustering creates an oxidant-rich nuclear domain required for hypoxia-induced transcription. Sci. Signal. 2012;5(231):ra47. doi: 10.1126/scisignal.2002712. - DOI - PMC - PubMed
    1. Anderson C.C., Aivazidis S., Kuzyk C.L., Jain A., Roede J.R. Acute maneb exposure significantly alters both glycolysis and mitochondrial function in neuroblastoma cells. Toxicol. Sci. 2018;165(1):61–73. doi: 10.1093/toxsci/kfy116. - DOI - PMC - PubMed

Substances

LinkOut - more resources